

Abstract
Native Americans (NAs) experience higher rates of chronic pain than the general U.S. population, but the risk factors for this pain disparity are unknown. NAs also experience high rates of stressors and cardiovascular and metabolic health disparities (eg, diabetes, cardiovascular disease) consistent with allostatic load (stress-related wear-and-tear on homeostatic systems). Given that allostatic load is associated with chronic pain, then allostatic load may contribute to their pain disparity. Data from 302 healthy, pain-free men and women (153 NAs, 149 non-Hispanic Whites [NHW]) were analyzed using structural equation modeling to determine whether cardiometabolic allostatic load (body mass index, blood pressure, heart rate variability) mediated the relationship between NA ethnicity and experimental measures of pronociceptive processes: temporal summation of pain (TS-pain) and the nociceptive flexion reflex (TS-NFR), conditioned pain modulation of pain (CPM-pain) and NFR (CPM-NFR), and pain tolerance. Results indicated that NAs experienced greater cardiometabolic allostatic load that was related to enhanced TS-NFR and impaired CPM-NFR. Cardiometabolic allostatic load was unrelated to measures of pain perception (CPM-pain, TS-pain, pain sensitivity). This suggests cardiometabolic allostatic load may promote spinal sensitization in healthy NAs, that is not concomitant with pain sensitization, perhaps representing a unique pain risk phenotype in NAs.
Keywords: allostatic load, descending inhibition, central sensitization, quantitative sensory testing, ethnic differences, pain modulation
Introduction
Back pain8,37, arthritis46,83, headaches108, dental pain77, and other chronic pain states are more prevalent in Native Americans (NAs) than the general U.S. population8,67,146. Moreover, NAs have endured generations of extreme stressors, including genocide, forced relocation, and boarding school placement43, and studies suggest they continue to experience high levels of psychosocial stressors (eg, trauma, adversity)15,17,38,150. Thus, stressors may contribute to their pain disparity72,135, as it does with other health disparities141.
Allostasis is the physiologic balance maintained in the face of change86; but, when constantly pushed out of balance by stressors, this causes wear-and-tear on systems that maintain balance (ie, allostatic load)121 and can ultimately lead to disease88. Allostatic load can be measured by neuroendocrine (eg, cortisol), cardiovascular (eg, blood pressure), metabolic (eg, body mass index), immune (eg, C-reactive protein), and parasympathetic (eg, heart rate variability) outcomes121 and are often combined to create a cumulative score70,121,126. Surprisingly few studies have directly studied allostatic load in NAs140,141, but numerous studies have shown that NAs experience high rates of allostatic load corollaries. For example, NAs are 1.5× more likely to be obese, 1.3× more likely to have high blood pressure, and 1.2× more likely to be physically inactive, compared to non-Hispanic Whites (NHWs)24,26. They also have the highest age-adjusted rates of diabetes in persons ≥20 years old25. Moreover, one study found that young NA adults showed blunted cortisol and cardiovascular reactivity to acute stress68, a marker of allostatic load associated with early life adversity23,70.
Chronic pain is often comorbid with secondary and tertiary effects of allostatic load on the cardiovascular and metabolic systems (eg, cardiovascular disease, diabetes)45,54,81,82,138,142; but, there have been relatively few attempts to assess the relationship between allostatic load and pain in disease-free persons. One study of U.S. adults found that allostatic load was associated with a higher prevalence of severe headaches, pain lasting ≥24 hours, and widespread body pain133 and other studies found that it was associated with chronic pain severity in Norwegian adults131 and older English adults129. However, these studies cannot rule out that these relationships are due to chronic pain promoting allostatic load, given that chronic pain is a stressor130. Alternatively, one could study pain-free participants to determine if there is a relationship between allostatic load and pronociceptive mechanisms known to increase chronic pain risk (eg, enhanced pain facilitation, impaired descending inhibition, hyperalgesia)153. To our knowledge, no study has addressed this issue.
The current study addressed this issue via an ancillary analysis (153 NAs, 149 NHWs) of data from the Oklahoma Study of Native American Pain Risk (OK-SNAP)114,115. Healthy participants were studied to ensure that any observed relationships were not due to disparities in chronic pain severity and/or pain treatment28,85,143. Neuroendocrine and immune markers were not assessed in OK-SNAP; thus, a “cardiometabolic allostatic load” latent variable was modeled from cardiovascular (mean arterial blood pressure, MAP), metabolic (body mass index, BMI), and parasympathetic (heart rate variability, HRV) indicators. Although we found few ethnic differences in pronociceptive processes in OK-SNAP, indirect pain promoting pathways can be identified using mediation analysis102,103. Indeed, ethnic difference in pronociceptive processes may only emerge in the presence of other factors (eg, pain-related anxiety, pain catastrophizing), as we have demonstrated previously113,144. Thus, current analyses examined whether indirect (mediated) paths linked NA ethnicity to pronociceptive processes via cardiometabolic allostatic load. Analyses were conducted with and without controlling for variables that could influence this relationship. We predicted that NAs would experience higher cardiometabolic allostatic load which would be associated with impaired descending inhibition (ie, conditioned pain modulation), enhanced nociceptive facilitation (ie, temporal summation), and reduced pain tolerance (latent variable assessed from heat, cold, ischemia, and electric pain tolerances).
Materials and Methods
Participants
Healthy, pain-free participants were recruited in OK-SNAP. Recruitment efforts included tribal and non-tribal newspaper ads, fliers, personal communications with NA groups, email announcements, online platforms (eg, Facebook), and word of mouth. Those deemed eligible following an initial phone screen were invited to attend a laboratory testing day, which began with a thorough screening for inclusion/exclusion criteria. Data collection occurred between March 2014 and October 2018.
Participants were excluded for: 1) <18 years old, 2) history of self-reported cardiovascular, neuroendocrine, musculoskeletal, neurological disorders, 3) self-reported chronic pain or current acute pain, 4) BMI≥35 (due to difficulties recording electromyogram for NFR), 5) current/recent use of anti-depressants, anxiolytic, analgesic, stimulant, or anti-hypertensive medication, 6) current psychotic symptoms (assessed by Psychosis Screening Questionnaire12) or substance use problems, and/or 7) an inability to read and speak English. NA status was verified from Certificate of Degree of Indian Blood or tribal membership cards. NA participants represented tribal nations predominately from the southern plains and eastern Oklahoma tribes. To respect tribal confidentiality, tribal affiliations are not reported. Before they provided verbal and written informed consent, all participants were given an overview of procedures and told they could withdraw at any time. Participants received a $100 honorarium for the completion of each testing day. The study was approved by IRBs of The University of Tulsa, Cherokee Nation, and the Indian Health Service Oklahoma City Area Office.
Power analyses for primary aims of the parent (OK-SNAP) study were conducted with G*Power (version 3.1.9.2). These analyses were based on effect sizes of pain outcomes derived from our pilot study of pain processing in NAs (Cohen’s d’s ranged from 0.10 to 0.89)97, as well as effect sizes for race/ethnic differences in CPM from Campbell et al (d=0.53 to 0.72)22. These analyses suggested that 120 per group (N=240 total) would result in power of 0.80 for most of the outcomes associated with the primary aims of the parent study (power=.80 for effect sizes d≥.36 at alpha=.05). Thus, that was the targeted sample size for completion of all study tasks. Racial/ethnic group differences associated with the main study findings have been reported elsewhere114,115.
Of the 329 found eligible, 2 participants’ data were lost due to a computer malfunction, 22 participants were non-NA minorities and thus were excluded from analyses, and 3 were excluded for having Type 1 or Type 2 diabetes. Thus, a total of 302 participants (153 NA and 149 NHW) were available for analysis in the current study. 227 (75%) of the 302 participants completed both testing days, 46 (15%) completed one testing day, and 29 (10%) completed only partial tasks during one testing day. When participants quit during testing, 29 quit during pain modulation day (4 during NFR threshold, 4 during 3-stimulation threshold, 2 during single suprathreshold electric stimulations, 9 during TS-NFR, 7 during CPM, 3 during ECON) and 3 quit during the pain tolerance day (2 suprathreshold heat, 1 due to inclement weather) – Note: these numbers do not sum to 29 because some participants quit during a task on the second day. Table 1 presents means and SDs of study variables by ethnic group, as well as reports the samples sizes for each variable.
Table 1.
Racial/ethnic group differences in study variables (N=302).
| non-Hispanic Whites | Native Americans | ||||||||||
|---|---|---|---|---|---|---|---|---|---|---|---|
| Variable | N | M | SD | N | M | SD | t-test | p-value | Cohen’s d | ||
| Age (years) | 149 | 28.56 | 13.53 | 153 | 30.60 | 12.67 | −1.84 | 0.067 | 0.212 | ||
| Physical Activity (IPAQ; MET mins/week) | 149 | 7905.90 | 7000.14 | 152 | 9930.62 | 8631.91 | −1.49 | 0.138 | 0.171 | ||
| Subjective Sleep Quality (PSQI 9; 0–3) | 117 | 0.96 | 0.64 | 115 | 1.26 | 0.85 | −3.08 | 0.002 | 0.405 | ||
| Perceived Stress (PSS; 0–40) | 146 | 13.10 | 6.00 | 147 | 14.54 | 6.04 | −2.04 | 0.042 | 0.238 | ||
| Psychological Distress (GSI of SCL-90; 0–1) | 146 | 0.32 | 0.32 | 147 | 0.42 | 0.40 | −2.54 | 0.012 | 0.296 | ||
| General Health Scale (SF-36; 0–100) | 146 | 80.45 | 13.62 | 147 | 78.64 | 13.52 | 1.14 | 0.256 | 0.133 | ||
| Mean Arterial Blood Pressure (mmHg) | 147 | 83.16 | 8.19 | 147 | 88.60 | 10.69 | −4.96 | <.001 | 0.579 | ||
| Body Mass Index (BMI; kg/m2) | 148 | 24.15 | 3.80 | 149 | 25.90 | 4.48 | −3.62 | <.001 | 0.420 | ||
| Heart Rate Variability (RMSSD; ms) | 129 | 51.74 | 37.13 | 122 | 50.97 | 40.02 | 0.46 | 0.645 | 0.058 | ||
| CPM of Pain (Δpain; −100 to +100) | 127 | −5.69 | 7.26 | 119 | −7.63 | 8.48 | 1.93 | 0.055 | 0.246 | ||
| CPM of NFR (ΔNFR; d-units) | 126 | −0.05 | 0.39 | 117 | 0.01 | 0.40 | −1.10 | 0.275 | 0.141 | ||
| TS-Pain (Δpain; −100 to +100) | 122 | 11.11 | 14.37 | 119 | 13.16 | 13.78 | −1.13 | 0.258 | 0.146 | ||
| TS-NFR (ΔNFR; d-units) | 128 | 0.49 | 0.54 | 128 | 0.58 | 0.48 | −1.42 | 0.158 | 0.177 | ||
| Heat Tolerance (°C) | 129 | 45.81 | 2.07 | 124 | 45.55 | 1.59 | 1.15 | 0.253 | 0.143 | ||
| Cold Tolerance (sec) | 130 | 1.80 | 0.42 | 124 | 1.66 | 0.31 | 2.98 | 0.003 | 0.371 | ||
| Ischemia Tolerance (sec) | 129 | 2.20 | 0.42 | 125 | 2.12 | 0.45 | 1.50 | 0.136 | 0.188 | ||
| Electric Tolerance (mA) | 129 | 30.51 | 13.31 | 125 | 31.12 | 12.94 | −0.37 | 0.712 | 0.046 | ||
Note: For ease of interpretation, means/SDs that are reported here are untransformed and prior to multiple imputation. The Cohen’s d effect sizes are calculated from variables that were corrected for non-normality and outliers, but prior to multiple imputation. IPAQ=International Physical Activity Questionnaire; MET= metabolic equivalence of task; PSS=Perceived Stress Scale; GSI=Global Severity Index; SCL=Symptom Checklist; RMSSD=root mean square of successive differences; CPM=conditioned pain modulation; TS-pain=temporal summation of pain; TS-NFR=temporal summation of the nociceptive flexion reflex; mA=milliamperes.
The sample size estimates needed for structural equation modeling are typically based on N-to-parameter ratios, with ratios varying between 10:1125 and 20:174. In the present study, the model predicting TS/CPM outcomes had a ratio of 16:1 and the model predicting pain tolerance had a ratio of 14:1. However, when control variables were added to these models, the ratios were lower, so the models with controls are interpreted with caution and primarily used to examine whether results were similar with statistical controls in place.
Brief Overview of Procedures
A full description of OK-SNAP procedures is reported elsewhere115. Pain testing was conducted over a 2-day period (4–6 hours/day). Informed consent and inclusion/exclusion screening were conducted on the first day. On one of the testing days, electric, heat, cold, and ischemia pain tolerance were assessed with breaks in between tasks. On the other testing day, measures of pain modulation were assessed. Specifically, conditioned pain modulation (CPM) was used to assess descending inhibition and temporal summation (TS) was used to assess nociceptive facilitation. Importantly, pain report and the nociceptive flexion reflex (NFR) were assessed as outcomes during CPM and TS. NFR is a polysynaptic, spinal reflex elicited in response to Aδ fiber activation, so it is used as a measure of spinal nociception124. Although the reflex arc does not require supraspinal input, the reflex can be modulated by descending input from supraspinal centers124. Thus, assessing the NFR during CPM (ie, CPM-NFR) and TS (ie, TS-NFR) allow investigators to examine the effects of these processes on spinal nociception, while at the same time assessing the effect on pain perception (ie, CPM-pain, TS-pain). Fig 1 provides an overview of study procedures, but the reader is referred to the parent study for a full description of all procedures115.
Figure 1.

Study procedures across the two testing days.
Order of testing days was randomized but blocked by ethnicity and sex. Moreover, tests within each day were partly randomized to avoid order effects. Breaks were provided between tasks to minimize carryover.
Testing Environment and Apparatus
During testing, participants were seated in a comfortable reclining chair (Perfect Chair Zero Gravity Recliner, Human Touch, Long Beach, CA) in a sound-attenuated and electrically shielded room. The experimenter sat in an adjacent room and monitored testing using audio and video equipment. Questionnaires were presented by a computer. Custom-built software (LabVIEW; National Instruments, Austin, TX) was used to control most experimental procedures.
Electric pain stimuli were delivered via constant current stimulator (Digitimer DS7A; Hertfordshire, England) and a bipolar electrode (Nicolet; 30 mm inter-electrode distance) filled with a conductive gel (EC60, Grass Technologies) that was attached on the participant’s left ankle. Heat stimuli were delivered using a Medoc (Haifa, Israel) Pathway device with a Contact Heat Evoked Potential Stimulator (CHEPS) thermode. A circulating water bath (Thermo Fisher Scientific, Pittsburgh, PA) was used to assess cold pain tolerance, and as the painful conditioning stimulus in the CPM task. The water level was kept constant (6″ deep) across all participants to keep procedures standardized and to maintain similar cold exposure to participants’ hands/forearms.
For procedures that assessed the nociceptive flexion reflex (NFR), the skin was first cleaned with alcohol and then exfoliated (Nuprep gel; Weaver and Company, Aurora, CO) to achieve impedances <5kΩ. Recording electrodes filled with conductive gel (EC60; Grass Technologies, West Warwick, RI) were placed over the left biceps femoris (hamstring) muscle to assess the reflex from electromyogram (EMG). The signal was filtered (10 Hz to 300 Hz) and amplified (×10,000) using a Grass Technologies Model 15LT amplifier with AC Module 15A54. Sampling and digitization (1000 Hz) of the signal was achieved using a National Instruments (Austin, TX) analog-to-digital converter, before being stored to a computer hard drive.
Pain Modulation: Temporal Summation (TS) and Conditioned Pain Modulation (CPM)
Determination of Electric Stimulus Intensity for TS and CPM.
To determine the electric stimulus intensity (in mA) to use during pain modulation tasks, 3 procedures were conducted to calibrate the stimulus to each participant (for a full description of these procedures see,115):
NFR threshold – To assess the intensity of the stimulus to reliability elicit the reflex (ie, NFR threshold), 3 ascending/descending staircases of electric stimuli were presented in which the stimulus intensity was increased until a reflex was obtained, and then the intensity was decreased until the reflex disappeared (this happened 3 times)50,110,
Pain30 – if electric stimuli delivered at NFR threshold did not evoke a 30 out of 100 rating on a visual analog scale (VAS) ranging from “no pain sensation” to “the most intense pain sensation imaginable,” then an ascending series of electric stimulations was administered to determine stimulus needed to evoke Pain30, and
3-stimulation threshold – an ascending staircase of trains of 3 stimuli (at 2 Hz; ie, 0.5-s interstimulus interval [ISI]) were delivered that was used to determine the stimulus intensity needed to evoke an NFR on the 3rd stimulus in the train.
Stimuli during TS-NFR assessment were set at 1.2× NFR threshold or 1.2× of 3-stimulation threshold (whichever was higher), whereas stimuli during CPM assessment were set at the highest of 1.2× NFR threshold, 1.2× 3-stimulation threshold, or 1× Pain30. Together, these procedures ensure that suprathreshold stimuli evoke reliable NFRs and suprathreshold pain perception.
Temporal Summation of the Nociceptive Flexion Reflex (TS-NFR).
TS-NFR is believed to be a physiological marker of human central (spinal) sensitization, because a series of constant-intensity electric stimulations evokes a summation of the reflex4,6 that is dependent on NMDA receptors5,58 (similar to wind-up in animals)34,90,91. Although NFR is driven by A-δ fiber activation, the electric stimulus series depolarizes both A-δ and C-fibers, and the C-fiber activation thus leads to windup of wide dynamic range (WDR) neurons. Supporting this, animal studies have simultaneously recorded the activity of single motor units (part of the circuitry associated with the motor output of the NFR) and the activity of WDR neurons and found that summation of the single motor units was correlated with the summation of WDR neurons157,158. Moreover, TS-NFR is enhanced in individuals with chronic pain and central sensitization7. When taken together, this evidence indicates that TS-NFR can be used to assess facilitation of spinal nociceptive neurons.
TS-NFR was defined as the degree of reflex summation following a series of 3 suprathreshold stimuli. To assess this, 5 series of 3 suprathreshold stimuli (0.5 s ISI; ie, 2 Hz) were delivered. We have shown that TS-NFR is best assessed from a series of 3 suprathreshold electric stimulations at this frequency137 because it maximizes the summation in NFR (responses to longer series results in asymptote of the reflex) and minimizes participant exposure to noxious stimuli. After each series, participants were instructed to rate the pain intensity for each of the 3 stimulations, using a set of 3 computer-presented VASs (described previously). After the participant completed the ratings, there was an inter-series interval of 8–12 s. The baseline EMG in the 60 ms prior to the third stimulus in the series was visually inspected for excessive muscle tension or voluntary movement (ie, mean rectified EMG >5μV). If present, the series was repeated. NFR magnitudes were calculated in d-units by subtracting the 60 ms baseline prior to the first stimulus in each series from the EMG response 70–150 ms after each stimulus in the train (Note: this post-stimulus interval starts earlier than the 90–150 ms interval used for NFRs elsewhere in this study because prior research has indicated TS procedures can decrease the onset latency of NFRs137). This difference was then divided by the average of the SDs of the rectified EMG from these two intervals. TS-NFR was defined as the difference in the NFR magnitude in response to the 3rd stimulus in the series minus the NFR magnitude in response to the 1st stimulus in the series. This TS-NFR change score was averaged across the 5 series.
Temporal Summation of Pain (TS-Pain).
Temporal summation of pain is believed to be the psychophysical correlate of spinal neuron facilitation40,104, but TS-NFR and TS-Pain can diverge116 indicating that the nociceptive signal may undergo additional supraspinal modulation after ascending from the spinal level to impact the degree of pain perception facilitation. Thus, for the current study, TS-Pain will be used to assess pain facilitation.
Assessing TS-Pain from the 3-stimulus series noted above is not ideal, because the 2 Hz series is too fast for participants to make pain ratings immediately following each stimulus. Thus, all 3 ratings must be made after the last stimulus, which can be affected by recall bias, especially for the first two stimuli in the series.
Therefore we took a different approach to define TS-Pain; one that has been used by other studies using both electric44 and mechanical53 stimuli. 5 single electric stimuli were delivered using the same suprathreshold intensity as that used during TS-NFR. However, these stimuli had an interstimulus interval that would preclude the evocation of temporal summation (i.e., 8–12 s ISI; 0.125 to 0.08 Hz). Participants made pain ratings immediately after each stimulus using the VAS described above. Thus, TS-Pain was defined as the difference between the average rating of these single stimuli (in which no pain summation had occurred) and the average rating of the 3rd stimulus in the 3-stimulus train delivered during TS-NFR (in which pain summation had occurred).
Conditioned Pain Modulation (CPM).
Our CPM procedures involved assessment of pain and NFR in response to electric test stimuli delivered to the ankle before and during a tonic conditioning stimulus (CS; circulating, 2-min, 10±0.1°C water bath). When applied in this way, prior research has shown that two dissociable modulatory circuits are engaged: a cerebrospinal circuit that modulates NFR and supraspinal inhibitory circuit that modulates pain perception99. Thus, CPM-NFR was used to assess descending inhibition of spinal nociception (shortened to “spinal inhibition” in the Tables/Figures), whereas CPM-Pain was used to assess pain inhibition.
Each CPM phase was 2-min and consisted of a 20 s wait period, followed by 5 electric test stimuli (random 8–12 s inter-stimulus interval). There was a 2-min break between CPM phases. Participants provided electric pain ratings during CPM using a numerical rating scale (NRS) that was displayed on a computer screen in front of them. The scale had verbal anchors every 20 points (0 “no pain”, 20 “mild pain”, 40 “moderate pain”, 60 “severe pain”, 80 “very severe pain”, and 100 “worst possible pain”), but participants were encouraged to use the full scale. Participants were asked to say their ratings aloud (due to having their hand in the cold water) and an experimenter recorded the ratings while they observed from the adjacent room. After the CS was administered, participants rated it on the same NRS. As we have reported elsewhere115, the CS elicited moderate to severe pain that did not differ between the groups (NRS mean rating=54).
NFR magnitudes in response to electric test stimuli were used to assess changes in spinal nociception111. NFR magnitudes were calculated as a d-score [NFR d = (mean rectified EMG of 90 to 150 ms post-stimulation interval minus mean of rectified EMG from −60 to 0 ms prestimulation interval) divided by the average SD of the rectified EMG from the two intervals]. Trials with NFR baselines whose average EMG was >3.0 μV were excluded (3% of trials were excluded). CPM-pain/CPM-NFR was defined as the difference in the average electric pain/NFR assessed during the CS minus the average electric pain/NFR assessed during the baseline phase. A “sham” CPM task was also employed which was identical to the real CPM task with the exception that a 26°C non-painful water bath was used as the conditioning stimulus (results not presented). The order of CPM and sham CPM was randomized and there was a 15 min break between the two to avoid carry over effects. HRV was recorded during the breaks that followed each CPM task.
Pain Tolerance
Although different stimulus modalities are known to impact different receptor types and nociceptive processes105, different measures of pain tolerance should assess a common underlying latent construct associated with the ability to tolerate noxious stimuli. Consistent with this, we found that electric, heat, cold, and ischemic pain tolerance were all correlated about r=.40 (see Table 2). Therefore, we used SEM to model a latent pain tolerance variable from these observed variables.
Table 2.
Means, SDs, and Pearson’s correlations among all study variables (N=302)
| Variable | M | SD | CPM pain |
CPM NFR |
TS pain |
TS NFR |
Heat Tol |
Cold Tol |
Isch Tol |
Elec Tol |
Race | Sex | Age | Exer | Sleep Q | Stress | Psych | Gen Hlth | MAP | BMI |
|---|---|---|---|---|---|---|---|---|---|---|---|---|---|---|---|---|---|---|---|---|
| CPM-pain | −6.63 | 7.91 | 1 | |||||||||||||||||
| CPM-NFR | −.02 | .39 | −.014 | 1 | ||||||||||||||||
| TS-pain | 12.12 | 14.09 | .021 | .012 | 1 | |||||||||||||||
| TS-NFR | .53 | .52 | −.076 | .226* | .160* | 1 | ||||||||||||||
| Heat Tol | 45.68 | 1.85 | −.079 | .023 | −.042 | .146* | 1 | |||||||||||||
| Cold Tol (log) | 1.73 | .38 | .091 | −.141* | −.047 | −.021 | .429* | 1 | ||||||||||||
| Isch Tol (log) | 2.16 | .44 | .010 | −.149* | −.067 | .098 | .442* | .380* | 1 | |||||||||||
| Elec Tol | 30.81 | 13.11 | .091 | −.081 | −.035 | .091 | .401* | .422* | .375* | 1 | ||||||||||
| NA Race | — | — | −.123 | .070 | .073 | .088 | −.072 | −.183* | −.094 | .023 | 1 | |||||||||
| Female Sex | — | — | .057 | −.140* | .039 | −.120 | −.354* | −.129* | −.159* | −.060 | .085 | 1 | ||||||||
| Age (log) | 1.44 | .17 | .139* | .152* | .184* | .295* | .056 | −.168* | −.029 | −.005 | .106 | .045 | 1 | |||||||
| Exercise (log) | 3.76 | .45 | .117 | .116 | .188* | .124* | .058 | .046 | .014 | .094 | .086 | −.117* | .066 | 1 | ||||||
| Sleep Q | 1.11 | .76 | .085 | .059 | .185* | .047 | .043 | .054 | .012 | .131* | .200* | −.055 | −.093 | .118 | 1 | |||||
| Stress | 13.82 | 6.05 | .031 | .081 | .074 | .035 | −.092 | .079 | −.002 | .089 | .119* | −.013 | −.201* | .063 | .337* | 1 | ||||
| Psych (log) | .12 | .09 | .055 | .111 | .153* | .075 | .022 | .106 | .057 | .095 | .147* | −.021 | −.084 | .076 | .426* | .705* | 1 | |||
| Gen Hlth | 79.54 | 13.58 | .069 | −.008 | −.004 | −.039 | .026 | .048 | −.042 | −.064 | −.067 | .029 | .063 | .035 | −.215* | −.333* | −.341* | 1 | ||
| MAP | 85.57 | 8.98 | −.084 | .153* | .128* | .224* | .216* | −.024 | .044 | .036 | .279* | −.194* | .433* | .002 | .110 | −.034 | .065 | −.086 | 1 | |
| BMI | 25.03 | 4.24 | .013 | .142* | −.014 | .137* | .037 | −.095 | −.151* | .068 | .206* | −.082 | .345* | .064 | −.003 | −.002 | .039 | −.081 | .362* | 1 |
| HRV (log) | 1.62 | .28 | −.065 | −.151* | .017 | −.124 | −.021 | .103 | −.028 | −.054 | −.029 | −.111 | −.408* | .122 | .072 | .015 | .013 | .053 | −.275* | −.141* |
Note: Means, SDs and intercorrelations are based on variables that were transformed for normality and for which missing variables were estimated using multiple imputation. CPM=conditioned pain modulation; NFR=nociceptive flexion reflex; TS=temporal summation; Tol=Tolerance; NA Race (0=non-Hispanic Whites, 1=Native American); Female Sex (0=male, 1=female); MAP=mean arterial pression; BMI=body mass index; HRV=heart rate variability; Sleep Q=sleep quality; Gen Hlth=General Health.
p<.05
Electric Tolerance.
Electric pain tolerance was assessed using a single ascending staircase of stimulations that started at 0 mA and increased in 2 mA steps. After each stimulus, the participant rated their pain on the computer-presented VAS described earlier. The stimulations increased until the participant rated the stimulus as the maximum tolerable pain and the stimulus intensity (mA) was recorded as pain tolerance111.
Heat Tolerance.
Heat pain tolerance was assessed 5 times (1 practice, 4 averaged trials) by attaching the CHEPS thermode to the participants’ left volar forearm21. Each trial started from a baseline of 32°C and heated at a rate of 0.5°C/s until the participant terminated the stimulus by pushing a button when the heat became intolerable. The maximum intensity was set to 51°C.
Cold Tolerance.
Cold pressor tolerance was assessed by asking participants to submerge their hand and forearm (fingers spread apart) into a 6±0.1°C circulating water bath21,89,109. During submersion, participants made continuous ratings on the same VAS described earlier. The time (sec) until a rating of maximum tolerable was defined as pain tolerance (or 5-mins max was reached).
Ischemia Tolerance.
Ischemia tolerance was assessed using a forearm tourniquet test47. Participants conducted hand exercises using a dynamometer (Lafayette Instrument Company, IN) at 50% grip strength for 2 min (1×/sec), then raised their arm for 15 s to allow desanguination. A blood pressure cuff was then inflated over the arm’s bicep muscle to 220 mmHg to occlude blood flow. During occlusion, participants continuously rated their pain on the previously described VAS and the time taken (sec) to achieve a rating of maximum tolerable was defined as pain tolerance (or 25-min max was achieved).
Cardiometabolic Allostatic Load
Allostatic load represents wear-and-tear on stress regulation systems (cardiovascular, metabolic, immune, neuroendocrine, parasympathetic). In early studies126, allostatic load was measured from 10 indicators that were divided into primary (ie, DHEA, cortisol, epinephrine, norepinephrine) and secondary (ie, systolic/diastolic blood pressure, waist-to-hip ratio, HDL cholesterol, HbA1c) outcomes. This list has been expanded to include several measures of cardiovascular (eg, blood pressure, total cholesterol, HDL cholesterol, triglycerides, heart rate, homocysteine, FEV1/FVC, pulse pressure), metabolic (eg, body mass index, waist-to-hip ratio, HbA1c, albumin, glucose, waist circumference, LDL cholesterol, triglycerides, creatine, homocysteine, HOMA-IR, apolipoprotine A1 and B), immune (eg, C-reactive protein, IL-6, IL-1, IL-10, herpes simplex, fibrinogen, insulin-like growth factor-1, white blood cell count, TNF-α), neuroendocrine (eg, cortisol, epinephrine, norepinephrine, DNEA, dopamine, aldosterone, adnephrin), and parasympathetic (eg, heart rate variability) systems121. It is rare that all indices are used, but the individual indices are typically combined in some way to create a measure of overall allostatic load121.
OK-SNAP was designed to assess pronociceptive mechanisms in otherwise healthy, pain-free NAs, but it was not specifically designed to assess allostatic load. For this reason, the present study focused on markers of allostatic load that were collected as part of the general health of participants in the study. The 3 indices that were available primarily assessed cardiovascular and metabolic domains (blood pressure, heart rate variability, body mass index). Prior studies have shown that all 3 are individually associated with pronociceptive processes and/or chronic pain3,19,62,155.
The overall allostatic load variable is oftentimes created by first calculating quartiles of each marker and then a count is created from the number of markers that fall into the high risk quartile (typically the upper quartile)121. A limitation of this approach is that it does not consider the full range of risk for each marker, because it assumes that only the upper quartile confers risk. Thus, other approaches have been used to account for the full range of risk. For example, the z-score allostatic load index70 first converts each variable to a z-score based on the sample’s distribution and then a linear combination of the z-scores is created by summing them to get a total score. We took a similar approach and created a latent variable to form a linear combination of the 3 markers of cardiovascular (blood pressure), metabolic (body mass index) and parasympathetic (heart rate variability) functioning. This allowed us to create a continuous measure of cardiometabolic allostatic load that accounts for the full continuum of risk. Plus, this approach has the advantage of modeling and removing measurement error from each indicator64.
Body Mass Index (BMI).
Weight and height were assessed from a medical scale to calculate BMI. Higher BMI is indicative of greater allostatic load121.
Blood Pressure.
Blood pressure (mean arterial blood pressure, MAP) was assessed 3 times (3 min inter-test interval) at rest on the first testing day (Dinamap; Tampa, FL) before any testing occurred. Participants sat still in a chair with their arm on the armrest. Higher blood pressure is indicative of greater allostatic load121.
Heart Rate Variability (HRV) During Pain Recovery.
The parasympathetic nervous system is the branch of the autonomic nervous system responsible for “rest and digest” functions and serves to return homeostasis following “fight or flight” (ie, stress) reactions84. Given this, impairments of parasympathetic control can lead to allostatic load139. Respiratory sinus arrythmia (RSA) refers to the increase and decrease in heart rate caused by inhalations and exhalations, respectively, of the respiratory cycle. RSA is believed to be mediated exclusively by the parasympathetic nervous system (ie, vagal nerve)2 and can be measured by some HRV metrics, such as the root mean square of successive differences (ie, RMSSD) between beat-to-beat intervals in the electrocardiogram (ECG) signal2,128. To assess the functioning of the parasympathetic nervous system during recovery from pain tasks, HRV was assessed from two 5-min breaks that occurred in between pain tasks on the pain modulation assessment day. During the assessment, participants were seated in a reclining chair and told to get into a comfortable position, relax, and not move while baseline physiology was recorded for 5-mins. The recording began only after they pressed a button to indicate that they were ready.
During each 5-min period, ECG was measured using a Grass Technologies (West Warwick, RI) Model 15LT amplifier (with AC Module 15A54). One active electrode was placed near the right clavicle bone and the other electrode was placed on the lower left abdomen. ECG was sampled at 1000 Hz. Beat-to-beat (ie, RR) intervals were identified offline by an experimenter using custom-built LabVIEW software. In the event of an ectopic beat, the R-spike was estimated to be equally spaced between the adjacent R-spikes. HRV analysis software95 was used to trim 30-s off the beginning and end of each record (to account for subjects acclimating to the task), then the trimmed RR-interval records were used to calculate RMSSD. The average RMSSD of these two rest periods was used as the measure of parasympathetic activity. Lower RMSSD is indicative of greater allostatic load121. As evidence of the validity of our HRV measurement, Table 2 demonstrates that HRV was negatively correlated with age and BMI, as shown in prior research1. Further, mean (untransformed) RMSSD was 51.36 ms (SD=38.49), which is within the normative range of other studies (ie, M=42 ms, Range=19–75)128, and mean heart rate during this period was 66.45 (SD=11.73), suggesting that participants did not continue to experience significant stress during these break periods.
Control Variables
The statistical models were tested with and without control variables that might influence the relationship between cardiometabolic allostatic load and pronociceptive processes. Older age32,127, biological sex (particularly male sex for cardiovascular indices)70, and lower physical activity level49 (assessed from the International Physical Activity Questionnaire31,60) are associated with higher allostatic load; therefore, they were controlled in the pathway linking NA ethnicity to cardiometabolic allostatic load to ensure greater allostatic load in NAs was not due to individual differences in these variables. Moreover, older age59, female sex9, and lower physical activity93,94 are also associated with increased pain risk; therefore, these variables were also controlled in the paths between cardiometabolic allostatic load and pain outcomes. In the parent OK-SNAP study115, we found ethnic group differences on general health perception (subscale of the Medical Outcomes Study 36-item Short Form Health Survey, SF-36)148, self-reported sleep quality (assessed from the subscale of the Pittsburgh Sleep Quality Index, PSQI)20, perceived stress (assessed from the Perceived Stress Scale, PSS)29, and psychological distress (assessed from the Global Severity Index [GSI] of the Symptom Checklist-90-Revised, SCL-90-R)36, so these variables were controlled in the paths linking allostatic load to pain outcomes. And finally, because we individually calibrated the electric stimulus intensity during TS and CPM to each participant’s reflex thresholds rather than their pain threshold/tolerance, this could have impacted modulation of their pain perception (given that the perception of each stimulus varied across participants). As a result, stimulus intensity was added as a control to TS-pain and CPM-pain.
Data Analysis
Structural equation models were conducted with LISREL 8.869. Separate models were used to predict TS/CPM outcomes versus pain tolerance to reduce the number of parameters and complexity of the models and because the models would not converge on a solution when included together. A few participants’ data were excluded from some analyses for failing to follow instructions or poor effort (ie, 1 was excluded from heat tolerance, 1 was excluded from ischemia tolerance). Additionally, some participants were excluded from pain modulation analyses for having baseline ratings at ceiling or floor; thus, impeding any ability to assess modulation. 2 participants were excluded from analyses of CPM-pain, because all ratings during baseline were at ceiling (NRS≥95; none were at floor NRS≤5). 20 participants (8 NHW, 12 NA) were excluded from analysis of TS-Pain because ratings of baseline stimulations were at ceiling (VAS≥95) or floor (VAS≤5), because the intensity of electric stimuli used during TS-pain were calibrated to NFR threshold, rather than pain perception. There were no group differences between individuals excluded for ceiling/floor effects and those used in the analysis on biological sex (χ2=0.009, p=.924), ethnicity (χ2=0.747, p=.387), BMI (t=0.043, p=.966), age (t=1.441, p=.151), physical activity (t=0.330, p=.742), sleep quality (t=.224, p=.823), perceived stress (t=0.247, p=.805), psychological distress (t=0.529, p=.597), mean arterial blood pressure (t=0.849, p=.397), or HRV (t=0.110, p=.913), but general health was slightly better in the group with omitted data (85.5 v. 79.1; t=2.045, p=.042). Cold pressor tolerance, ischemia tolerance, age, physical activity scores (IPAQ), HRV (RMSSD), and psychological distress (GSI) were log10 transformed to reduce positive skew. Outliers were identified using Wilcox’s MAD-median procedure and then winsorized to the next nearest non-outlier value151. All pain outcome variables, except electric tolerance, were winsorized, as were blood pressure (MAP), general health (SF-36), perceived stress (PSS), psychological distress (GSI), physical activity (IPAQ), and HRV (RMSSD). Independent-samples t-tests were conducted in SPSS to examine ethnic differences on study variables for descriptive purposes. Significance was set at p<.05 (2-tailed) for all analyses.
LISREL uses full information maximum likelihood (FIML), which means the models are run with all available data, even if there are missing values (the current state-of-the-art method for handling missingness79). Model fit was assessed from the root mean square error of approximation (RMSEA). As noted by Kline74, values ≤0.05 are considered “close-fit”, values between .05 and .08 are considered a “reasonable approximate fit,” and values ≥ .10 are considered “poor fit.” Moreover, the “Test of Close Fit” provided by LISREL was also reported. The Test of Close Fit assesses the null hypothesis (H0) that RMSEA < 0.05, thus if you reject H0 the model is not close fitting. The chi-square goodness of fit is also reported; however, this metric is highly sensitive to sample size and thus is significant in most large samples. For this reason, the chi-square is rarely used as a measure of fit, although it is almost always reported147. For both structural models, paths from NA ethnicity to cardiometabolic allostatic load, as well as paths from cardiometabolic allostatic load to pain outcomes were assessed. We have shown elsewhere that ethnic group differences in pain outcomes are not present in this study115, so the direct pathways between NA ethnicity and pain outcomes were not modeled. However, current statistical theories on mediation (indirect tests) do not assume a direct effect between the IV (ethnicity) and DV (eg, pain outcome) is necessary for there to be significant mediation that forms a potential causal pathway between the IV and DV102,103. Specifically, there may be an indirect/mediated relationship between NA ethnicity and pronociceptive mechanisms that is mediated by allostatic load (NA→allostatic load→pro-nociception), even when NA ethnicity is not directly related to pain outcomes to generate observable group differences in pain processing (ie, even if there is no “total effect”). If there is an indirect effect in the absence of a total effect, this implies that ethnic differences in pro-nociceptive processes exist only in the presence of cardiometabolic allostatic load. For this reason, the LISREL tests of indirect effects that assess for mediation are also reported.
Results
Final Sample
Of the 302 participants, 25% of participants had partial missing data (13% were missing TS/CPM procedures; 15% were missing pain tolerance procedures). Thus, analyses were conducted to determine whether there were differences in those with and without completed data on available background characteristics. There were no differences in biological sex (χ2=3.04, p=.081), ethnicity (χ2=1.78, p=.183), BMI (t=0.273, p=.785), age (t=1.056, p=.292), physical activity (t=1.244, p=.214), sleep quality (t=1.131, p=.259), perceived stress (t=0.954, p=.341), psychological distress (t=1.410, p=.160), general health (t=0.047, p=.962), mean arterial blood pressure (t=0.241, p=.810), or HRV (t=0.246, p=.806). LISREL’s FIML was used to address any missingness on variables for both SEM analyses. For the model predicting CPM/TS outcomes, 3.38% of values were missing. For the model predicting pain tolerance, 1.95% of values were missing.
Background Characteristics
In the full sample of 302 participants, 153 were NA (58% female) and 149 were NHW (50% female). Table 1 presents means and standard deviations (SD) for study variables, separated by ethnic status. As shown, NAs reported worse sleep quality, higher stress, more psychological symptoms, higher blood pressure and BMI, and reduced cold tolerance. There were no group differences on biological sex, χ2=2.20, p=.138. Means, SDs, and Pearson’s inter-correlations for study variables after they were corrected for non-normality are presented in Table 2.
Cardiometabolic Allostatic Load and Pain Modulation
The model without control variables (Table 3, Figure 2) demonstrated a close fit, RMSEA=0.0343 (90% CI: 0.00, 0.0669; test of close fit p=0.753), and a non-significant chi-square (χ2=26.22, df=20, p=0.16). As shown, NAs experienced greater cardiometabolic allostatic load. In turn, greater cardiometabolic allostatic load was associated with greater spinal facilitation (greater TS-NFR), and reduced inhibition of spinal nociception (less CPM-NFR). To visualize this latter effect, a scatterplot was generated that graphed latent scores on cardiometabolic allostatic load against the CPM-NFR change score (Figure 3). As can be seen, not only was CPM-NFR impaired, but higher cardiometabolic allostatic load was associated with a transition to NFR facilitation during CPM. Cardiometabolic allostatic load was not significantly associated with pain facilitation or pain inhibition in this model. Moreover, there were significant indirect effects. These indirect effects provide evidence that NA ethnicity is associated with pronociceptive outcomes as a result of higher cardiometabolic allostatic load in the NA group. Specifically, due to higher cardiometabolic allostatic load, NAs have increased spinal facilitation (TS-NFR; indirect effect=0.116, SE=0.037, p=0.040) and impaired inhibition of spinal nociception (CPM-NFR; indirect effect= 0.069, SE= 0.026, p=0.007), but not pain facilitation (TS-Pain; indirect effect= 1.463, SE= 0.820, p= 0.074) or pain inhibition (CPM-Pain; indirect effect= −0.499, SE= 0.434, p=0.251). The significant indirect effect for TS-NFR indicates that the TS-NFR magnitude is 0.116 d-units higher (greater spinal sensitization) in NAs than NHWs as a result of higher cardiometabolic allostatic load in the NA group. Similarly, the indirect effect for CPM-NFR indicates that NFR inhibition is 0.069 d-units less (impaired spinal inhibition) in NAs than NHWs as a result of higher cardiometabolic allostatic load in the NA group.
Table 3.
Unstandardized coefficients for the model predicting temporal summation and conditioned pain modulation outcomes (N=264)
| Model without Control Variables | Model with Control Variables | |||||||
|---|---|---|---|---|---|---|---|---|
| Measurement Model | Estimate | SE | Z-test | R2 | Estimate | SE | Z-test | R2 |
| Native American Status --> Race (NHW=0, NA=1) | 1.000 | — | — | — | 1.000 | — | — | — |
| Cardiometabolic Allostatic Load --> MAP | 1.000 | — | — | 0.578 | 1.000 | — | — | 0.434 |
| Cardiometabolic Allostatic Load --> BMI | 0.285 | 0.064 | 4.489 | 0.205 | 0.328 | 0.055 | 5.968 | 0.203 |
| Cardiometabolic Allostatic Load --> HRV | −0.013 | 0.004 | −3.661 | 0.106 | − 0.019 | 0.004 | −5.361 | 0.164 |
| Pain Facilitation --> TS-pain | 1.000 | — | — | — | 1.000 | — | — | — |
| Spinal Facilitation --> TS-NFR | 1.000 | — | — | — | 1.000 | — | — | — |
| Pain Inhibition --> CPM of Pain | 1.000 | — | — | — | 1.000 | — | — | — |
| Spinal Inhibition --> CPM of NFR | 1.000 | — | — | — | 1.000 | — | — | — |
| Error in Race | ||||||||
| Error in MAP | 33.890 | 9.265 | 3.658 | 45.473 | 5.664 | 8.028 | ||
| Error in BMI | 14.663 | 1.534 | 9.561 | 14.694 | 1.407 | 10.440 | ||
| Error in HRV | 0.067 | 0.006 | 10.465 | 0.063 | 0.006 | 10.505 | ||
| Error in TS-pain | — | — | — | — | — | — | ||
| Error in TS-NFR | — | — | — | — | — | — | ||
| Error in CPM of Pain | — | — | — | — | — | — | ||
| Error in CPM of NFR | — | — | — | — | — | — | ||
| Structural Model | Estimate | SE | Z-test | R2 | Estimate | SE | Z-test | R2 |
| Predictors of Allostatic Load | 0.117 | 0.653 | ||||||
| Race --> Cardiometabolic Allostatic Load | 4.673 | 1.030 | 4.534 | 3.862 | 0.798 | 4.839 | ||
| Age --> Cardiometabolic Allostatic Load | — | — | — | 25.701 | 2.831 | 9.078 | ||
| Sex --> Cardiometabolic Allostatic Load | — | — | — | − 3.025 | 0.821 | −3.686 | ||
| Physical Activity --> Cardiometabolic Allostatic Load | — | — | — | − 1.760 | 0.927 | −1.898 | ||
| Predictors of Pain Facilitation (TS-pain) | 0.023 | 0.106 | ||||||
| Cardiometabolic Allostatic Load --> Pain Facilitation | 0.313 | 0.167 | 1.871 | 0.062 | 0.310 | 0.201 | ||
| Age --> Pain Facilitation | — | — | — | 14.338 | 9.960 | 1.440 | ||
| Sex --> Pain Facilitation | — | — | — | 1.924 | 1.935 | 0.994 | ||
| Physical Activity --> Pain Facilitation | — | — | — | 5.196 | 2.072 | 2.507 | ||
| Sleep Quality --> Pain Facilitation | — | — | — | 2.282 | 1.359 | 1.679 | ||
| Perceived Stress --> Pain Facilitation | — | — | — | − 0.077 | 0.211 | −0.365 | ||
| Psych Distress --> Pain Facilitation | — | — | — | 21.865 | 14.938 | 1.464 | ||
| General Health --> Pain Facilitation | — | — | — | 0.052 | 0.069 | 0.754 | ||
| Stimulus Intensity--> Pain Facilitation | — | — | — | − 0.023 | 0.081 | −0.282 | ||
| Predictors of Spinal Facilitation (TS-NFR) | 0.109 | 0.158 | ||||||
| Cardiometabolic Allostatic Load --> Spinal Facilitation | 0.025 | 0.007 | 3.717 | 0.025 | 0.012 | 2.153 | ||
| Age --> Spinal Facilitation | — | — | — | 0.321 | 0.365 | 0.878 | ||
| Sex --> Spinal Facilitation | — | — | — | − 0.054 | 0.067 | −0.768 | ||
| Physical Activity --> Spinal Facilitation | — | — | — | 0.128 | 0.074 | 1.732 | ||
| Sleep Quality --> Spinal Facilitation | — | — | — | − 0.011 | 0.047 | −0.225 | ||
| Perceived Stress --> Spinal Facilitation | — | — | — | 0.003 | 0.007 | 0.454 | ||
| Psych Distress --> Spinal Facilitation | — | — | — | 0.263 | 0.520 | 0.507 | ||
| General Health --> Spinal Facilitation | — | — | — | − 0.000 | 0.002 | −0.123 | ||
| Predictors of Pain Inhibition (CPM-pain) | 0.009 | 0.161 | ||||||
| Cardiometabolic Allostatic Load --> Pain Inhibition | −0.107 | 0.091 | −1.170 | − 0.573 | 0.199 | −2.881 | ||
| Age --> Pain Inhibition | — | — | — | 21.112 | 6.126 | 3.447 | ||
| Sex --> Pain Inhibition | — | — | — | − 0.555 | 1.148 | −0.484 | ||
| Physical Activity --> Pain Inhibition | — | — | — | 0.397 | 1.212 | 0.328 | ||
| Sleep Quality --> Pain Inhibition | — | — | — | 1.273 | 0.732 | 1.738 | ||
| Perceived Stress --> Pain Inhibition | — | — | — | 0.033 | 0.117 | 0.281 | ||
| Psych Distress --> Pain Inhibition | — | — | — | 4.479 | 8.235 | 0.544 | ||
| General Health --> Pain Inhibition | — | — | — | 0.040 | 0.038 | 1.050 | ||
| Stimulus Intensity --> Pain Inhibition | — | — | — | 0.118 | 0.0389 | 3.048 | ||
| Predictors of Spinal Inhibition (CPM-NFR) | 0.066 | 0.100 | ||||||
| Cardiometabolic Allostatic Load --> Spinal Inhibition | 0.015 | 0.005 | 3.004 | 0.019 | 0.009 | 2.025 | ||
| Age --> Spinal Inhibition | — | — | — | − 0.095 | 0.293 | −0.322 | ||
| Sex --> Spinal Inhibition | — | — | — | − 0.051 | 0.056 | −0.914 | ||
| Physical Activity --> Spinal Inhibition | — | — | — | 0.092 | 0.060 | 1.548 | ||
| Sleep Quality --> Spinal Inhibition | — | — | — | − 0.000 | 0.037 | −0.003 | ||
| Perceived Stress --> Spinal Inhibition | — | — | — | 0.003 | 0.006 | 0.484 | ||
| Psych Distress --> Spinal Inhibition | — | — | — | 0.341 | 0.421 | 0.812 | ||
| General Health --> Spinal Inhibition | — | — | — | 0.001 | 0.002 | 0.752 | ||
| Residuals | ||||||||
| Residual for Cardiometabolic Allostatic Load | 41.049 | 10.133 | 4.051 | 12.106 | 4.128 | 2.933 | ||
| Residual for Pain Facilitation | 193.204 | 17.844 | 10.827 | 176.848 | 16.178 | 10.932 | ||
| Residual for Spinal Facilitation | 0.236 | 0.022 | 10.545 | 0.223 | 0.021 | 10.790 | ||
| Residual for Pain Inhibition | 61.855 | 5.612 | 11.023 | 52.333 | 5.259 | 9.950 | ||
| Residual for Spinal Inhibition | 0.144 | 0.014 | 10.603 | 0.139 | 0.013 | 10.564 | ||
Note: z-tests ≥ 1.96 or ≤ −1.96 are statistically significant at p<.05. Bolded estimates are statistically significant. The R-squared values that are reported in the structural model that includes control variables is the total variance explained in the latent variable. NHW=non-Hispanic White; NA=Native American; MAP=mean arterial blood pressure; BMI=body mass index; HRV=heart rate variability; TS=temporal summation; NFR=nociceptive flexion reflex; CPM=conditioned pain modulation.
Figure 2.
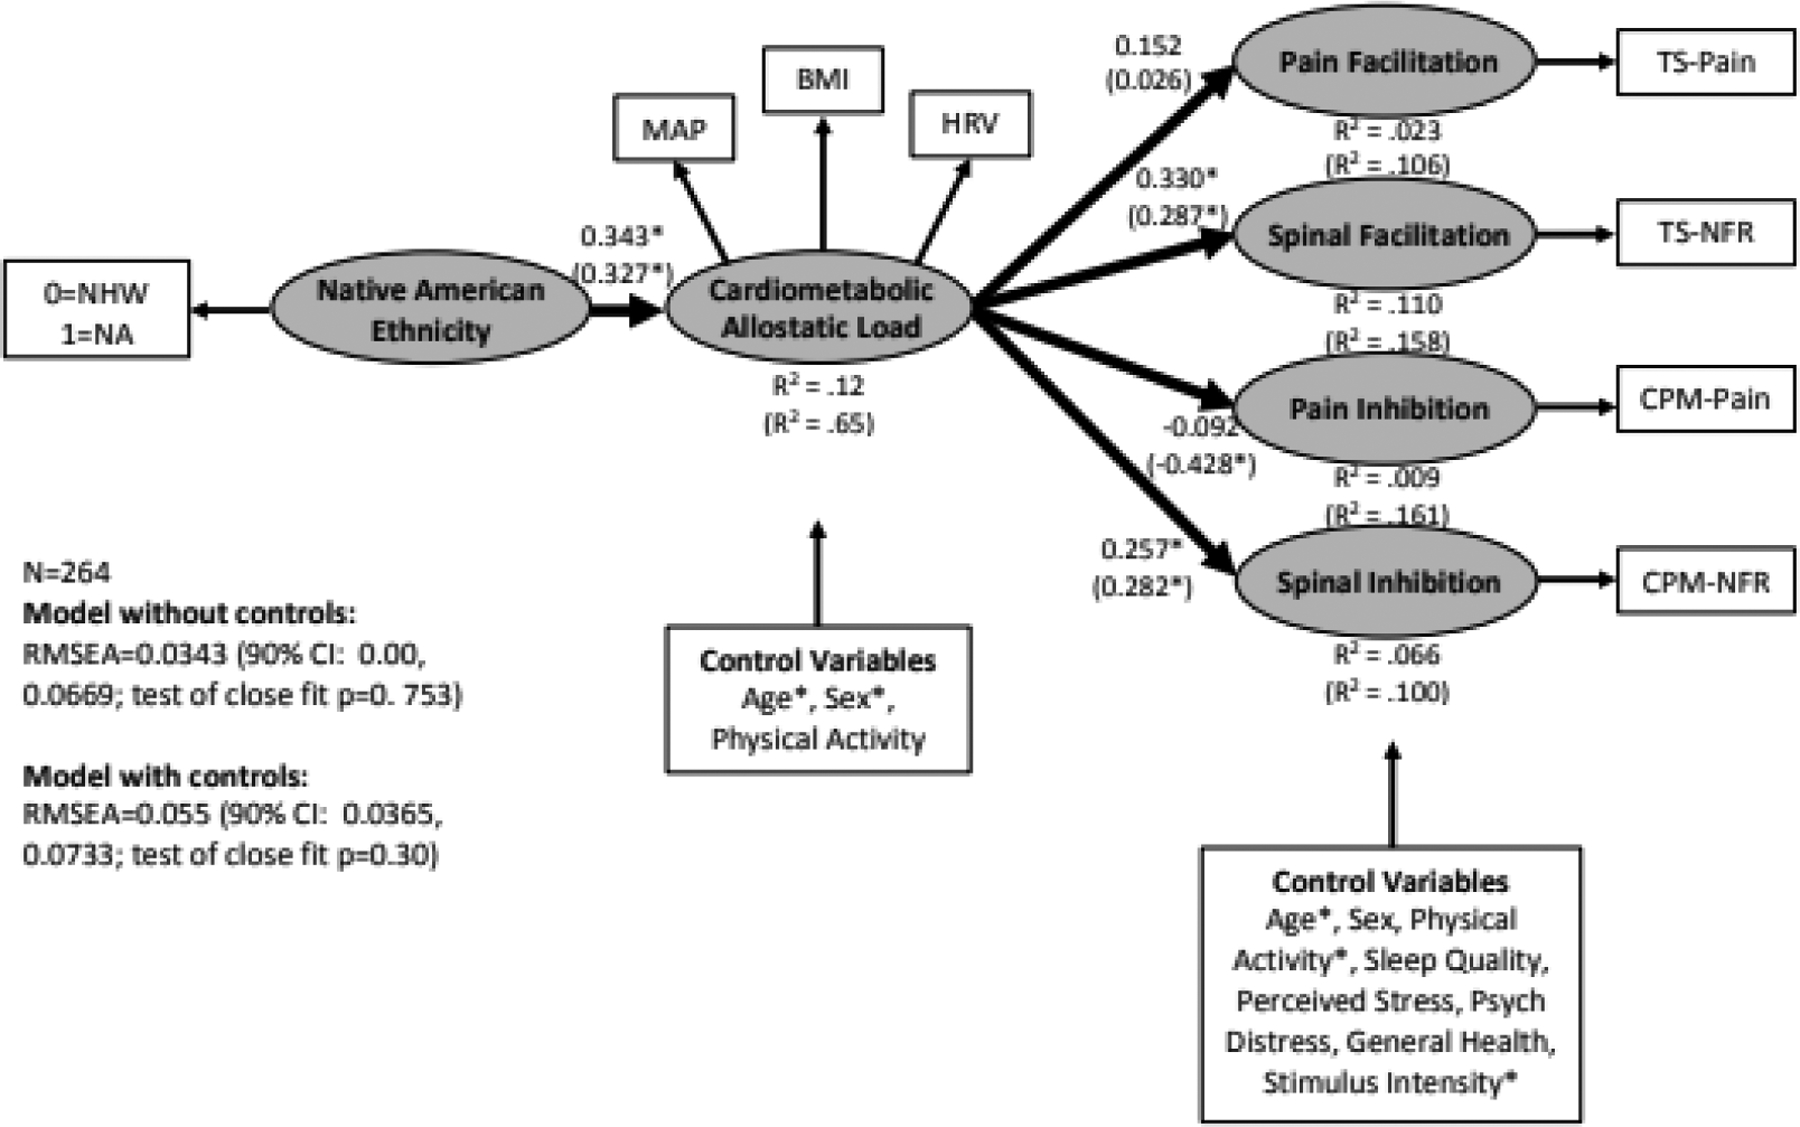
Structural equation model linking Native American ethnicity (coded 0=non-Hispanic White [NHW], 1=Native American [NA]) to cardiometabolic allostatic load and markers of pain modulation. Standardized coefficients and R-squared values without parentheses are from the model without control variables, whereas those in parentheses are from the model with control variables. MAP=mean arterial blood pressure, BMI=body mass index, HRV=heart rate variability, TS-pain=temporal summation of pain, TS-NFR=temporal summation of the nociceptive flexion reflex, CPM-pain=conditioned pain modulation of pain ratings, CPM-NFR=conditioned pain modulation of the nociceptive flexion reflex, RMSEA=root mean square error of approximation. *p<.05.
Figure 3.
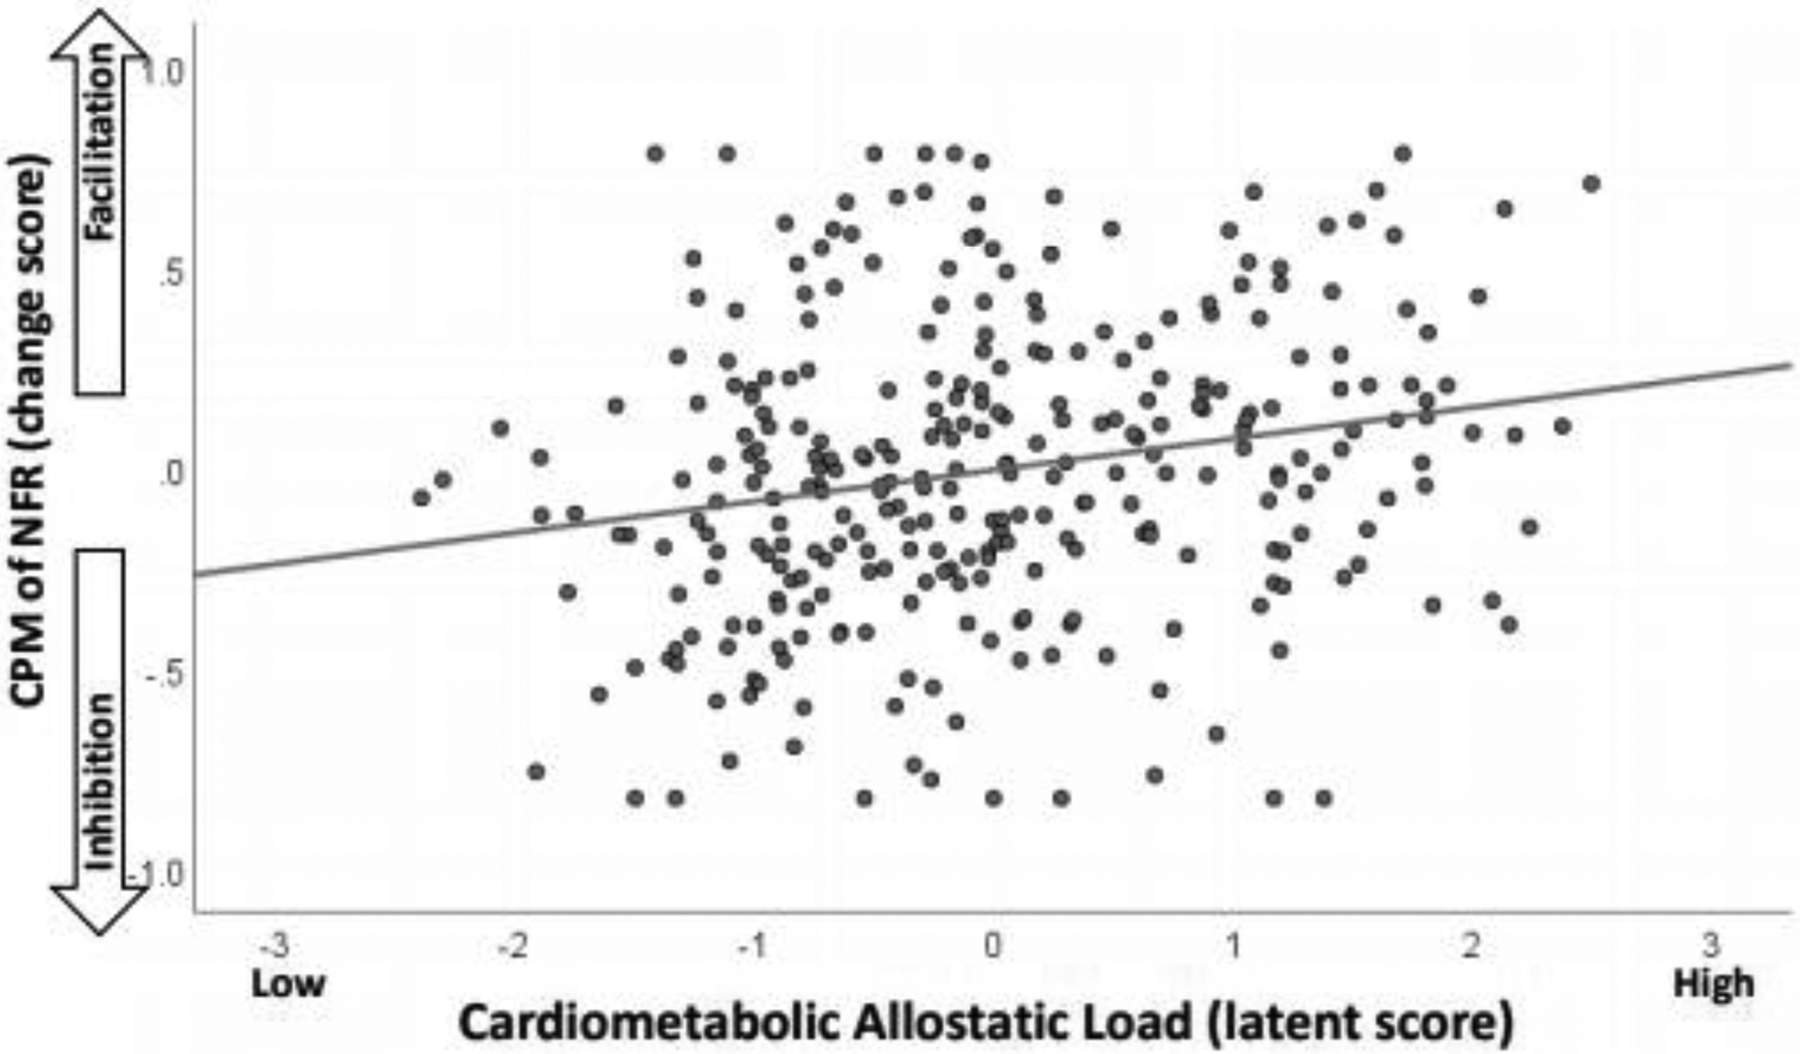
Scatterplot depicting the relationship between the cardiometabolic allostatic load latent variable (standardized into z-scores) and conditioned pain modulation of the nociceptive flexion reflex (CPM-NFR). Higher cardiometabolic allostatic load was associated with a transition from spinal inhibition (negative CPM-NFR scores) to spinal facilitation (positive CPM-NFR scores).
The model with control variables (Table 3, results in parentheses of Figure 2) had a slightly worse fit than the model without the controls, but the RMSEA=0.055 (90% CI: 0.0365, 0.0733; test of close fit p=0.30) still suggested a close fit to these data, although there was a significant chi-square (χ2=90.31, df=50, p=0.0004). Even after controlling for age, sex, and physical activity, NAs still experienced greater cardiometabolic allostatic load. Moreover, after controlling for age, sex, physical activity, sleep quality, stress, distress, general health, and stimulus intensity, cardiometabolic allostatic load was still associated with greater spinal facilitation (TS-NFR) and less inhibition of spinal nociception (CPM-NFR). In this model, cardiometabolic allostatic load was also significantly associated with greater pain inhibition (CPM-Pain). This is likely due to controlling for age, because age was significantly related to CPM-pain. Similar to the model without controls, this model also found that there were significant indirect effects indicating that, in the presence of cardiometabolic allostatic load, NAs have increased spinal facilitation (TS-NFR; indirect effect= 0.096, SE=0.045, p=.032) and impaired inhibition of spinal nociception (CPM-NFR; indirect effect= 0.073, SE= 0.036, p=.044), but not pain facilitation (TS-PAIN; indirect effect= 0.240, SE= 1.196, p=.840). The significant indirect effect for TS-NFR indicates that the TS-NFR magnitude is 0.096 d-units higher (greater spinal sensitization) in NAs than NHWs as a result of higher cardiometabolic allostatic load in the NA group. Similarly, the indirect effect for CPM-NFR indicates that NFR inhibition is 0.073 d-units less (impaired spinal inhibition) in NAs than NHWs. Moreover, in this model there was also a significant indirect effect indicating that, in the presence of cardiometabolic allostatic load, NAs have improved pain inhibition when age was controlled (CPM-Pain; indirect effect= −2.212, SE= 0.774, p= .004). This indirect effect indicates that pain was inhibited by an additional 2.212 VAS units (improved pain inhibition) in NAs than NHWs as a result of higher cardiometabolic allostatic load in the NA group.
In terms of the effects of the control variables (Table 3), being male and being older were associated with greater cardiometabolic allostatic load, higher levels of physical activity were associated with greater pain facilitation (TS-pain) and being older was associated with less pain inhibition (CPM-Pain). Higher stimulus intensity was associated with reduced pain inhibition (CPM-Pain).
Cardiometabolic Allostatic Load and Pain Tolerance
Results for these models are presented in Table 4 and Figure 4. Initial attempts to model these tolerance data resulted in a negative variance (Heywood case) until the errors for blood pressure and heat tolerance were allowed to covary (Figure 4). Thus, both models described below included this modification.
Table 4.
Unstandardized coefficients for the model predicting pain tolerance (N=256)
| Model without Control Variables | Model with Control Variables | |||||||
|---|---|---|---|---|---|---|---|---|
| Measurement Model | Estimate | SE | Z-test | R2 | Estimate | SE | Z-test | R2 |
| Native American Status --> Race (NHW=0, NA=1) | 1.000 | — | — | — | 1.000 | — | — | — |
| Cardiometabolic Allostatic Load --> MAP | 1.000 | — | — | 0.849 | 1.000 | — | — | 0.458 |
| Cardiometabolic Allostatic Load --> BMI | 0.189 | 0.069 | 2.723 | 0.140 | 0.331 | 0.055 | 6.062 | 0.229 |
| Cardiometabolic Allostatic Load --> HRV | −0.009 | 0.004 | −2.482 | 0.080 | −0.017 | 0.003 | −4.745 | 0.144 |
| Pain Tolerance --> Heat Tolerance | 1.000 | — | — | 0.437 | 1.000 | — | — | 0.500 |
| Pain Tolerance --> Cold Tolerance | 0.198 | 0.028 | 7.194 | 0.407 | 0.181 | 0.024 | 7.452 | 0.387 |
| Pain Tolerance --> Ischemia Tolerance | 0.220 | 0.031 | 7.045 | 0.376 | 0.207 | 0.028 | 7.397 | 0.377 |
| Pain Tolerance --> Electric Tolerance | 6.777 | 0.950 | 7.137 | 0.394 | 5.960 | 0.828 | 7.195 | 0.346 |
| Error in Race | ||||||||
| Error in MAP | 12.865 | 24.146 | 0.533 | 45.357 | 6.541 | 6.935 | ||
| Error in BMI | 15.772 | 1.652 | 9.548 | 14.120 | 1.409 | 10.022 | ||
| Error in HRV | 0.067 | 0.007 | 10.130 | 0.063 | 0.006 | 10.044 | ||
| Error in Heat Tolerance | 1.886 | 0.240 | 7.848 | 1.667 | 0.233 | 7.164 | ||
| Error in Cold Tolerance | 0.083 | 0.010 | 8.297 | 0.086 | 0.010 | 8.710 | ||
| Error in Ischemia Tolerance | 0.118 | 0.014 | 8.684 | 0.118 | 0.013 | 8.828 | ||
| Error in Electric Tolerance | 103.686 | 12.239 | 8.472 | 111.902 | 12.244 | 9.139 | ||
| Structural Model | Estimate | SE | Z-test | R2 | Estimate | SE | Z-test | R2 |
| Prediction of Cardiometabolic Allostatic Load | 0.094 | 0.629 | ||||||
| Race --> Cardiometabolic Allostatic Load | 5.199 | 1.086 | 4.786 | 4.212 | 0.858 | 4.911 | ||
| Age --> Cardiometabolic Allostatic Load | — | — | — | 25.133 | 2.823 | 8.903 | ||
| Sex --> Cardiometabolic Allostatic Load | — | — | — | −3.141 | 0.848 | −3.702 | ||
| Physical Activity --> Cardiometabolic Allostatic Load | — | — | — | −1.829 | 0.975 | −1.877 | ||
| Prediction of Pain Tolerance | 0.000 | 0.125 | ||||||
| Cardiometabolic Allostatic Load --> Pain Tolerance | 0.003 | 0.012 | 0.255 | −0.030 | 0.032 | −0.930 | ||
| Age --> Pain Tolerance | — | — | — | 0.491 | 1.017 | 0.482 | ||
| Sex --> Pain Tolerance | — | — | — | −0.843 | 0.211 | −3.993 | ||
| Physical Activity --> Pain Tolerance | — | — | — | 0.111 | 0.221 | 0.504 | ||
| Sleep Quality --> Pain Tolerance | — | — | — | 0.104 | 0.140 | 0.741 | ||
| Perceived Stress --> Pain Tolerance | — | — | — | −0.028 | 0.022 | −1.231 | ||
| Psych Distress --> Pain Tolerance | — | — | — | 2.420 | 1.642 | 1.473 | ||
| General Health --> Pain Tolerance | — | — | — | 0.004 | 0.009 | 0.495 | ||
| Residuals | ||||||||
| Residual for Cardiometabolic Allostatic Load | 65.301 | 24.807 | 2.632 | 14.205 | 5.226 | 2.718 | ||
| Residual for Pain Tolerance | 1.466 | 0.297 | 4.929 | 1.461 | 0.282 | 5.188 | ||
Note: z-tests ≥ 1.96 or ≤ −1.96 are statistically significant at p<.05. Bolded estimates are statistically significant. The R-squared values that are reported in the structural model that includes control variables is the total variance explained in the latent variable. NHW=non-Hispanic White; NA=Native American; MAP=mean arterial blood pressure; BMI=body mass index; HRV=heart rate variability; TS=temporal summation; NFR=nociceptive flexion reflex; CPM=conditioned pain modulation.
Figure 4.
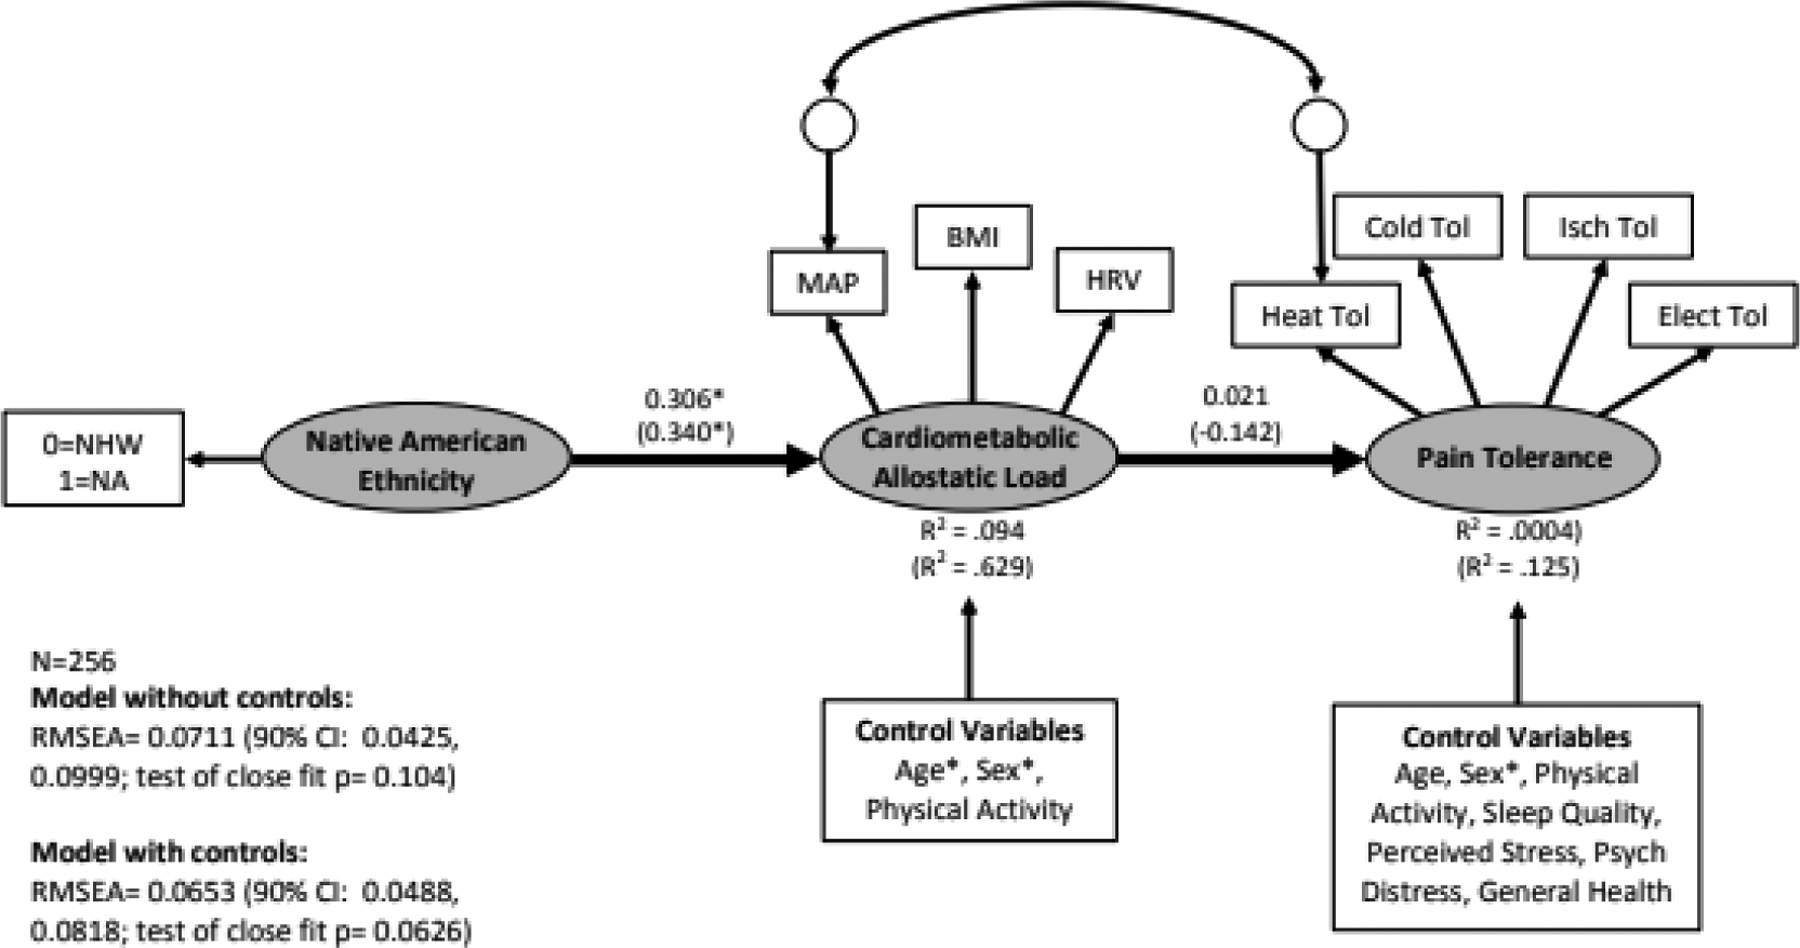
Structural equation model linking Native American ethnicity (coded 0=non-Hispanic White [NHW], 1=Native American [NA]) to cardiometabolic allostatic load and pain tolerance. Standardized coefficients and R-squared values depicted without parentheses are from the model that did not include control variables. Standardized coefficients and R-squared values without parentheses are from the model without control variables, whereas those in parentheses are from the model with control variables. MAP=mean arterial blood pressure, BMI=body mass index, HRV=heart rate variability, Heat Tol=heat tolerance, Cold Tol=cold pressor tolerance, Isch Tol=ischemic tourniquet test tolerance, Elect Tol=electric tolerance, RMSEA=root mean square error of approximation. *p<.05.
The model without control variables had a RMSEA= 0.0711 (90% CI: 0.0425, 0.0999), suggesting a reasonable fit, but the test of close fit was non-significant (p=0.10) suggesting a close fit. The chi-square test was significant (χ2=41.30, df=18, p=0.0014). As shown in Fig 4, NAs experienced greater cardiometabolic allostatic load, but cardiometabolic allostatic load was not associated with pain tolerance. Not surprisingly, there was not a significant indirect effect linking NAs and pain tolerance in the presence of cardiometabolic allostatic load (indirect effect= 0.016, SE= 0.062, p=.799).
Results from the model with the control variables were similar. That model had a RMSEA= 0.0653 (90% CI: 0.0488, 0.0818) suggesting a reasonable fit, but the test of close fit was non-significant (p=0.063) suggesting close fit. The chi-square test was significant (χ2=119.28, df=57, p<.001). As shown by the coefficients within parentheses of Fig 4, being NA was associated with greater cardiometabolic allostatic load, but cardiometabolic allostatic load was still not associated with pain tolerance. Moreover, there was not a significant indirect effect linking NAs and pain tolerance in the presence of cardiometabolic allostatic load (indirect effect= −0.125, SE= 0.133, p=.3498).
In terms of the effects on the control variables (Table 4), being male and being older was associated with greater cardiometabolic allostatic load, whereas being female was associated with lower pain tolerance.
Discussion
This study found that NAs experienced greater cardiometabolic allostatic load24–26,141 that was in turn associated with enhanced TS-NFR and reduced CPM-NFR, but not CPM-pain, TS-pain, or pain tolerance. These results were generally replicated even after controlling for age, sex, physical activity, sleep quality, stress, distress, general health perceptions, and stimulus intensity, with one exception. Cardiometabolic allostatic load was associated with improved CPM-pain when controlling for age. Implications are discussed below.
Does Cardiometabolic Allostatic Load Confer Pain Risk in Native Americans by Promoting Latent Sensitization?
Interestingly, we found that cardiometabolic allostatic load was not associated with TS-pain or CPM-pain; rather, it was only associated with enhanced TS-NFR and impaired CPM-NFR. The NFR is a spinal nociceptive reflex124 whose arc does not require supraspinal input120, even though NFR can be modulated by descending controls from supraspinal centers117,152. Thus, it is used as an indirect marker of spinal nociception124,132. Given this, cardiometabolic allostatic load appears to amplify spinal nociception (TS-NFR) perhaps by impairing descending inhibition of spinal nociception (CPM-NFR).
Typically, it is assumed that facilitation of spinal nociception will correspond to a similar pain facilitation; however, evidence suggests that dissociable modulatory circuits can be triggered during CPM. Piche et al99 employed a nearly identical CPM paradigm as ours and found that NFR modulation was associated with a cerebrospinal circuit (prefrontal cortex, cingulate cortices, parahippocampal gyrus, supplementary motor area, paracentral lobule, primary somatosensory cortex, thalamus, periaqueductal gray, pons, rostral ventromedial medulla), whereas electric pain modulation was associated with a supraspinal circuit (orbitofrontal cortex, cingulate cortices, medial prefrontal cortex, anterior insula, parahippocampal gyrus, and amygdala). Thus, these separate circuits provide a means by which NFR and pain could diverge. Specifically, cardiometabolic allostatic load may facilitate spinal nociception by impairing cerebrospinal circuitry, but if the supraspinal circuit is not impaired (lack of association between allostatic load and CPM-pain), or even augmented (allostatic load associated with improved CPM-pain in the model with controls) then the supraspinal inhibitory circuit may offset the amplified ascending signal (Fig 5). This could explain why cardiometabolic allostatic load (in healthy, pain free participants) is not associated with enhanced TS-pain or reduced pain tolerance. The present findings are consistent with other OK-SNAP findings indicating that exposure to major life stressors (eg, trauma) produce sensitization of spinal nociception without concomitant pain sensitization61,71,72,135.
Figure 5.
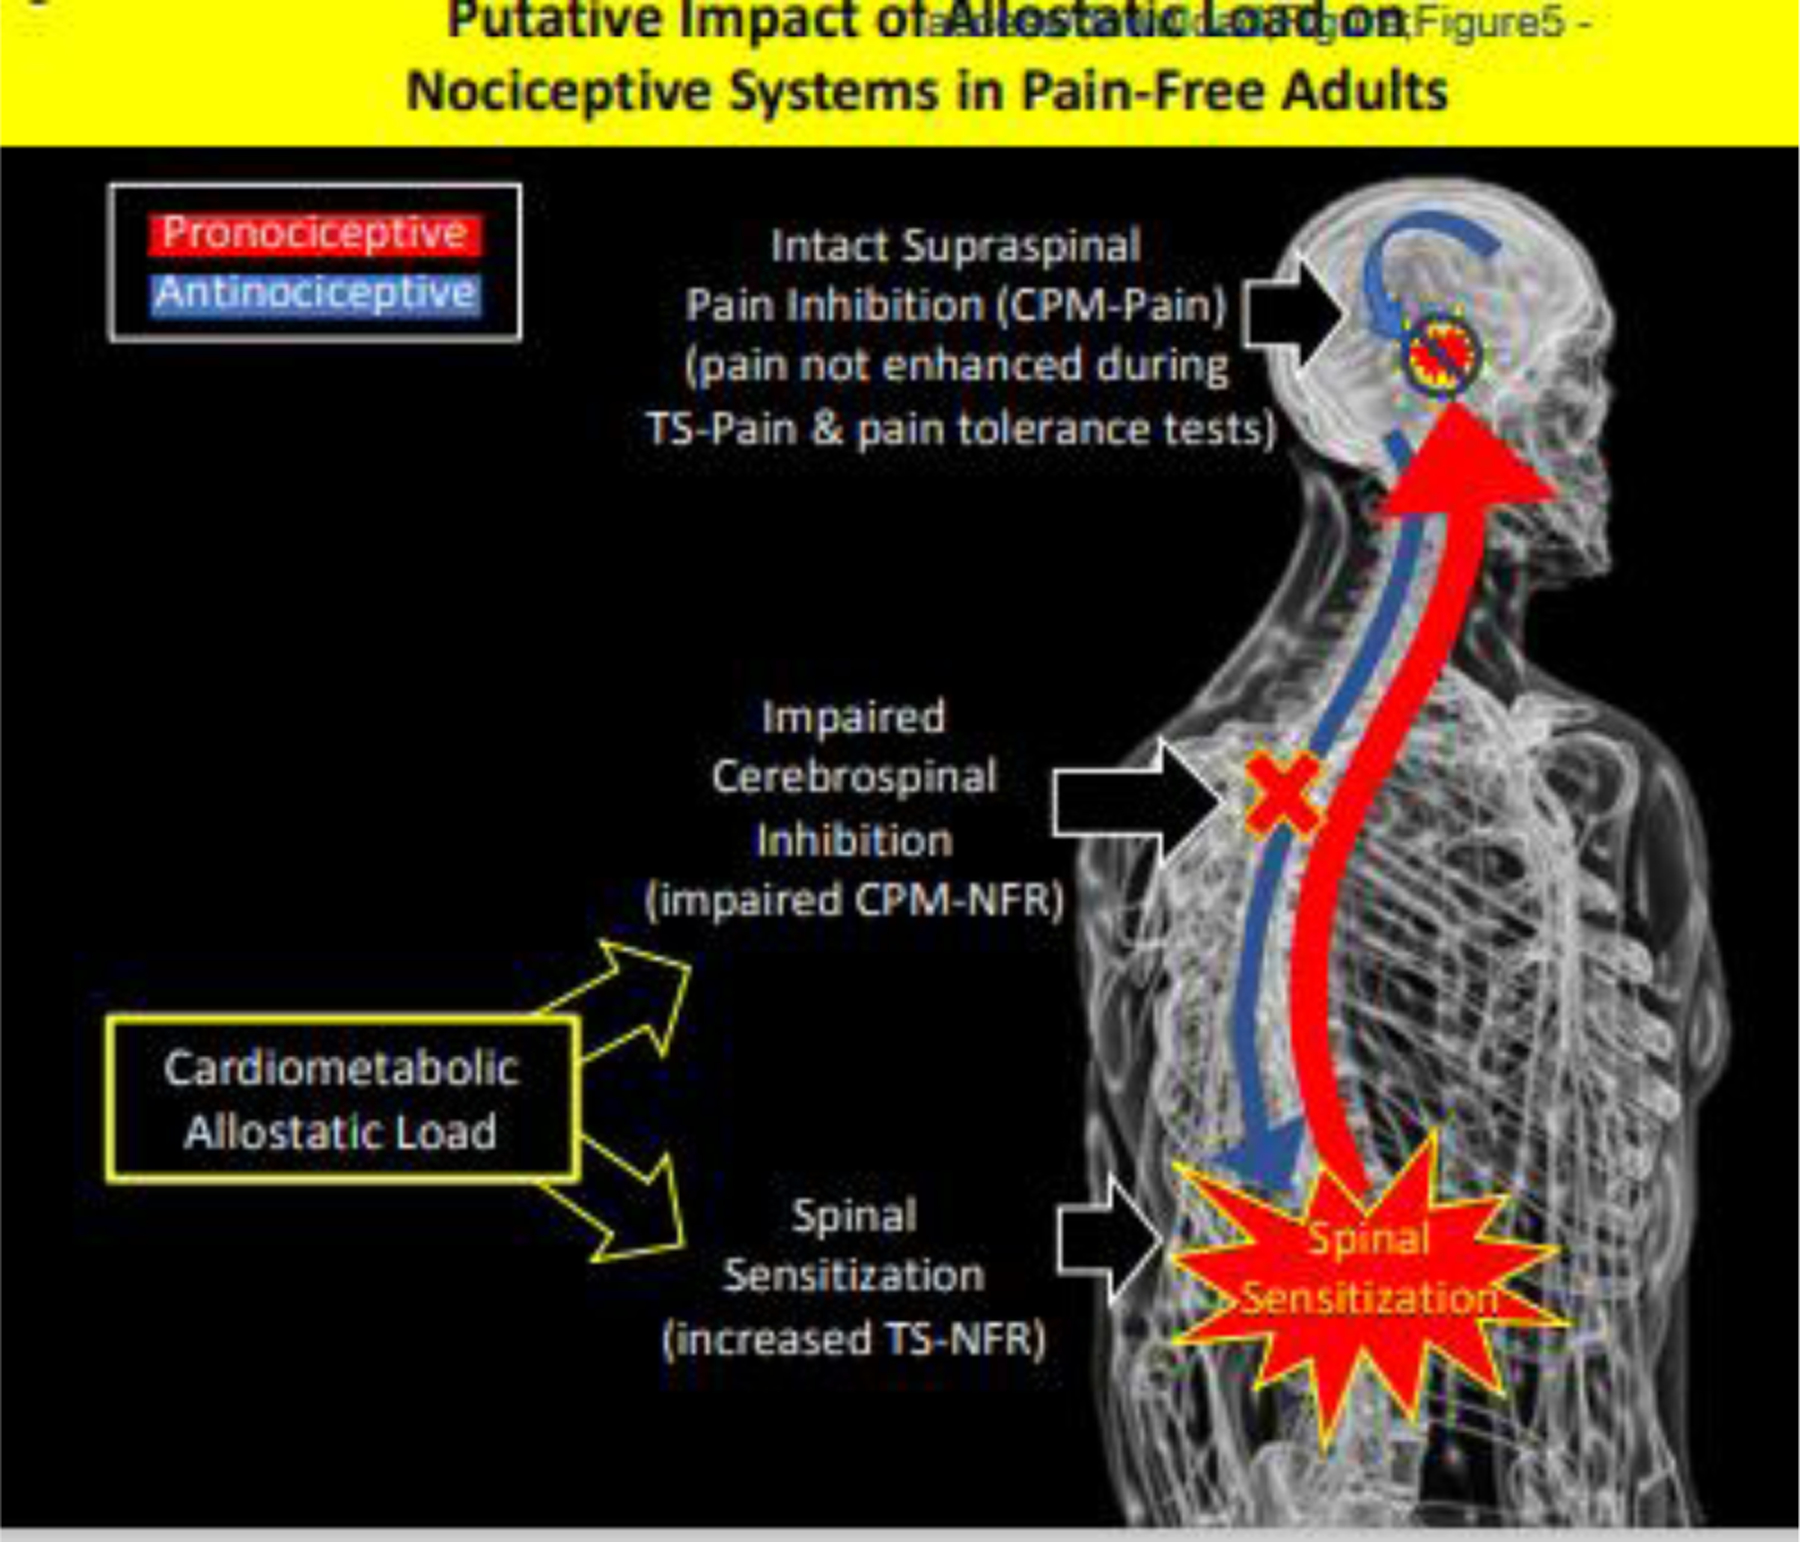
Putative mechanisms linking cardiometabolic allostatic load to pronociceptive processes in healthy, pain-free individuals. Cardiometabolic allostatic load was associated with impaired cerebrospinal inhibitory mechanisms and sensitization of spinal nociception. However, intact supraspinal inhibitory mechanisms may have inhibited the amplified ascending signal at supraspinal levels thus leading to a lack of pain facilitation or hyperalgesia. This could cause the dissociation between spinal and perceptual measures of pain in the current study.
Sensitization of spinal nociception without pain sensitization could reflect a phenomenon referred to as latent sensitization in rodents (Fig 6)27,76,136. In rodents, latent sensitization is triggered by a physical insult or environmental stressor and produces sensitization of spinal nociception and (initially) pain hyper-responsivity136. However, the pain hyper-responsivity is short-lived and remits after a few days. Interestingly, the spinal sensitization persists for months following the triggering event but is masked by compensatory inhibitory mechanisms30, thus causing it to be “latent” because it is no longer associated with pain hyper-responsivity. Nonetheless, it persists as a vulnerability for chronic pain that can be triggered by future events (eg, injury, stressors) that impair pain inhibitory mechanisms and unmask the spinal sensitization to cause hyperalgesia and persistent pain.76
Figure 6.
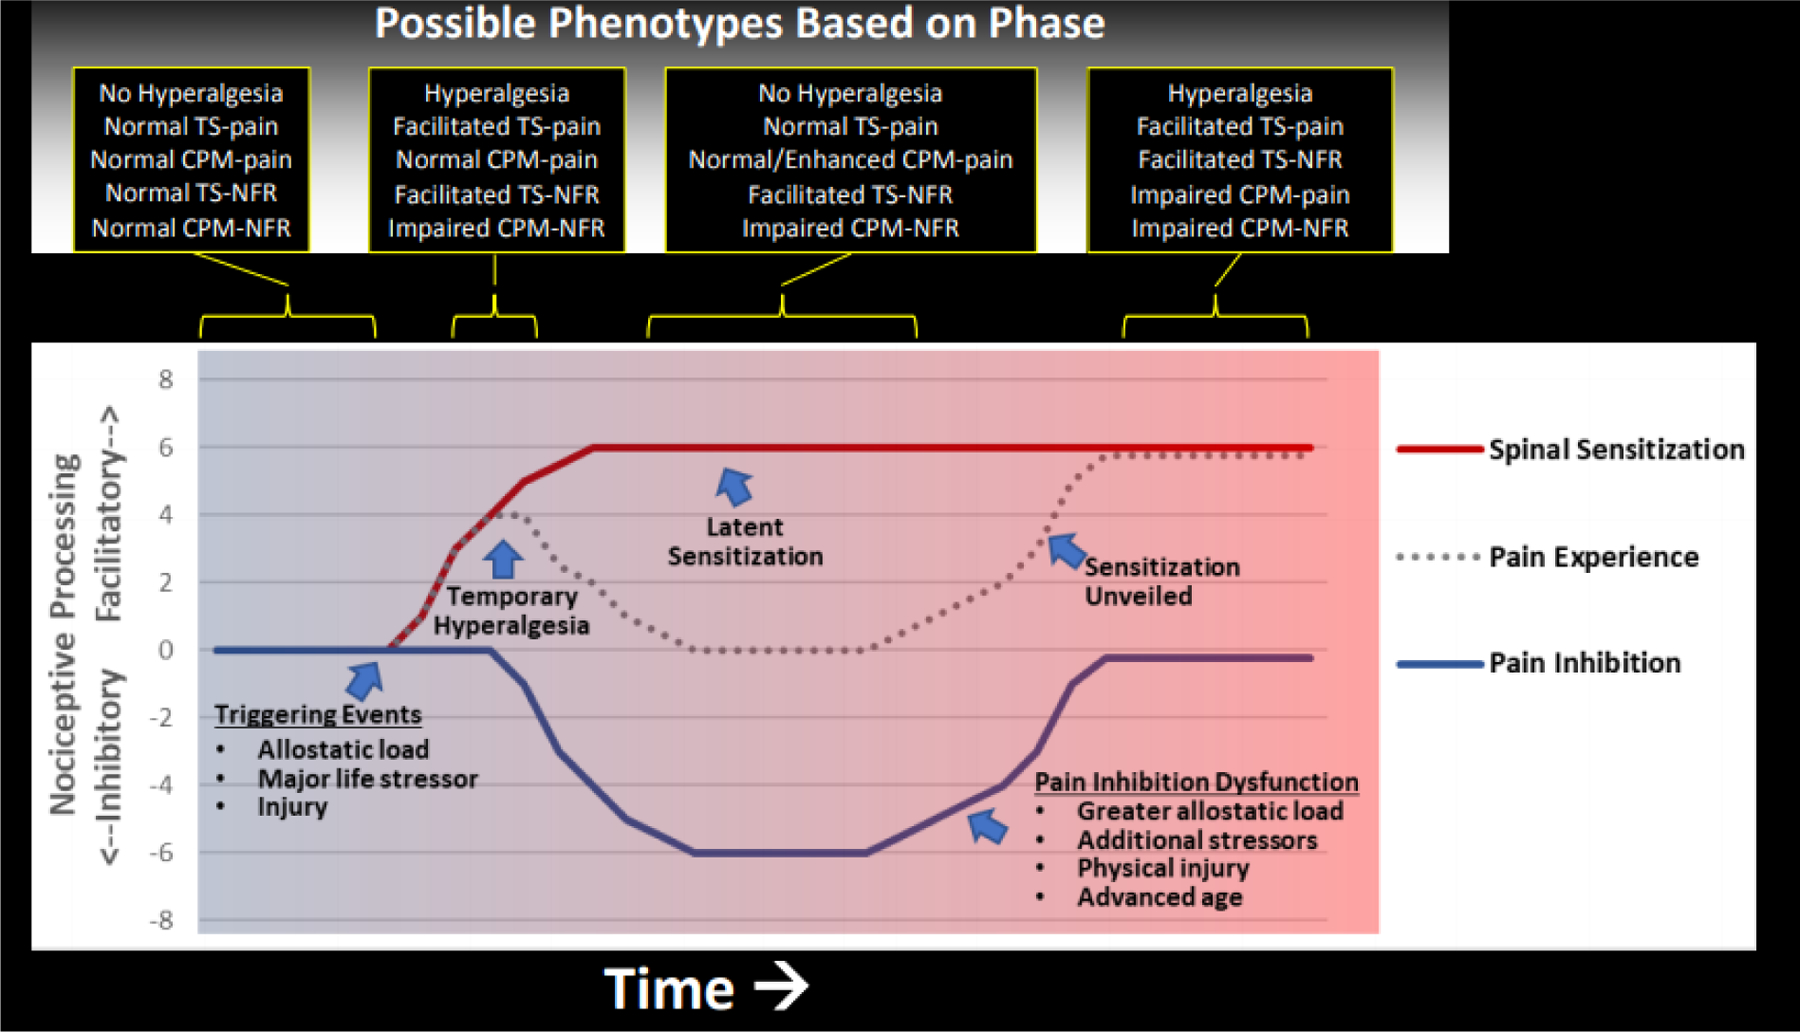
Hypothetical model linking allostatic load to latent sensitization and pain risk in Native Americans. In rodent models136, a triggering event (eg, environmental stressor, physical insult) can cause spinal sensitization and hyperalgesic behavior, but after a few days endogenous inhibitory mechanisms are engaged that eliminate the hyperalgesia. Nonetheless, the spinal sensitization persists and becomes “latent” because it no longer produces pain hypersensitivity. This latent sensitization can persist for long periods of time and serve as a vulnerability for future chronic pain following events (eg, environmental stressors) that disrupt endogenous inhibitory mechanisms that keep the spinal sensitization in check. Findings from OK-SNAP suggest that allostatic load and/or major life stressors might trigger spinal sensitization (eg, enhanced TS-NFR, impaired CPM-NFR) that is offset by compensatory pain inhibitory mechanism (eg, CPM-pain), thus eliminating hyperalgesia (ie, no lowered pain tolerance). However, this pain phenotype could represent a unique risk factor for chronic pain risk if future events (eg, greater allostatic load, additional stressors, injury, advanced age) cause compensatory inhibitory mechanisms to fail and unveil the spinal sensitization to produce enhanced pain. Given that rodent studies suggest the initial hyperalgesia is short-lived relative to spinal sensitization136, hyperalgesia would not be observed unless pain testing occurred immediately following a triggering event. Moreover, recruiting only pain-free individuals would further reduce the chance that hyperalgesia would be detected in participants in the current study.
Stressors and the resulting allostatic load could trigger spinal sensitization and compensatory endogenous pain inhibition that keeps the sensitization from producing hyperalgesia. However, over time, latent sensitization could itself promote wear-and-tear of pain inhibitory mechanisms (e.g., the supraspinal inhibitory circuit) which could ultimately lead to chronic pain. Several factors could promote this, such as advancing age (older age = impaired CPM-pain and enhanced TS-pain59), physical trauma (increasing nociceptive input and central sensitization75), additional adversity (stress unmasks hyperalgesia in rodent models of latent sensitization)27,76, or chronic illness (eg, diabetes impairs pain inhibition55,56). The present study found that older age was associated with impaired CPM-pain, so when age was controlled, cardiometabolic allostatic load was associated with improved CPM-pain. This might represent augmented supraspinal pain inhibition processes that counteract spinal sensitization to make it latent.
An additional finding from OK-SNAP that supports this interpretation comes from preliminary analyses of our follow-up data. We assess participants every 6-months to determine if they develop pain lasting ≥3-months that does not remit at subsequent follow-ups. 73% of participants have responded, and 16% of those have developed persistent pain122. Remarkably, NAs are transitioning at ~3-fold the rate of NHWs122, and impaired CPM-NFR is associated with this transition65. So, when taken together with other OK-SNAP results, adversity and allostatic load may increase pain risk in NAs.
Allostatic Load as a Potential Mediator of Sociocultural Determinants of Pain Risk in Native Americans
NAs have experienced significant historical adversity18,43,98,134,141, including forced relocation and assimilation, forced separation of children from families to attend boarding schools, political oppression, and genocide. Such experiences can significantly impair stress regulation mechanisms (eg, HPA axis) and promote allostatic load14,87. Via epigenetics, these effects can even be transmitted across generations18,35,51,154. Moreover, many NAs continue to experience higher levels of adversity than the general U.S. population. For example, NAs experience more adverse childhood experiences (ACEs) and adulthood trauma10,11,73,78,80,100,118,119, food insecurity96, and discrimination48,57. NAs are also more likely to live in poverty145. Together, these historical and ongoing stressors likely contribute to a “3-hit process of vulnerability”33 in which genetic/epigenetic predispositions (hit-1), early life adversity (hit-2), and later life environment (hit-3) accumulate to increase allostatic load18,43,98,134,141. The contribution of these factors to pain risk in NAs should be explored in future studies.
Implications: Potential Interventions for Reducing Pain Risk in Native Americans
Given the high levels of adversity, stressors, and allostatic load for NAs, there are multiple levels at which to intervene43. At the societal level, changes in policies and funding are needed to improve environmental and socioeconomic factors43,141. At the community level, work is being done to maintain NA cultures and languages, and improve access to resources, such as healthy food environments, medical care, and education13,66. At the individual level, efforts are being made for early detection of allostatic load conditions63,149,159. Moreover, culturally-responsive (eg, group interpersonal psychotherapy) and empirically-validated (eg, prolonged exposure) treatments are available for addressing the negative psychological sequalae of trauma and adversity16,92,101,106,107.
However, it is important to note that reducing stress may not be enough to eliminate pain disparities related to allostatic load. Our results suggest allostatic load is pronociceptive even after controlling for psychological stress/distress. Therefore, interventions may need to directly target spinal sensitization. To this end, there are a few emerging therapies that may help. For example, NFR threshold is increased (indicative of greater spinal inhibition) by brief relaxation41,42 and biofeedback112, whereas secondary hyperalgesia (marker of spinal sensitization) is reduced by written disclosure about stressful experiences156 and treatments that reduce pain catastrophizing123. As Tiedt and Brown note141, such interventions for NAs may benefit from taking into account cultural beliefs, using tactics that are respectful and holistic, and emphasizing balance and connectedness. Working collaboratively with NA communities to develop them is important52.
Strengths and Limitations
To our knowledge, this is the first study to assess the relationship between allostatic load and pain processes in NAs. Moreover, both psychophysical and neurophysiological outcomes were used to assess pain perception and spinal nociception, and structural equation modeling was used to analyze these relationships. Nonetheless, a few limitations should be noted.
First, we only assessed 3 markers of allostatic load, which left the neuroendocrine and immune systems unmeasured. Immunity/inflammation may be particularly relevant to chronic pain risk133 and a combined score assessing all systems may lead to a different result than we obtained. Additionally, we only measured HRV between pain tasks. Measurement at another time point (eg, rest day) or as a change from resting baseline may have produced different results. Second, excluding persons with chronic health conditions, current substance use disorder, and psychiatric medication use could limit the generalizability and/or obscure ethnic differences due to the differential prevalence rates in NAs and NHWs. Moreover, only recruiting healthy, pain-free individuals likely restricted the range of allostatic load markers. However, this choice was necessary so that we could try to identify markers of pain risk before its onset. Future studies could recruit participants with subclinical disease states associated with high allostatic load (eg, prediabetes) to help overcome this limitation, as well as test these relationships in less healthy populations. Third, our sample was large for this type of study, and is the largest study of NA pain mechanisms, but was too small to test more complex models or to ensure the stability of the models with control variables. Nonetheless, the results with and without controls were similar. Fourth, there were a few participants that did not complete all study tasks. Although this could limit generalizability, analyses of completers vs. non-completers have found few notable differences115. And finally, NAs in OK-SNAP were primarily from northeastern Oklahoma; there may be important differences associated with NAs from other regions that could alter allostatic load and/or pain processing (eg, diet, beliefs, acculturation, access to health care)39.
Conclusions
NAs experienced greater cardiometabolic allostatic load that was in turn associated with a pronociceptive pain phenotype indicative of latent spinal sensitization (ie, facilitation of spinal nociception, no hyperalgesia). Thus, cardiometabolic allostatic load could contribute to pain disparities in this population.
Highlights
Native Americans (NAs) experience high rates of chronic pain
NAs have suffered generations of sociocultural stressors
Allostatic load (AL) is stress-related wear-and-tear on homeostatic systems
Cardiometabolic AL linked NA ethnicity to sensitization of spinal nociception
Cardiometabolic AL was not linked to pain sensitization
Perspective:
Healthy, pain-free Native Americans experienced greater cardiometabolic allostatic load that was associated with a pronociceptive pain phenotype indicative of latent spinal sensitization (ie, spinal sensitization not associated with hyperalgesia). This latent spinal sensitization could represent a pain risk phenotype for this population.
Acknowledgments:
The authors would like to thank Burkhart Hahn, Heather B. Coleman, Kathryn A. Thompson, Jessica M. Fisher, Samuel P. Herbig, Ky’Lee B. Barnoski, Garrett Newsom, and Lucinda Chee for their help with data collection, as well as Dr. John M. Chaney for his consultation on the project.
Disclosures:
This research was supported by the National Institute on Minority Health and Health Disparities of the National Institute of Health under Award Number R01MD007807. Yvette Guereca (DGE-1009425), Edward Lannon (DGE-1546597), and Shreela Palit (DGE-1546597) were supported by the National Science Foundation Graduate Research Fellowship Program. The content is solely the responsibility of the authors and does not necessarily reflect the views of the National Institutes of Health, National Science Foundation, Indian Health Service, or the Cherokee Nation. The authors report no conflicts of interest. The authors report no conflicts of interest.
Footnotes
Publisher's Disclaimer: This is a PDF file of an unedited manuscript that has been accepted for publication. As a service to our customers we are providing this early version of the manuscript. The manuscript will undergo copyediting, typesetting, and review of the resulting proof before it is published in its final form. Please note that during the production process errors may be discovered which could affect the content, and all legal disclaimers that apply to the journal pertain.
References
- 1.Allen JJ, Chambers AS, Towers DN. The many metrics of cardiac chronotropy: A pragmatic primer and a brief comparison of metrics. Biol. Psychol 74:243–262, 2007 [DOI] [PubMed] [Google Scholar]
- 2.Appelhans BM, Luecken LJ. Heart rate variability as an index of regulated emotional responding. Rev. Gen. Psychol 10:229–240, 2006 [Google Scholar]
- 3.Appelhans BM, Luecken LJ. Heart rate variability and pain: Associations of two interrelated homeostatic processes. Biol. Psychol 77:174–182, 2008 [DOI] [PubMed] [Google Scholar]
- 4.Arendt-Nielsen L, Brennum J, Sindrup S, Bak P. Electrophysiological and psychophysical qunatification of temporal summation in the human nociceptive system. European Journal of Applied Physiology. 68:266–273, 1994 [DOI] [PubMed] [Google Scholar]
- 5.Arendt-Nielsen L, Petersen-Felix S, Fischer M, Bak P, Bjerring P, Zbinden AM. The effect of N-methyl-D-aspartate antagonist (ketamine) on single and repeated nociceptive stimuli: A placebo controlled experimental human study. Anesthesia and Analgesia. 81:63–68, 1995 [DOI] [PubMed] [Google Scholar]
- 6.Arendt-Nielsen L, Sonnenborg FA, Andersen OK. Facilitation of the withdrawal reflex by repeated transcutaneous electrical stimulation: An experimental study of central integration in humans. European Journal of Applied Physiology. 81:165–173, 2000 [DOI] [PubMed] [Google Scholar]
- 7.Banic B, Petersen-Felix S, Andersen OK, Radanov BP, Villiger PM, Arendt-Nielsen L, Curatolo M. Evidence for spinal cord hypersensitivity in chronic pain after whiplash injury and in fibromyalgia. Pain. 107:7–15, 2004 [DOI] [PubMed] [Google Scholar]
- 8.Barnes PM, Adams PF, Powell-Griner E: Health characteristics of the American Indian or Alaska Native adult population: United States, 2004–2008.(USDHHS, Ed.), National Center for Health Statistics, Hyattesville, MD, 2010. [PubMed] [Google Scholar]
- 9.Bartley EJ, Fillingim RB. Sex differences in pain: a brief review of clinical and experimental findings. Br. J. Anaesth 111:52–58, 2013 [DOI] [PMC free article] [PubMed] [Google Scholar]
- 10.Beals J, Manson SM, Whitesell NR, Spicer P, Novins DK, Mitchell CM. Prevalence of DSM-IV disorders and attendant help-seeking in 2 American Indian reservation populations. Arch. Gen. Psychiatry 62:99–108, 2005 [DOI] [PubMed] [Google Scholar]
- 11.Beals J, Novins DK, Whitesell NR, Spicer P, Mitchell CM, Manson SM, American Indian Service Utilization PE, Risk, Team PFP. Prevalence of mental disorders and utilization of mental health services in two American Indian reservation populations: mental health disparities in a national context. Am. J. Psychiatry 162:1723–1732, 2005 [DOI] [PubMed] [Google Scholar]
- 12.Bebbington P, Nayani T. The psychosis screening questionnaire. International Journal of Methods in Psychatric Research. 5:11–19, 1995 [Google Scholar]
- 13.Blue Bird Jernigan V, Salvatore AL, Styne DM, Winkleby M. Addressing food insecurity in a Native American reservation using community-based participatory research. Health Educ. Res 27:645–655, 2012 [DOI] [PMC free article] [PubMed] [Google Scholar]
- 14.Bowers ME, Yehuda R. Intergenerational transmission of stress in humans. Neuropsychopharmacology. 41:232–244, 2016 [DOI] [PMC free article] [PubMed] [Google Scholar]
- 15.Boyd‐Ball AJ, Manson SM, Noonan C, Beals J. Traumatic events and alcohol use disorders among American Indian adolescents and young adults. Journal of Traumatic Stress: Official Publication of the International Society for Traumatic Stress Studies. 19:937–947, 2006 [DOI] [PubMed] [Google Scholar]
- 16.Brave Heart MYH, Chase J, Myers O, Elkins J, Skipper B, Schmitt C, Mootz J, Waldorf V. Iwankapiya American Indian pilot clinical trial: Historical trauma and group interpersonal psychotherapy. Psychotherapy. 2019 [DOI] [PMC free article] [PubMed] [Google Scholar]
- 17.Brockie TN, Dana-Sacco G, Wallen GR, Wilcox HC, Campbell JC. The relationship of adverse childhood experiences to PTSD, depression, poly-drug use and suicide attempt in reservation-based Native American adolescents and young adults. Am. J. Community Psychol 55:411–421, 2015 [DOI] [PubMed] [Google Scholar]
- 18.Brockie TN, Heinzelmann M, Gill J. A framework to examine the role of epigenetics in health disparities among Native Americans. Nurs. Res. Pract 2013, 2013. [DOI] [PMC free article] [PubMed] [Google Scholar]
- 19.Bruehl S, Chung OY. Interactions between the cardiovascular and pain regulatory systems: an updated review of mechanisms and possible alterations in chronic pain. Neurosci. Biobehav. Rev 28:395–414, 2004 [DOI] [PubMed] [Google Scholar]
- 20.Buysse DJ, Reynolds CF, Monk TH, Berman SR, Kupfer DJ. The Pittsburgh Sleep Quality Index (PSQI): A new instrument for psychiatric research and practice. Psychiatry Res. 28:193–213, 1989 [DOI] [PubMed] [Google Scholar]
- 21.Campbell CM, Edwards RR, Fillingim RB. Ethnic differences in responses to multiple experimental pain stimuli. Pain. 113:20–26, 2005 [DOI] [PubMed] [Google Scholar]
- 22.Campbell CM, France CR, Robinson ME, Logan HL, Geffken GR, Fillingim RB. Ethnic differences in diffuse noxious inhibitory controls. J Pain. 9:759–766, 2008 [DOI] [PMC free article] [PubMed] [Google Scholar]
- 23.Carroll D, Ginty AT, Whittaker AC, Lovallo WR, de Rooij SR. The behavioural, cognitive, and neural corollaries of blunted cardiovascular and cortisol reactions to acute psychological stress. Neurosci. Biobehav. Rev 77:74–86, 2017 [DOI] [PMC free article] [PubMed] [Google Scholar]
- 24.CDC: Health Characteristics of the American Indian and Alaska Native Adult Population: United States, 2004–2008, 2010. [PubMed] [Google Scholar]
- 25.Centers for Disease Control and Prevention: National Diabetes Statistics Report: Estimates of Diabetes and Its Burden in the United States, , US Department of Health and Human Services, Atlanta, GA, 2014. [Google Scholar]
- 26.Centers for Disease Control and Prevention: Summary Health Statistics: National Health Interview Survey: 2014, 2016.
- 27.Chen W, Taché Y, Marvizón JC. Corticotropin-releasing factor in the brain and blocking spinal descending signals induce hyperalgesia in the latent sensitization model of chronic pain. Neuroscience. 381:149–158, 2018 [DOI] [PMC free article] [PubMed] [Google Scholar]
- 28.Cleeland CS, Gonin R, Baez L, Loehrer P, Pandya KJ. Pain and treatment of pain in minority patients with cancer. The Eastern Cooperative Oncology Group Minority Outpatient Pain Study. Ann. Intern. Med 127:813–816, 1997 [DOI] [PubMed] [Google Scholar]
- 29.Cohen S, Kamarck T, Mermelstein R: Perceived stress scale, Mind Garden, Inc, Menlo Park, CA, 1994. [Google Scholar]
- 30.Corder G, Doolen S, Donahue RR, Winter MK, Jutras BL, He Y, Hu X, Wieskopf J, Mogil J, Storm D. Constitutive μ-opioid receptor activity leads to long-term endogenous analgesia and dependence. Science. 341:1394–1399, 2013 [DOI] [PMC free article] [PubMed] [Google Scholar]
- 31.Craig CL, Marshall AL, Sjöström M, Bauman AE, Booth ML, Ainsworth BE, Pratt M, Ekelund U, Yngve A, Sallis JF. International physical activity questionnaire: 12-country reliability and validity. Med. Sci. Sports Exerc 35:1381–1395, 2003 [DOI] [PubMed] [Google Scholar]
- 32.Crimmins EM, Johnston M, Hayward M, Seeman T. Age differences in allostatic load: an index of physiological dysregulation. Exp. Gerontol 38:731–734, 2003 [DOI] [PubMed] [Google Scholar]
- 33.Daskalakis NP, Bagot RC, Parker KJ, Vinkers CH, de Kloet ER. The three-hit concept of vulnerability and resilience: toward understanding adaptation to early-life adversity outcome. Psychoneuroendocrinology. 38:1858–1873, 2013 [DOI] [PMC free article] [PubMed] [Google Scholar]
- 34.Davies SN, Lodge D. Evidence for involvement of N-methyl-d-aspartate receptors in ‘wind-up’ of class 2 neurons in the dorsal horn of the rate. Brain Res. 424:402–406, 1987 [DOI] [PubMed] [Google Scholar]
- 35.Dennis CH, Clohessy DS, Stone AL, Darnall BD, Wilson AC. Adverse childhood experiences in mothers with chronic pain and intergenerational impact on children. The Journal of Pain. 20:1209–1217, 2019 [DOI] [PMC free article] [PubMed] [Google Scholar]
- 36.Derogatis LR: SCL-90-R : symptom checklist-90-R : administration, scoring & procedures manual, [National Computer Systems, Inc.], [Minneapolis, Minn.], 1994. [Google Scholar]
- 37.Deyo RA, Mirza SK, Martin BI. Back pain prevalence and visit rates: estimates from U.S. national surveys, 2002. Spine (Phila Pa 1976). 31:2724–2727, 2006 [DOI] [PubMed] [Google Scholar]
- 38.Earle KA, Cross A: Child abuse and neglect among American Indian/Alaska Native children: An analysis of existing data, Casey Family Programs, 2001. [Google Scholar]
- 39.Ehrhardt MD, Gray KN, Kuhn BL, Lannon EW, Palit S, Sturycz CA, Guereca YM, Payne MF, Hellman NM, Toledo TA, Hahn BJ, Shadlow JO, Rhudy JL. A qualitative analysis of pain meaning: Results from the Oklahoma Study of Native American Pain Risk (OK-SNAP). J. Pain 2019 [DOI] [PubMed] [Google Scholar]
- 40.Eide PK. Wind-up and the NMDA receptor complex from a clinical perspective. Eur J Pain. 4:5–15, 2000 [DOI] [PubMed] [Google Scholar]
- 41.Emery CF, France CR, Harris J, Norman G, Vanarsdalen C. Effects of progressive muscle relaxation training on nociceptive flexion reflex threshold in healthy young adults: a randomized trial. Pain. 138:375–379, 2008 [DOI] [PubMed] [Google Scholar]
- 42.Emery CF, Keefe FJ, France CR, Affleck G, Waters S, Fondow MD, McKee DC, France JL, Hackshaw KV, Caldwell DS, Stainbrook D. Effects of a brief coping skills training intervention on nociceptive flexion reflex threshold in patients having osteoarthritic knee pain: a preliminary laboratory study of sex differences. J. Pain Symptom Manage 31:262–269, 2006 [DOI] [PubMed] [Google Scholar]
- 43.Evans-Campbell T Historical trauma in American Indian/Native Alaska communities: A multilevel framework for exploring impacts on individuals, families, and communities. Journal of interpersonal violence. 23:316–338, 2008 [DOI] [PubMed] [Google Scholar]
- 44.Farrell M, Gibson S. Age interacts with stimulus frequency in the temporal summation of pain. Pain Med. 8:514–520, 2007 [DOI] [PubMed] [Google Scholar]
- 45.Fayaz A, Ayis S, Panesar SS, Langford RM, Donaldson LJ. Assessing the relationship between chronic pain and cardiovascular disease: a systematic review and meta-analysis. Scandinavian journal of pain. 13:76–90, 2016 [DOI] [PubMed] [Google Scholar]
- 46.Ferucci ED, Templin DW, Lanier AP. Rheumatoid arthritis in American Indians and Alaska Natives: a review of the literature. Semin. Arthritis Rheum 34:662–667, 2005 [DOI] [PubMed] [Google Scholar]
- 47.Fillingim RB, Maixner W, Girdler SS, Light KC, Sheps DS, Mason GA. Ischemic but not thermal pain sensitivity varies across the menstrual cycle. Psychosom. Med 559:512, 1997 [DOI] [PubMed] [Google Scholar]
- 48.Findling MG, Casey LS, Fryberg SA, Hafner S, Blendon RJ, Benson JM, Sayde JM, Miller C. Discrimination in the United States: Experiences of Native Americans. Health Serv. Res 54:1431–1441, 2019 [DOI] [PMC free article] [PubMed] [Google Scholar]
- 49.Forrester SN, Leoutsakos J-M, Gallo JJ, Thorpe RJ, Seeman TE. Association between allostatic load and health behaviours: a latent class approach. J. Epidemiol. Community Health 73:340–345, 2019 [DOI] [PubMed] [Google Scholar]
- 50.France CR, Rhudy JL, McGlone S. Using normalized EMG to define the nociceptive flexion reflex (NFR) threshold: further evaluation of standardized NFR scoring criteria. Pain. 145:211–218, 2009 [DOI] [PubMed] [Google Scholar]
- 51.Godfrey KM, Sheppard A, Gluckman PD, Lillycrop KA, Burdge GC, McLean C, Rodford J, Slater-Jefferies JL, Garratt E, Crozier SR. Epigenetic gene promoter methylation at birth is associated with child’s later adiposity. Diabetes. 60:1528–1534, 2011 [DOI] [PMC free article] [PubMed] [Google Scholar]
- 52.Gone JP. A community-based treatment for Native American historical trauma: Prospects for evidence-based practice. J. Consult. Clin. Psychol 77:751–762, 2009 [DOI] [PubMed] [Google Scholar]
- 53.Goodin BR, Bulls HW, Herbert MS, Schmidt J, King CD, Glover TL, Sotolongo A, Sibille KT, Cruz-Almeida Y, Staud R. Temporal summation of pain as a prospective predictor of clinical pain severity in adults aged 45 years and above with knee osteoarthritis: ethnic differences. Psychosom. Med 76:302, 2014 [DOI] [PMC free article] [PubMed] [Google Scholar]
- 54.Goodson NJ, Smith BH, Hocking LJ, McGilchrist MM, Dominiczak AF, Morris A, Porteous DJ, Goebel A, Scotland G. Cardiovascular risk factors associated with the metabolic syndrome are more prevalent in people reporting chronic pain: results from a cross-sectional general population study. PAIN®. 154:1595–1602, 2013 [DOI] [PubMed] [Google Scholar]
- 55.Granovsky Y Conditioned pain modulation: a predictor for development and treatment of neuropathic pain. Current pain and headache reports. 17:361, 2013 [DOI] [PubMed] [Google Scholar]
- 56.Granovsky Y, Nahman-Averbuch H, Khamaisi M, Granot M. Efficient conditioned pain modulation despite pain persistence in painful diabetic neuropathy. PAIN Reports. 2017 [DOI] [PMC free article] [PubMed] [Google Scholar]
- 57.Güereca Y, Kuhn B, Lannon E, Palit S, Sturycz C, Payne M, Hellman N, Toledo T, Huber F, Demuth M, Palit S, Shadlow JO, Rhudy JL. The Relationship between Discrimination and Pain Tolerance and its Potential Mediation by Stress: Results from the Oklahoma Study of Native American Pain Risk (OK-SNAP). The Journal of Pain. 20:S40–S41, 2019 [Google Scholar]
- 58.Guirimand F, Dupont X, Brasseur L, Chauvin M, Bouhassira D. The effects of ketamine on the temporal summation (wind-up) of the R(III) nociceptive flexion reflex and pain in humans. Anesth. Analg 90:408–414, 2000 [DOI] [PubMed] [Google Scholar]
- 59.Hackett J, Naugle KE, Naugle KM. The Decline of Endogenous Pain Modulation With Aging: A Meta-Analysis of Temporal Summation and Conditioned Pain Modulation. The Journal of Pain. 2019 [DOI] [PubMed] [Google Scholar]
- 60.Hagströmer M, Oja P, Sjöström M. The International Physical Activity Questionnaire (IPAQ): a study of concurrent and construct validity. Public Health Nutr. 9:755–762, 2006 [DOI] [PubMed] [Google Scholar]
- 61.Hellman N, Sturycz CA, Lannon EW, Kuhn BL, Güereca YM, Toledo TA, Payne MF, Huber FA, Demuth M, Palit S, Shadlow JO, Rhudy JL. Conditioned pain modulation in sexual assault survivors. The Journal of Pain. 20:1027–1039, 2019 [DOI] [PMC free article] [PubMed] [Google Scholar]
- 62.Hershkovich O, Friedlander A, Gordon B, Arzi H, Derazne E, Tzur D, Shamis A, Afek A. Associations of body mass index and body height with low back pain in 829,791 adolescents. Am. J. Epidemiol 178:603–609, 2013 [DOI] [PubMed] [Google Scholar]
- 63.Howard BV, Lee ET, Cowan LD, Devereux RB, Galloway JM, Go OT, Howard WJ, Rhoades ER, Robbins DC, Sievers ML. Rising tide of cardiovascular disease in American Indians: the Strong Heart Study. Circulation. 99:2389–2395, 1999 [DOI] [PubMed] [Google Scholar]
- 64.Hoyle RH: Handbook of structural equation modeling, Guilford press, 2012. [Google Scholar]
- 65.Huber FA, Kuhn BL, Lannon EW, Sturycz CA, Payne MF, Hellman N, Toledo TA, Guereca YM, DeMuth M, Palit S, Shadlow JO, Rhudy JL. Less Efficient Endogenous Inhibition of Spinal Nociception Predicts Chronic Pain Onset: A Prospective Analysis from the Oklahoma Study of Native American Pain Risk (OK-SNAP). J Pain. 20:S40, 2019 [Google Scholar]
- 66.Jernigan VBB, D’Amico EJ, Duran B, Buchwald D. Multilevel and community-level interventions with Native Americans: Challenges and opportunities. Prev. Sci 21:65–73, 2020 [DOI] [PMC free article] [PubMed] [Google Scholar]
- 67.Jimenez N, Garroutte E, Kundu A, Morales L, Buchwald D. A Review of the Experience, Epidemiology, and Management of Pain among American Indian, Alaska Native, and Aboriginal Canadian Peoples. J Pain. 12:511–522, 2011 [DOI] [PMC free article] [PubMed] [Google Scholar]
- 68.John-Henderson NA, Gruman HE, Counts CJ, Ginty AT. American Indian young adults display diminished cardiovascular and cortisol responses to acute psychological stress. Psychoneuroendocrinology. 114:104583, 2020 [DOI] [PMC free article] [PubMed] [Google Scholar]
- 69.Jöreskog KG, Sörbom D. LISREL 8.80. Chicago: Scientific Software International. 2006 [Google Scholar]
- 70.Juster R-P, McEwen BS, Lupien SJ. Allostatic load biomarkers of chronic stress and impact on health and cognition. Neurosci. Biobehav. Rev 35:2–16, 2010 [DOI] [PubMed] [Google Scholar]
- 71.Kell PA, Hellman N, Huber FA, Lannon EW, Kuhn BL, Sturycz CA, Toledo TA, Demuth MJ, Hahn BJ, Shadlow JO, Rhudy JL. The relationship between adverse life events and endogenous inhibition of pain and spinal nociception: Findings from the Oklahoma Study of Native American Pain Risk (OK-SNAP). under review [DOI] [PMC free article] [PubMed] [Google Scholar]
- 72.Kell PA, Hellman N, Lannon EW, Kuhn BL, Sturycz CA, Toledo TA, Huber FA, Demuth MJ, Hahn BJ, Shadlow JO, Rhudy JL: Conditioned Pain Modulation of the Nociceptive Flexion Reflex is Predicted by Adverse Life Events. In: American Psychosomatic Society, Long Beach, CA, 2020. [Google Scholar]
- 73.Kenney MK, Singh GK. Adverse childhood experiences among American Indian/Alaska native children: the 2011–2012 national survey of children’s health. Scientifica. 2016, 2016. [DOI] [PMC free article] [PubMed] [Google Scholar]
- 74.Kline RB: Principles and practice of structural equation modeling, Guilford publications, 2015. [Google Scholar]
- 75.Latremoliere A, Woolf CJ. Central sensitization: a generator of pain hypersensitivity by central neural plasticity. The Journal of Pain. 10:895–926, 2009 [DOI] [PMC free article] [PubMed] [Google Scholar]
- 76.Le Roy C, Laboureyras E, Gavello-Baudy S, Chateauraynaud J, Laulin J-P, Simonnet G. Endogenous opioids released during non-nociceptive environmental stress induce latent pain sensitization Via a NMDA-dependent process. The Journal of Pain. 12:1069–1079, 2011 [DOI] [PubMed] [Google Scholar]
- 77.Leake J, Jozzy S, Uswak G. Severe dental caries, impacts and determinants among children 2–6 years of age in Inuvik Region, Northwest Territories, Canada. Journal (Canadian Dental Association). 74:519–519, 2008 [PubMed] [Google Scholar]
- 78.Libby AM, Orton HD, Novins DK, Beals J, Manson SM. Childhood physical and sexual abuse and subsequent depressive and anxiety disorders for two American Indian tribes. Psychol. Med 35:329–340, 2005 [DOI] [PubMed] [Google Scholar]
- 79.Little TD, Lang KM, Wu W, Rhemtulla M. Missing data. Developmental psychopathology.1–37, 2016 [Google Scholar]
- 80.Manson SM, Beals J, Klein SA, Croy CD, Team A-s. Social epidemiology of trauma among 2 American Indian reservation populations. Am. J. Public Health 95:851–859, 2005 [DOI] [PMC free article] [PubMed] [Google Scholar]
- 81.Mäntyselkä P, Miettola J, Niskanen L, Kumpusalo E. Glucose regulation and chronic pain at multiple sites. Rheumatology. 47:1235–1238, 2008 [DOI] [PubMed] [Google Scholar]
- 82.Mäntyselkä P, Miettola J, Niskanen L, Kumpusalo E. Persistent pain at multiple sites—connection to glucose derangement. Diabetes Res. Clin. Pract 84:e30–e32, 2009 [DOI] [PubMed] [Google Scholar]
- 83.Mauldin J, Cameron HD, Jeanotte D, Solomon G, Jarvis JN. Chronic arthritis in children and adolescents in two Indian health service user populations. BMC Musculoskelet. Disord 5:30–30, 2004 [DOI] [PMC free article] [PubMed] [Google Scholar]
- 84.McCorry LK. Physiology of the autonomic nervous system. Am. J. Pharm. Educ 71, 2007. [DOI] [PMC free article] [PubMed] [Google Scholar]
- 85.McCracken LM, Matthews AK, Tang TS, Cuba SL. A comparison of Blacks and Whites seeking treatment for chronic pain. The Clinical Journal of Pain. 17:249–255, 2001 [DOI] [PubMed] [Google Scholar]
- 86.McEwen BS. Stress, adaptation, and disease. Allostasis and allostatic load. Annals of the New York Academy of Sciences. 840:33–44, 1998 [DOI] [PubMed] [Google Scholar]
- 87.McEwen BS. Allostasis and the epigenetics of brain and body health over the life course: the brain on stress. JAMA psychiatry. 74:551–552, 2017 [DOI] [PubMed] [Google Scholar]
- 88.McEwen BS, Bowles NP, Gray JD, Hill MN, Hunter RG, Karatsoreos IN, Nasca C. Mechanisms of stress in the brain. Nat. Neurosci 18:1353, 2015 [DOI] [PMC free article] [PubMed] [Google Scholar]
- 89.Meagher MW, Arnau RC, Rhudy JL. Pain and emotion: effects of affective picture modulation. Psychosom. Med 63:79–90, 2001 [DOI] [PubMed] [Google Scholar]
- 90.Mendell LM. Physiological properties of unmyelinated fibre projection to the spinal cord. Expermental Neurology 16:316–332, 1966 [DOI] [PubMed] [Google Scholar]
- 91.Mendell LM, Wall PD. Responses of single dorsal cord cells to peripheral cutaneous unmyelinated fibres. Nature. 206:97–99, 1965 [DOI] [PubMed] [Google Scholar]
- 92.Monson CM, Shnaider P: Treating PTSD with cognitive-behavioral therapies: Interventions that work, American Psychological Association, 2014. [Google Scholar]
- 93.Naugle KM, Ohlman T, Naugle KE, Riley ZA, Keith NR. Physical activity behavior predicts endogenous pain modulation in older adults. Pain. 158:383–390, 2017 [DOI] [PubMed] [Google Scholar]
- 94.Naugle KM, RILEY JL 3rd. Self-reported physical activity predicts pain inhibitory and facilitatory function. Med. Sci. Sports Exerc 46:622, 2014 [DOI] [PMC free article] [PubMed] [Google Scholar]
- 95.Niskanen J-P, Tarvainen MP, Ranta-Aho PO, Karjalainen PA. Software for advanced HRV analysis. Comput. Methods Programs Biomed 76:73–81, 2004 [DOI] [PubMed] [Google Scholar]
- 96.O’Connell M, Buchwald DS, Duncan GE. Food access and cost in American Indian communities in Washington State. J. Am. Diet. Assoc 111:1375–1379, 2011 [DOI] [PMC free article] [PubMed] [Google Scholar]
- 97.Palit S, Kerr KL, Kuhn BL, Terry EL, DelVentura JL, Bartley EJ, Shadlow JO, Rhudy JL. Exploring pain processing differences in Native Americans. Health Psychol. 32:1127–1136, 2013 [DOI] [PubMed] [Google Scholar]
- 98.Pember MA. Intergenerational trauma: Understanding natives’ inherited pain. Indian Country Today Media Network. 2016 [Google Scholar]
- 99.Piché M, Arsenault M, Rainville P. Cerebral and cerebrospinal processes underlying counterirritation analgesia. J. Neurosci 29:14236–14246, 2009 [DOI] [PMC free article] [PubMed] [Google Scholar]
- 100.Pole N, Gone JP, Kulkarni M. Posttraumatic stress disorder among ethnoracial minorities in the United States. Clinical Psychology: Science and Practice. 15:35–61, 2008 [Google Scholar]
- 101.Powers MB, Halpern JM, Ferenschak MP, Gillihan SJ, Foa EB. A meta-analytic review of prolonged exposure for posttraumatic stress disorder. Clin. Psychol. Rev 30:635–641, 2010 [DOI] [PubMed] [Google Scholar]
- 102.Preacher KJ, Hayes AF. SPSS and SAS procedures for estimating indirect effects in simple mediation models. Behav. Res. Methods Instrum. Comput 36:717–731, 2004 [DOI] [PubMed] [Google Scholar]
- 103.Preacher KJ, Hayes AF. Asymptotic and resampling strategies for assessing and comparing indirect effects in multiple mediator models. Behav. Res. Methods 40:879–891, 2008 [DOI] [PubMed] [Google Scholar]
- 104.Price DD, Hayes RL, Ruda M, Dubner R. Neural representation of cutaneous aftersensations by spinothalamic tract neurons. Fed. Proc 37:2237, 1978 [PubMed] [Google Scholar]
- 105.Rainville P, Feine JS, Bushnell MC, Duncan GH. A psychophysical comparison of sensory and affective responses to four modalities of experimental pain. Somatosensory & motor research. 9:265–277, 1992 [DOI] [PubMed] [Google Scholar]
- 106.Resick PA, Nishith P, Weaver TL, Astin MC, Feuer CA. A comparison of cognitive-processing therapy with prolonged exposure and a waiting condition for the treatment of chronic posttraumatic stress disorder in female rape victims. J. Consult. Clin. Psychol 70:867, 2002 [DOI] [PMC free article] [PubMed] [Google Scholar]
- 107.Resick PA, Schnicke MK: Cognitive processing therapy for rape victims: A treatment manual, Sage Publications, Inc, Thousand Oaks, CA, US, 1993. [Google Scholar]
- 108.Rhee H Prevalence and predictors of headaches in US adolescents. Headache: The Journal of Head and Face Pain. 40:528–538, 2000 [DOI] [PubMed] [Google Scholar]
- 109.Rhudy JL, Dubbert PM, Parker JD, Burke RS, Williams AE. Affective modulation of pain in substance dependent veterans. Pain Med. 7:483–500, 2006 [DOI] [PubMed] [Google Scholar]
- 110.Rhudy JL, France CR. Defining the nociceptive flexion reflex (NFR) threshold in human participants: A comparison of different scoring criteria. Pain. 128:244–253, 2007 [DOI] [PMC free article] [PubMed] [Google Scholar]
- 111.Rhudy JL, France CR, Bartley EJ, McCabe KM, Williams AE. Psychophysiological responses to pain: Further validation of the nociceptive flexion reflex (NFR) as a measure of nociception using multilevel modeling. Psychophysiology. 46:939–948, 2009 [DOI] [PubMed] [Google Scholar]
- 112.Rhudy JL, Hellman N, Sturycz CA, Toledo TA, Palit S. Modified biofeedback (Conditioned Biofeedback) promotes antinociception by increasing the nociceptive flexion reflex threshold and reducing temporal summation of pain: A controlled trial. The Journal of Pain. 10.1016/j.jpain.2019.1010.1006, 2019 [DOI] [PubMed] [Google Scholar]
- 113.Rhudy JL, Huber F, Kuhn BL, Lannon EW, Palit S, Payne MF, Hellman N, Sturycz CA, Güereca YM, Toledo TA. Pain-related anxiety promotes pronociceptive processes in Native Americans: bootstrapped mediation analyses from the Oklahoma Study of Native American Pain Risk. Pain Reports. 5, 2020. [DOI] [PMC free article] [PubMed] [Google Scholar]
- 114.Rhudy JL, Lannon EW, Kuhn BL, Palit S, Payne MF, Sturycz CA, Hellman N, Güereca YM, Toledo TA, Coleman HB, Thompson KA, Fisher JM, Herbig SP, Barnoski KB, Chee L, Shadlow JO. Sensory, Affective, and Catastrophizing Reactions to Multiple Stimulus Modalities: Results from the Oklahoma Study of Native American Pain Risk. J Pain. 20:965–979, 2019 [DOI] [PMC free article] [PubMed] [Google Scholar]
- 115.Rhudy JL, Lannon EW, Kuhn BL, Palit S, Payne MF, Sturycz CA, Hellman N, Guereca YM, Toledo TA, Huber F, Demuth MJ, Hahn BJ, Chaney JM, Shadlow JO. Assessing peripheral fibers, pain sensitivity, central sensitization, and descending inhibition in Native Americans: Main findings from the Oklahoma Study of Native American Pain Risk. Pain. 161:388–404, 2020 [DOI] [PMC free article] [PubMed] [Google Scholar]
- 116.Rhudy JL, Martin SL, Terry EL, France CR, Bartley EJ, DelVentura JL, Kerr KL. Pain catastrophizing is related to temporal summation of pain, but not temporal summation of the nociceptive flexion reflex. Pain. 152:794–801, 2011 [DOI] [PubMed] [Google Scholar]
- 117.Rhudy JL, Williams AE, McCabe KM, Russell JL, Maynard LJ. Emotional control of nociceptive reactions (ECON): Do affective valence and arousal play a role? Pain. 136:250–261, 2008 [DOI] [PubMed] [Google Scholar]
- 118.Robin RW, Chester B, Rasmussen JK, Jaranson JM, Goldman D. Prevalence and characteristics of trauma and posttraumatic stress disorder in a southwestern American Indian community. Am. J. Psychiatry 154:1582–1588, 1997 [DOI] [PubMed] [Google Scholar]
- 119.Robin RW, Chester B, Rasmussen JK, Jaranson JM, Goldman D. Prevalence, characteristics, and impact of childhood sexual abuse in a Southwestern American Indian tribe. Child Abuse Neglect. 21:769–787, 1997 [DOI] [PubMed] [Google Scholar]
- 120.Roby-Brami A, Bussel B, Willer JC, Le Bars D. An electrophysiological investigation into the pain-relieving effects of heterotopic nociceptive stimuli. Probable involvement of a supraspinal loop. Brain: A Journal Of Neurology. 110 (Pt 6):1497, 1987 [DOI] [PubMed] [Google Scholar]
- 121.Rodriquez EJ, Kim EN, Sumner AE, Nápoles AM, Pérez-Stable EJ. Allostatic load: importance, markers, and score determination in minority and disparity populations. J. Urban Health 96:3–11, 2019 [DOI] [PMC free article] [PubMed] [Google Scholar]
- 122.Ross E, Huber F, Kuhn B, Lannon E, Sturycz C, Payne M, Hellman N, Toledo T, Güereca Y, Palit S, Demuth M, Shadlow JO, Rhudy JL. Assessing Chronic Pain Onset in Native Americans: Follow-Up Results from the Oklahoma Study of Native American Pain Risk (OK-SNAP). The Journal of Pain. 20:S33, 2019 [Google Scholar]
- 123.Salomons TV, Moayedi M, Erpelding N, Davis KD. A brief cognitive-behavioural intervention for pain reduces secondary hyperalgesia. PAIN®. 155:1446–1452, 2014 [DOI] [PubMed] [Google Scholar]
- 124.Sandrini G, Serrao M, Rossi P, Romaniello A, Cruccu G, Willer JC. The lower limb flexion reflex in humans. Prog. Neurobiol 77:353–395, 2005 [DOI] [PubMed] [Google Scholar]
- 125.Schreiber JB, Nora A, Stage FK, Barlow EA, King J. Reporting structural equation modeling and confirmatory factor analysis results: A review. The Journal of educational research. 99:323–338, 2006 [Google Scholar]
- 126.Seeman TE, Singer BH, Rowe JW, Horwitz RI, McEwen BS. Price of adaptation—allostatic load and its health consequences: MacArthur studies of successful aging. Arch. Intern. Med 157:2259–2268, 1997 [PubMed] [Google Scholar]
- 127.Seeman TE, Singer BH, Ryff CD, Love GD, Levy-Storms L. Social relationships, gender, and allostatic load across two age cohorts. Psychosom. Med 64:395–406, 2002 [DOI] [PubMed] [Google Scholar]
- 128.Shaffer F, Ginsberg J. An overview of heart rate variability metrics and norms. Frontiers in public health. 5:258, 2017 [DOI] [PMC free article] [PubMed] [Google Scholar]
- 129.Sibille KT, McBeth J, Smith D, Wilkie R. Allostatic load and pain severity in older adults: Results from the English Longitudinal Study of Ageing. Exp. Gerontol 88:51–58, 2017 [DOI] [PMC free article] [PubMed] [Google Scholar]
- 130.Sibille KT, Riley JL, McEwen B. Authors build an important foundation for further research. The Journal of Pain. 13:1269–1270, 2012 [DOI] [PMC free article] [PubMed] [Google Scholar]
- 131.Sibille KT, Steingrímsdóttir ÓA, Fillingim RB, Stubhaug A, Schirmer H, Chen H, McEwen BS, Nielsen CS. Investigating the burden of chronic pain: an inflammatory and metabolic composite. Pain Research and Management. 2016, 2016. [DOI] [PMC free article] [PubMed] [Google Scholar]
- 132.Skljarevski V, Ramadan NM. The nociceptive flexion reflex in humans - review article. . Pain. 96:3–8, 2002 [DOI] [PubMed] [Google Scholar]
- 133.Slade GD, Sanders AE, By K. Role of allostatic load in sociodemographic patterns of pain prevalence in the US population. The Journal of Pain. 13:666–675, 2012 [DOI] [PMC free article] [PubMed] [Google Scholar]
- 134.Sotero M A conceptual model of historical trauma: Implications for public health practice and research. Journal of health disparities research and practice. 1:93–108, 2006 [Google Scholar]
- 135.Sturycz CA, Hellman N, Payne MF, Kuhn BL, Hahn B, Lannon EW, Palit S, Güereca YM, Toledo TA, Shadlow JO, Rhudy JL. Race/Ethnicity Does Not Moderate the Relationship Between Adverse Life Experiences and Temporal Summation of the Nociceptive Flexion Reflex and Pain: Results From the Oklahoma Study of Native American Pain Risk. The Journal of Pain. 2019 [DOI] [PMC free article] [PubMed] [Google Scholar]
- 136.Taylor BK, Corder G: Endogenous analgesia, dependence, and latent pain sensitization. In: Behavioral Neurobiology of Chronic Pain, Springer, 2014, pp. 283–325. [DOI] [PMC free article] [PubMed] [Google Scholar]
- 137.Terry EL, France CR, Bartley EJ, DelVentura JL, Kerr KL, Vincent AL, Rhudy JL. Standardizing procedures to study sensitization of human spinal nociceptive processes: Comparing parameters for temporal summation of the nociceptive flexion reflex (TS-NFR). Int. J. Psychophysiol 81:263–274, 2011 [DOI] [PubMed] [Google Scholar]
- 138.Tesfaye S, Chaturvedi N, Eaton SE, Ward JD, Manes C, Ionescu-Tirgoviste C, Witte DR, Fuller JH. Vascular risk factors and diabetic neuropathy. N. Engl. J. Med 352:341–350, 2005 [DOI] [PubMed] [Google Scholar]
- 139.Thayer JF, Sternberg E. Beyond heart rate variability: vagal regulation of allostatic systems. Ann. N. Y. Acad. Sci 1088:361–372, 2006 [DOI] [PubMed] [Google Scholar]
- 140.Thayer Z, Barbosa‐Leiker C, McDonell M, Nelson L, Buchwald D, Manson S. Early life trauma, post‐traumatic stress disorder, and allostatic load in a sample of American Indian adults. Amer. J. Hum. Biol 29:e22943, 2017 [DOI] [PMC free article] [PubMed] [Google Scholar]
- 141.Tiedt JA, Brown LA. Allostatic load: The relationship between chronic stress and diabetes in Native Americans. Journal of Theory Construction & Testing. 18:22, 2014 [Google Scholar]
- 142.Tishler M, Smorodin T, Vazina-Amit M, Ramot Y, Koffler M, Fishel B. Fibromyalgia in diabetes mellitus. Rheumatol. Int 23:171–173, 2003 [DOI] [PubMed] [Google Scholar]
- 143.Todd KH. Pain assessment and ethnicity. Ann. Emerg. Med 27:421–423, 1996 [DOI] [PubMed] [Google Scholar]
- 144.Toledo TA, Kuhn BL, Payne MF, Lannon EW, Palit S, Sturycz CA, Hellman N, Güereca YM, Demuth MJ, Huber F, Shadlow JO, Rhudy JL. The Effect of Pain Catastrophizing on Endogenous Inhibition of Pain and Spinal Nociception in Native Americans: Results From the Oklahoma Study of Native American Pain Risk. Ann. Behav. Med, 2020 [DOI] [PMC free article] [PubMed] [Google Scholar]
- 145.U.S. Department of Health and Human Services Office of Minority Health: Minority Population Profiles: American Indian/Alaska Native. Available at: https://minorityhealth.hhs.gov/omh/browse.aspx?lvl=3&lvlid=62
- 146.USDHHS: Summary of health statistics for U.S. Adults: National health interview survey, 2009. Series 10: Data from the national health interview servey No. 249.(Services, H.a.H., Ed.), DHHS, Hyattsville, Maryland, 2010. [Google Scholar]
- 147.Vandenberg RJ: Introduction: statistical and methodological myths and urban legends: where, pray tell, did they get this idea?, Sage Publications Sage CA: Thousand Oaks, CA, 2006. [Google Scholar]
- 148.Ware JE, Snow KK, Kosinski M, Gandek B: SF-36 Health Survey manual and interpretation guide, The Health Institute New England Medical Center, Boston, 1993. [Google Scholar]
- 149.Welty TK, Lee ET, Yeh J, Cowan LD, Go O, Fabsitz RR, Le N-A, Oopik AJ, Robbins DC, Howard BV. Cardiovascular disease risk factors among American Indians: the strong heart study. Am. J. Epidemiol 142:269–287, 1995 [DOI] [PubMed] [Google Scholar]
- 150.Whitesell NR, Beals J, Mitchell CM, Manson SM, Turner RJ, Team A-S. Childhood exposure to adversity and risk of substance-use disorder in two American Indian populations: the meditational role of early substance-use initiation. Journal of studies on alcohol and drugs. 70:971–981, 2009 [DOI] [PMC free article] [PubMed] [Google Scholar]
- 151.Wilcox RR: Understanding and applying basic statistical methods using R, John Wiley & Sons, Hoboken, N.J., 2016. [Google Scholar]
- 152.Willer JC, Boureau F, Albe-Fessard D. Supraspinal influences on nociceptive flexion reflex and pain sensation in man. Brain Res. 179:61–68, 1979 [DOI] [PubMed] [Google Scholar]
- 153.Yarnitsky D, Granot M, Granovsky Y. Pain modulation profile and pain therapy: between pro-and antinociception. Pain. 155:663–665, 2014 [DOI] [PubMed] [Google Scholar]
- 154.Yehuda R, Daskalakis NP, Lehrner A, Desarnaud F, Bader HN, Makotkine I, Flory JD, Bierer LM, Meaney MJ. Influences of maternal and paternal PTSD on epigenetic regulation of the glucocorticoid receptor gene in Holocaust survivor offspring. Am. J. Psychiatry 171:872–880, 2014 [DOI] [PMC free article] [PubMed] [Google Scholar]
- 155.Yoo JJ, Cho NH, Lim SH, Kim HA. Relationships between body mass index, fat mass, muscle mass, and musculoskeletal pain in community residents. Arthritis & Rheumatology. 66:3511–3520, 2014 [DOI] [PubMed] [Google Scholar]
- 156.You DS, Creech SK, Vichaya EG, Young EE, Smith JS, Meagher MW. Effect of written emotional disclosure on secondary hyperalgesia in women with trauma history. Psychosom. Med 76:337–346, 2014 [DOI] [PubMed] [Google Scholar]
- 157.You HJ, Dahl Morch C, Chen J, Arendt-Nielsen L. Simultaneous recordings of wind-up of paired spinal dorsal horn nociceptive neuron and nociceptive flexion reflex in rats. Brain Res. 960:235–245, 2003 [DOI] [PubMed] [Google Scholar]
- 158.You HJ, Morch CD, Arendt-Nielsen L. Electrophysiological characterization of facilitated spinal withdrawal reflex to repetitive electrical stimuli and its modulation by central glutamate receptor in spinal anesthetized rats. Brain Res. 1009:110–119, 2004 [DOI] [PubMed] [Google Scholar]
- 159.Zhao Q, Zhu Y, Best LG, Umans JG, Uppal K, Tran VT, Jones DP, Lee ET, Howard BV, Zhao J. Metabolic profiles of obesity in American Indians: the strong heart family study. PLoS One. 11, 2016. [DOI] [PMC free article] [PubMed] [Google Scholar]