Abstract
Introduction:
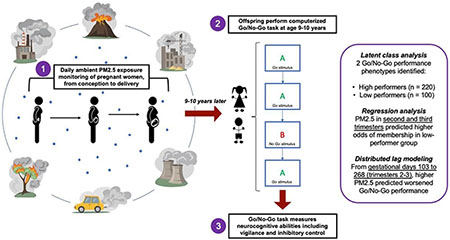
Prenatal exposure to fine particulate matter air pollution (PM2.5) is an important, under-studied risk factor for neurodevelopmental dysfunction. We describe the relationships between prenatal PM2.5 exposure and vigilance and inhibitory control, executive functions related to multiple health outcomes in Mexico City children.
Methods:
We studied 320 children enrolled in Programming Research in Obesity, GRowth, Environment and Social Stressors, a longitudinal birth cohort study in Mexico City. We used a spatio-temporal model to estimate daily prenatal PM2.5 exposure at each participant’s residential address. At age 9-10 years, children performed three Go/No-Go tasks, which measure vigilance and inhibitory control ability. We used Latent class analysis (LCA) to classify performance into subgroups that reflected neurocognitive performance and applied multivariate regression and distributed lag regression modeling (DLM) to test overall and time-dependent associations between prenatal PM2.5 exposure and Go/No-Go performance.
Results:
LCA detected two Go/No-Go phenotypes: high performers (Class 1) and low performers (Class 2). Predicting odds of Class 1 vs Class 2 membership based on prenatal PM2.5 exposure timing, logistic regression modeling showed that average prenatal PM2.5 exposure in the second and third trimesters correlated with increased odds of membership in low-performance Class 2 (OR =1.59 (1.16, 2.17), p=0.004). Additionally, DLM analysis identified a critical window consisting of gestational days 103 to 268 (second and third trimesters) in which prenatal PM2.5 exposure predicted poorer Go/No-Go performance.
Discussion:
Increased prenatal PM2.5 exposure predicted decreased vigilance and inhibitory control at age 9-10 years. These findings highlight the second and third trimesters of gestation as critical windows of PM2.5 exposure for the development of vigilance and inhibitory control in preadolescent children. Because childhood development of vigilance and inhibitory control informs behavior, academic performance, and self-regulation into adulthood, these results may help to describe the relationship of prenatal PM2.5 exposure to long-term health and psychosocial outcomes. The integrative methodology of this study also contributes to a shift towards more holistic analysis.
Keywords: Go/No-Go, air pollution, particulate matter, neurodevelopment, exposure windows, latent class analysis
Graphic Abstract
1. Introduction
Air pollution is a major risk factor for neurocognitive impairment in children that creates enormous social, economic, and healthcare costs worldwide (Lee et al., 2020). In Mexican cities, where the average ambient concentration of fine particulates (PM2.5) is over three times the international guideline value of 10μg/m3 (Molina et al., 2009), over 25% of children suffer from cognitive difficulties (Gaytán Jiménez et al., 2015). Prior literature shows that prenatal PM2.5 exposure is associated with childhood academic and behavioral problems such as ADHD, in which poor impulse control is an important feature of pathology. (Allen et al., 2017; Zhang et al., 2018). However, research addressing the impacts of early-life exposure to air pollution on the development of executive functions—most importantly, vigilance and inhibitory control— is lacking despite its potential to provide insight into neurodevelopmental disorders.
By altering fetal neurodevelopment, PM2.5 exposure in utero may contribute to long-term health, social, and economic disadvantage (Grandjean & Landrigan, 2006; Grandjean & Landrigan, 2014). According to fetal programming theory, toxic insults during gestational windows of rapid cell differentiation may alter organ and tissue formation, inducing somatic phenotypes that predispose to impaired functioning and elevated disease risk (Kwon & Kim, 2017). Therefore, characterizing the role of prenatal PM2.5 exposure in shaping trajectories of childhood neurocognitive phenotypes is a paramount research question for understanding the root causes of maladaptive brain development.
Specifically, PM2.5 exposure in utero may alter brain morphology by increasing oxidative stress and inflammation in the central nervous system (Cowell et al., 2019; Calderón-Garcidueñas et al., 2008; Calderón-Garcidueñas et al., 2011). However, there is limited evidence of how the timing and quantity of prenatal PM2.5 exposures translate into cognitive impairment during middle childhood, a time of critical neurodevelopment (Clifford et al., 2016; Cserbik et al., 2020). One cohort study of 783 Dutch children found that prenatal PM2.5 exposure was associated with changes in cerebral cortex structure and impaired inhibitory control at age 6-10 years (Guxens et al., 2018). The present study uses the Go/No-Go task, a validated, computerized test of inhibitory control through which vigilance, inhibitory control, and information processing abilities are measurable (Eagle et al., 2008).
Current literature primarily analyzes effects of PM2.5 exposure on child cognitive development through regression analyses of individual outcomes. To better understand how PM2.5 exposure simultaneously impacts multiple neurodevelopmental domains and influences children’s ability to perform complex tasks, holistic approaches are needed. In this study, we used latent class analysis (LCA) to identify distinct Go/No-Go task performance phenotypes among children at age 9-10 years. LCA permits detection of higher-order relationships among vigilance, inhibitory control, and information processing abilities, in order to capture how diverse cognitive functions manifest conjointly in children (Eagle et al., 2008). Most importantly, LCA allows us to relate Go/No-Go performance phenotypes to socio-environmental variables, namely PM2.5 exposure.
Although multiple health outcomes are associated with critical windows of prenatal PM2.5 exposure (Cowell et al., 2019; Rosa et al., 2020), few studies report critical windows that predict neurocognitive outcomes by accounting for both timing and quantity of PM2.5 levels across gestation (Chiu et al., 2016). Despite promise of considerable clinical and public health benefit, the identification of vulnerable prenatal periods for brain development is incomplete. Cerebral cortex cellularity is thought to increase most rapidly between gestational weeks 15 and 20 (Ackerman, 1992), yet fetal defenses against PM2.5 neurotoxicity-- such as the blood brain barrier and hepatic detoxification-- develop heterogeneously across trimesters (Goasdoué et al., 2017; Giancotti et al., 2019). To understand the role of exposure timing on child neurodevelopment, we applied distributed lag models (DLMs) to characterize associations between daily prenatal PM2.5 levels and cognitive performance on the Go/No-Go task.
In summary, this longitudinal cohort study describes relationships between outdoor prenatal PM2.5 exposure and neurocognitive function at age 9-10 years, based on Go/No-Go task performance. By combining latent class analysis and distributed lag modeling, we present a novel analytical paradigm to study the associations linking PM2.5 exposure quantity and timing to neurocognitive metrics of the Go/No-Go task.
2. Materials & Methods
2.1. Study population
From July 2007 to February 2011, pregnant women receiving prenatal care through the Mexican Social Security System (IMSS) living in Mexico City were recruited into the Programming Research in Obesity, GRowth, Environment and Social Stressors (PROGRESS) birth cohort study in Mexico City (Rosa et al., 2016). IMSS provides healthcare for predominantly low- to middle-income working-class families. Women were recruited if they were at least 18 years old, less than 20 weeks pregnant at enrollment time, and had completed primary education. Other inclusion/exclusion criteria and recruitment procedures have been described previously in detail (Braun et al., 2014).
A total of 948 pregnant women who delivered a live birth were enrolled in PROGRESS and their children were followed after delivery, with 67% retention by child age 8-10 years (81% retention after the first postpartum year). More specifically, longitudinal data were collected for 634 mother-child pairs, from which 534 children fully completed the administered Go/No-Go tasks at age 8-10 years. Given that most families in the study cohort lacked internet and automobile access, this retention rate is consistent with previous longitudinal studies of hard-to-reach populations (Booker et al., 2011). There were no significant differences in PM2.5 exposure between the full cohort of 948 mother-child pairs and the 534 pairs for which Go/No-Go tasks were fully completed (first trimester: p = 0.678; second trimester: p = 0.323; third trimester: p = 0.760; first postpartum year: p = 0.632).
Based on preliminary data from the geospatial PM2.5 exposure model (described in Section 2.2), it is important to be mindful of potential confounding from changing pollution exposures after the shutdown of multiple factories in the study recruitment area beginning in 2009, due to the global economic recession in Mexico City (Villarreal, 2010; Sidaoui et al., 2010). For this reason, we restricted our analysis to mother-child dyads in which children were conceived on or before December 31, 2008 and therefore aged 9.00 to 10.99 years at the time of Go/No-Go task administration. Dyads in which children were conceived on or after January 1, 2009 were excluded from these analyses. In total, this study includes 320 children who completed the Go/No-Go task and had complete data on relevant covariates (described below).
Procedures were approved by institutional review boards at Harvard School of Public Health, Icahn School of Medicine at Mount Sinai, and the Mexican National Institute of Public Health. Women provided written informed consent in Spanish.
2.2. Prenatal PM2.5 exposure levels
We used a spatio-temporal model that incorporates Moderate Resolution Imaging Spectroradiometer satellite-derived Aerosol Optical Depth (AOD) measurements at a spatial resolution of 1 × 1 km2 described in detail in (Just et al., 2015). We layered this remote sensing data with traditional land-use regression predictors and a spatial smoothing technique to yield residence-specific estimates of PM2.5 exposure and a corresponding unique daily estimate of PM2.5 exposure for each participant. Overall, the model showed strong out-of-sample cross-validation (R2=0.724), which was calculated by excluding one monitor at a time to predict daily PM2.5 levels (including days when satellite data was unavailable) (Just et al., 2015). The model also has been externally validated and widely used (Huang et al., 2021; Wolffe et al., 2021; Zhang et al., 2021). Beginning at estimated date of conception, daily PM2.5 exposure levels were measured for all participants based on their residential address, which was tagged with a GPS device during each visit. Notably, most families in the study cohort lacked consistent automobile access, so all day-to-day activity is likely to have been confined to areas and environments around the home. Therefore, even on days when pregnant mothers may have been at work, their place of work would likely have been in nearby areas with similar exposures to pollutants. All participants were transported to and from their residential address by car for study visits.
2.3. Go/No-Go task
As part of the study follow-up visit, participants aged 8-10 years completed a computerized Go/No-Go task (Casey et al., 1997; Tottenham et al., 2011) to measure vigilance, inhibitory control, and information processing (Eagle et al., 2008). Stimuli were presented using E-Prime version 3 (Psychology Software Tools, Pittsburgh, PA). The task required participants to press the spacebar as quickly as possible when “go” stimuli were presented and to withhold response when “no-go” stimuli were presented. Three conditions for measuring the neurocognitive domains were administered (Figure 1): 1) Letter, for neutral, non-emotional context (the letter X served as the no-go stimulus and all other letters served as go stimuli); 2) Happy, for emotional context (happy faces of peers served as go stimuli and neutral faces of peers were the no-go stimuli); 3) Neutral, also for emotional context (neutral faces of peers served as go stimuli and happy faces of peers were the no-go stimuli). Faces used in conditions 2 and 3 were selected from the NIMH Child Emotional Faces Picture Set (NIMH-ChEFS) to match participant age and ethnicity (Egger et al., 2011).
Figure 1.
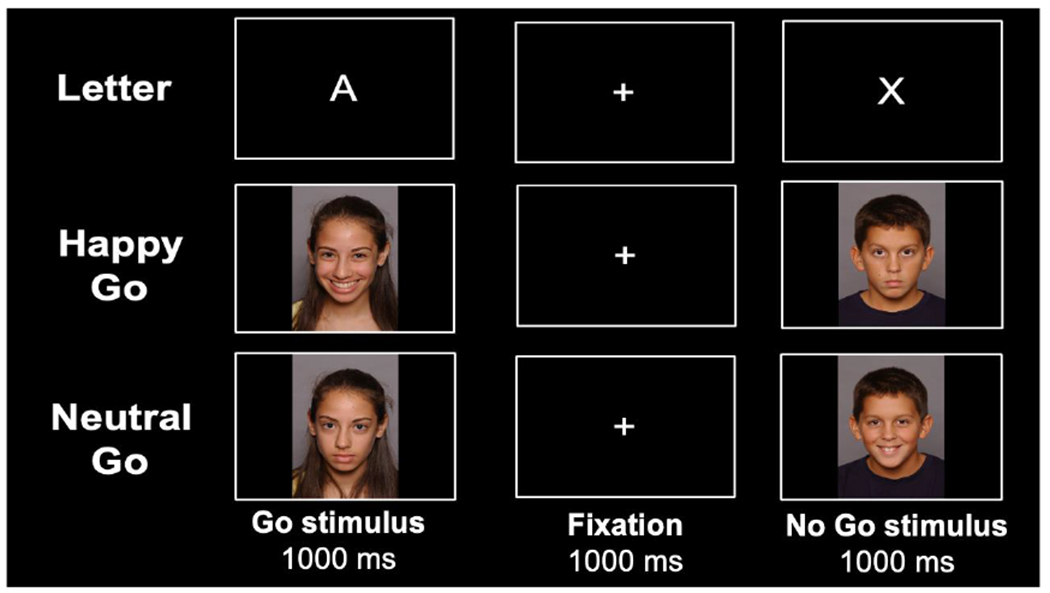
Trial procedure of the Go/No-Go task.
In each of the three task conditions, 96 stimuli were presented (72 go stimuli and 24 no-go stimuli) in a pseudorandom order, such that no more than 2 no-go stimuli were presented in a row. This procedure is presented in Figure 1. In addition, 10 practice trials were administered before the start of each of the three task conditions. Before task administration, participants were also shown all faces used in the Happy and Neutral conditions and were asked to label the displayed emotion. Incorrect responses were corrected by the psychologist who administered the task.
Go/No-Go outcome measures include: false alarm rate (the number of presses when presented with a no-go stimulus divided by the total number of no-go stimuli; FAR), hit rate (the number of presses when presented with a go stimulus divided by the total number of go stimuli; HR), the mean response time (MRT), and the standard deviation of the response time (SDRT). Results of these analyses reflect impulse control and vigilance. For example, lower HR and higher SDRT suggest poorer vigilance while higher FAR suggests poorer inhibitory control. Lower FAR, higher HR, lower MRT, and lower SDRT indicate stronger performance. In total, there are 3 Go/No Go task conditions (Letter, Happy, and Neutral) and 4 outcome measures (FAR, HR, MRT, and SRDT) resulting in 12 Go/No Go outcomes.
2.4. Covariates
Covariates were selected based on previous neurobehavioral literature including prior PROGRESS studies (Aris et al., 2019; McGuinn et al., 2020). Biological sex, age at assessment, birth weight, and gestational age at birth of child participants were included as covariates. Date of conception and gestational age at birth were estimated from the date of last menstrual period (LMP) and a standardized physical examination of the newborn. Ultrasounds are not readily available for prenatal care in Mexico City, so gestational age at birth determined by physical examination was used when the two methods (LMP and physical examination) indicated ages differing by more than 3 weeks (Rosa et al., 2020).
Additionally, questionnaires administered at enrollment collected information on socioeconomic status (Carrasco, 2002), maternal age, maternal education level, maternal smoking, and secondhand household tobacco exposure (reported at third-trimester follow-up and 3-months postpartum), which were likewise included as covariates. Season of conception was considered to account for exposure seasonality and defined as: dry cold (November–February), dry warm (March–April), or rainy (May–October). Finally, maternal blood lead levels obtained by serologic analysis during the second and third trimesters (Braun et al., 2014) were taken into account.
2.5. Statistical analysis
We first assessed univariate descriptive statistics and bivariate associations to explore distributions of variables and their relationships to one another. We then applied latent class analysis to detect functional groupings among participants based on Go/No-Go outcomes. We also modeled associations of prenatal PM2.5 exposure (measured cumulatively and in daily intervals) to Go/No-Go performance using linear and logistic regression and distributed lag modeling. All analyses were performed using R version 4.0.1 (R Core Team, Vienna, Austria, 2018). Details on these procedures follow.
2.5.1. Latent class analysis
Latent class analysis (LCA) is a statistical approach to identify group membership in the outcome of a study population outcome. LCA can define discrete, unobserved subgroups within a population that share similar performance phenotypes and was used to address Go/No-Go performance to both reduce dimensionality of the 12 Go/No-Go outcome measures, which consisted of four primary Go/No-Go outcomes (FAR, HR, MRT, and SDRT) for each of three task conditions (Happy, Neutral, and Letter). LCA also enabled characterization of overall participant performance into discrete categories for regression analysis. Participants were classified to a particular latent class if they shared a similar pattern of FAR, HR, MRT, and SDRT results relative to participants in the assigned latent class and a unique pattern relative to participants in other latent classes. The ideal number of latent classes was determined via Bayesian Information Criteria (BIC) adjusted for sample size to maximize intraclass homogeneity and interclass heterogeneity on measured variables (Keribin, 1998). LCA was implemented using normal mixture modeling fitted via VVE algorithm for model-based clustering in the Mclust package in R.
2.5.2. Multivariable linear and logistic regression
Based on the LCA results, we used linear regression to characterize associations between prenatal PM2.5 exposure (trimester and whole pregnancy averages), as well as average postnatal exposure during the first year of life, with performance on Go/No-Go task outcomes. Logistic regression examined the relationship of trimester average prenatal PM2.5 exposure to LCA results describing overall Go/No-Go performance (membership in high-performance Class 1 versus low-performance Class 2). Models were adjusted for all covariates reported in Section 2.4. as well as average first-year postnatal PM2.5 exposure.
2.5.3. Distributed lag modeling
To identify important prenatal time points (critical windows of exposure) for the association of daily prenatal PM2.5 exposure to child Go/No-Go task performance at age 9-10 years, we used distributed lag regression models (DLMs). In these models, a time-varying predictor is regressed against a dependent variable based on both the predictor’s cross-sectional value and the lagged (past) values of the predictor variable. DLMs create an exposure lag space to account for the magnitude and timing of all average daily PM2.5 exposures as well as correlations between average exposure levels on different days (Gasparrini et al., 2010).
We fit linear DLMs described as: , where APij is the estimated average PM2.5 level on day j of pregnancy and x1i, …, xpi, represent covariates for subject i. Because collinearity among daily pollution averages can confound estimated day-specific effects of prenatal PM2.5 exposures, we fit constrained DLMs with the assumptions outlined in (Gasparrini 2011; Gasparrini et al., 2010).
3. Results
3.1. Participant characteristics
Of the 543 subjects evaluated for the Go/No Go task, 320 were between 9-10 years old and had complete covariate data. A description of the cohort is included in Table 1. No systematic differences occurred along any covariate, except child age, between mother-child pairs included in these analyses versus the full PROGRESS cohort. Table 1 describes cohort characteristics including demographics, prenatal PM2.5 exposure, and child performance on Go/No-Go tasks (Happy, Neutral, and Letter) stratified by sex.
Table 1.
Characteristics of participating mother-child pairs from the Programming Research in Obesity, Growth, Environment, and Social Stressors (PROGRESS) study in Mexico City.
|
|
|||
|---|---|---|---|
| Characteristics | PROGRESS Cohort (n = 543) | Subset Included in Analysis (n = 320) | p-value |
| Demographics, Median (IQR) | |||
| Child Age, years | 9.67 (9.27-10.27) | 10.03 (9.67-10.37) | < 0.001 |
| Maternal Age at Birth, years | 28 (24-32) | 28 (23-32) | 0.96 |
| Maternal IQ* | 86 (76-94) | 84 (74-93) | 0.13 |
| Maternal BMI | 28.11 (25.5-31.7) | 27.97 (25.31-31.21) | 0.46 |
| Socioeconomic Status, n (%) | 0.996 | ||
| Low | 290 (53) | 169 (53) | |
| Medium | 199 (37) | 121 (38) | |
| High | 54 (10) | 30 (9) | |
| Maternal Education, n (%) | 0.92 | ||
| Low | 225 (41) | 130 (41) | |
| Medium | 196 (36) | 119 (37) | |
| High | 122 (22) | 71 (22) | |
| Average Daily PM2.5 Exposure (μg/m3), Median (IQR) | |||
| Whole Pregnancy | 22.81(20.75-24.18) | 23.63(22.74-24.77) | < 0.001 |
| 1st Trimester | 21.89(19.13-25.82) | 24.19(19.62-27.95) | < 0.001 |
| 2nd Trimester | 21.1(18.96-25.45) | 22.94(19.69-26.71) | < 0.001 |
| 3rd Trimester | 22.4(18.97-27.53) | 25.08(20.19-28.64) | < 0.001 |
| 1st Postpartum Year | 22.71(20.41-23.80) | 22.63(20.02-24.04) | 0.95 |
| Go/No-Go Task Performance, Median (IQR) | |||
| Happy | |||
| False Alarm Rate, % | 21 (12-29) | 17 (8-29) | 0.46 |
| Hit Rate, % | 93 (89-97) | 94 (89-99) | 0.24 |
| Reaction Time (ms) | 571.3 (526.8-616.1) | 583.2 (535.7-632.2) | 0.07 |
| Reaction Time SD (ms) | 165.9 (138.9-223.6) | 147.7 (129.8-168.6) | < 0.001 |
| Neutral | |||
| False Alarm Rate, % | 21 (12-29) | 21 (12-33) | 0.98 |
| Hit Rate, % | 92 (86-96) | 93 (88-97) | 0.26 |
| Reaction Time (ms) | 572.3 (531.3-620.7) | 591.3 (545.6-649) | 0.003 |
| Reaction Time SD (ms) | 171.9 (140.7-234.9) | 149.9 (130.3-173.7) | < 0.001 |
| Letter | |||
| False Alarm Rate, % | 21 (12-33) | 21 (12-33) | 0.47 |
| Hit Rate, % | 97 (93-99) | 97 (94-99) | 0.09 |
| Reaction Time (ms) | 498.1 (455.4-536.8) | 501.4 (455.4-543.4) | 0.46 |
| Reaction Time SD (ms) | 148.7 (124.4-184.8) | 136.8 (116.7-161.7) | < 0.001 |
The Spanish version of the Wechsler’s Adult Intelligence Scale-III was administered. Results are similar to other Latin American populations with similar levels of education (Sierra Sanjurjo et al., 2015).
3.2. Latent class analysis
3.2.1. Model selection & interpretation
After testing models of two to six latent classes against standard model fit criteria, a two-class solution that minimized BIC was selected. Figure 2 presents standardized mean values for all outcomes of the Happy, Neutral, and Letter Go/No-Go tasks for the two identified latent classes, Class 1 (n = 220) and Class 2 (n = 100). Figure 3 presents absolute scores on measured Go/No-Go outcomes (HR, FAR, MRT, SDRT) by latent class.
Figure 2.
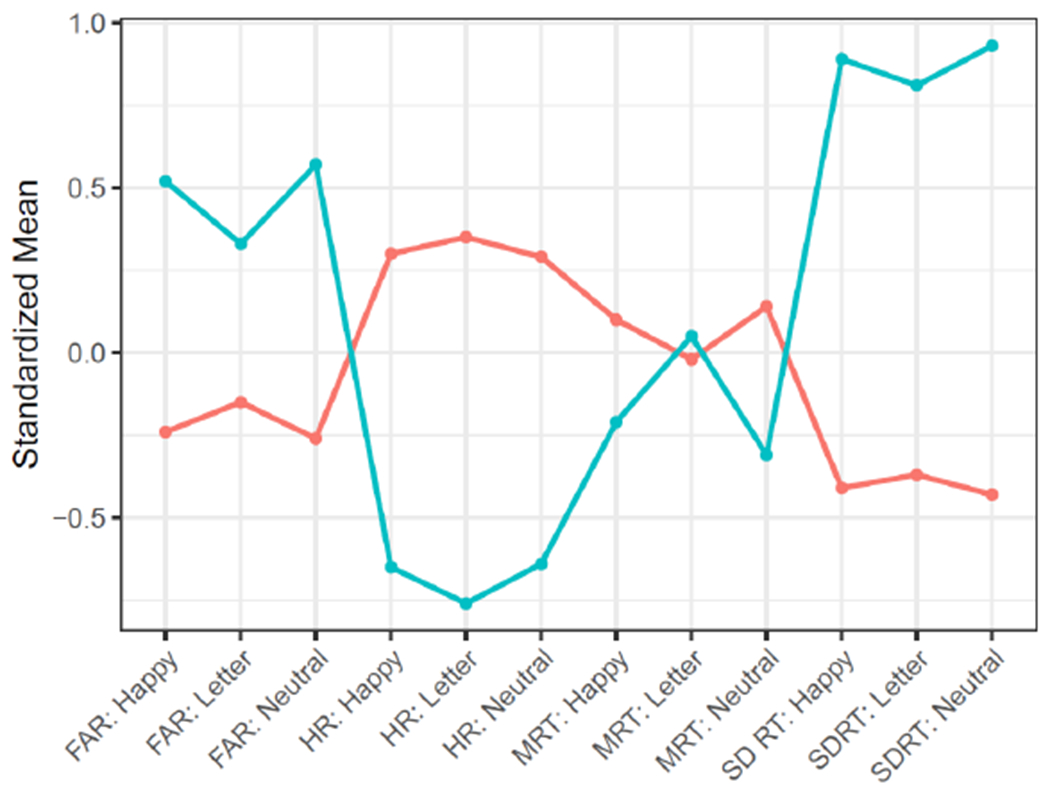
Latent class analysis (LCA) of child Go/No-Go performance at age 9-10 years. Orange: Class 1 (high performance; n = 220). Blue: Class 2 (low performance; n = 100).
Figure 3.
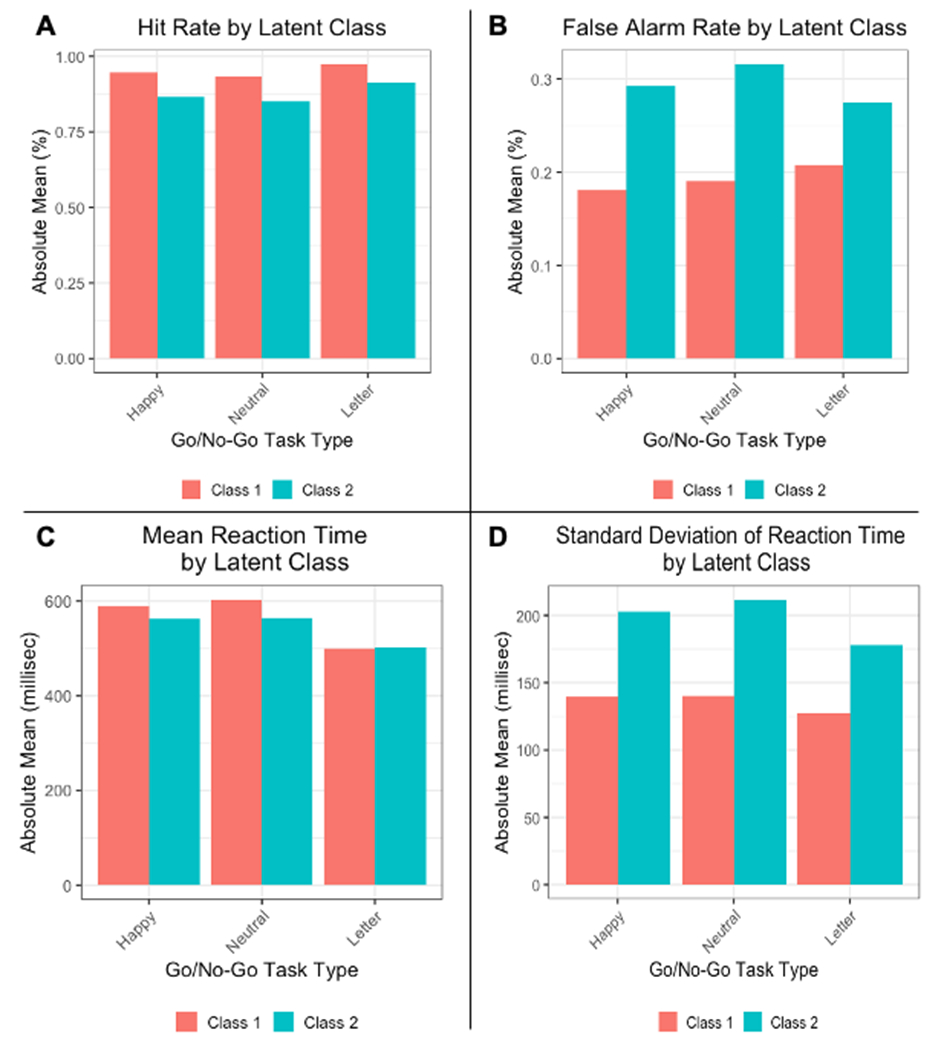
Child Go/No-Go task performance by latent class. A) Hit rate (HR); B) False alarm rate (FAR); C) Mean reaction time (MRT); D) Standard deviation of reaction time (SDRT). Orange: Class 1 (high performance; n = 220). Blue: Class 2 (low performance; n = 100).
For all Go/No-Go task conditions, comparisons of mean SDRT, HR, and FAR between Class 1 and Class 2 were highly significant (Table 2), with Class 1 obtaining significantly more favorable performance than Class 2. Since Class 1 demonstrated consistently lower FAR, higher HR, and lower SDRT than Class 2, Class 1 was designated the high-performance reference group and Class 2 was termed the low-performance group. Of note, Class 1 vs Class 2 comparisons of mean MRT were significant for the Happy and Neutral tasks, with Class 1 participants recording slightly longer mean reaction times than Class 2 participants, but were not significantly different for the Letter task. Importantly, no covariates were statistically different between Class 1 and Class 2 participants.
Table 2.
Comparisons of mean Go/No-Go outcome score between Class 1 (high performance) and Class 2 (low performance)
| Mean (SD) | |||
|---|---|---|---|
|
|
|||
| False Alarm Rate (FAR) | Class 1 | Class 2 | p-value |
| Happy | 0.18 (0.12) | 0.29 (0.18) | < 1.0 x 10⁻⁵ |
| Neutral | 0.19 (0.11) | 0.32 (0.18) | < 1.0 x 10⁻⁵ |
| Letter | 0.21 (0.13) | 0.28 (0.15) | 1.3 x 10⁻⁴ |
| Hit Rate (HR) | |||
| Happy | 0.95 (0.04) | 0.86 (0.12) | < 1.0 x 10⁻⁵ |
| Neutral | 0.94 (0.05) | 0.85 (0.12) | < 1.0 x 10⁻⁵ |
| Letter | 0.97 (0.02) | 0.91 (0.07) | < 1.0 x 10⁻⁵ |
| Mean Reaction Time, ms | |||
| Happy | 588.29 (71.99) | 562.12 (80.19) | 0.027 |
| Neutral | 603.43 (70.17) | 564.70 (84.88) | 7.7 x 10⁻⁵ |
| Letter | 500.02 (69.30) | 502.70 (75.37) | 0.97 |
| Standard Deviation of Reaction Time, ms | |||
| Happy | 139.75 (22.83) | 203.09 (60.41) | < 1.0 x 10⁻⁵ |
| Neutral | 140.22 (21.66) | 211.70 (63.06) | < 1.0 x −5 |
| Letter | 127.59 (24.68) | 178.05 (50.61) | < 1.0 x 10⁻⁵ |
Performance parameters of Class 1 (high performance; n = 220) and Class 2 (low performance; n = 100) participants on three Go/No-Go tasks: Happy, Neutral, and Letter, p values reflect Wilcoxon t-test of Class 1 vs Class 2 sample means.
3.2.2. Prenatal PM2.5 and Go/No-Go latent class membership
Multivariate logistic regression analysis using the above LCA results to define Go/No Go performance showed that increased average PM2.5 exposure in each prenatal trimester was associated with significantly increased odds of membership in the low-performing Class 2 (first trimester: OR=1.34 (1.12-1.59), p=0.001; second trimester: OR=1.14, (1.01-1.28) p=0.03; third trimester: OR=1.36 (1.14-1.62), p<0.001) at age 9-10 years. Importantly, no covariates significantly confounded the relationship between trimester PM2.5 exposures and latent class membership. These results are summarized in Table 3.
Table 3.
Odds ratio of membership in Class 2 (low Go/No-Go task performance) versus Class 1 (high Go/No-Go task performance), based on average prenatal PM2.5 exposure over particular gestational timepoints
| Gestational Timepoint | Odds Ratio | 95: CI: Lower Bound | 95% CI: Upper Bound | p value |
|---|---|---|---|---|
| Trimester 1 | 1.34 | 1.12 | 1.59 | 0.001 |
| Trimester 2 | 1.14 | 1.01 | 1.28 | 0.03 |
| Trimester 3 | 1.36 | 1.14 | 1.62 | <0.001 |
| Days 103-268 (critical window) | 1.59 | 1.16 | 2.17 | 0.004 |
3.3. Distributed lag modeling
3.3.1. Predicting latent class membership based on prenatal exposure timing
Figure 4 represents the relationship of daily prenatal PM2.5 exposure from conception to 43 weeks post-conception, the most advanced gestational age of any participant, to membership in Class 1 (high performance) vs Class 2 (low performance). A critical window for prenatal PM2.5 exposure was identified as gestational days 103-268 (gestational weeks 14.7-38.3). In conjunction with the multivariate logistic regression of latent class membership (Section 3.2.2), this result suggests that increased PM2.5 exposures from the second and third trimesters predict higher odds of membership in Class 2 relative to Class 1.
Figure 4.
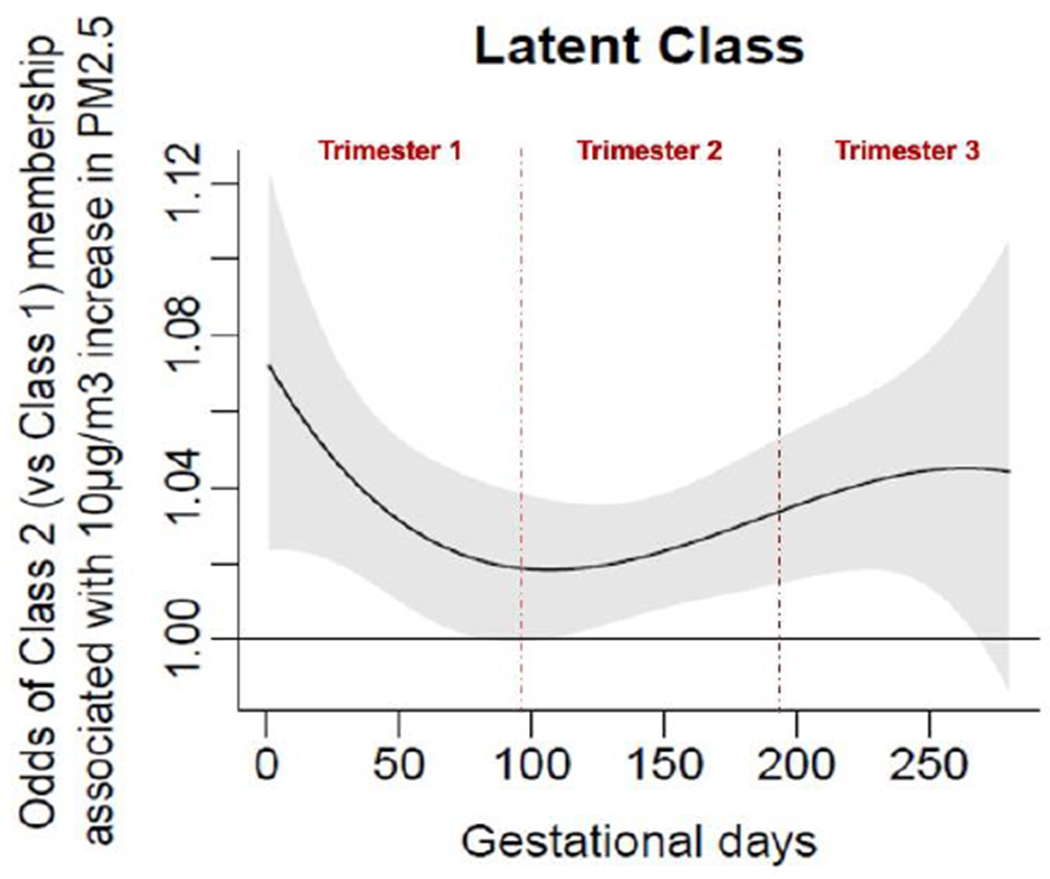
Associations of daily prenatal PM2.5 levels to odds ratio of membership in Class 2 (vs Class 1. Class 1 = High Performance (Reference) Group. Class 2 = Low Performance Group. X-axis represents days of gestation and y-axis shows changes in odds of Class 2 membership (relative to Class 1) associated with a 10μg/m3 increase in PM2.5 exposure. Black lines graph the expected change in odds of Class 2 membership at each day of gestation; gray shadings show pointwise 95% CIs. A critical window (CW) is defined as a range of days over which the 95% CI excludes zero.
3.3.2. Predicting Go/No-Go SDRT based on prenatal exposure timing
We also used DLMs to explore the effects of prenatal exposure timing on individual Go/No-Go task parameters, controlling for all covariates. For the SDRT parameter, we observed the following CWs of prenatal PM2.5 exposure for each Go/No-Go task condition (higher SDRT indicates increased response time variability and worsened vigilance):
Happy: Gestational days 135 to 265 (gestational weeks 19.3-37.9). This suggests increased PM2.5 exposures from middle second trimester to middle-late third trimester predict increased Happy SDRT, indicating decreased vigilance.
Neutral: Gestational days 118 to 247 (gestational weeks 16.9-35.3). This suggests increased PM2.5 exposures from early-middle second trimester to late third trimester predict increased Neutral SDRT, indicating decreased vigilance.
Letter: Gestational days 6 to 259 (gestational weeks 0.9-37). This suggests increased PM2.5 exposures from early first trimester to late third trimester predict increased Letter SDRT, indicating decreased vigilance.
3.3.3. Regression modeling
As a robustness check, multivariable linear regression models were fit to predict Happy, Neutral, and Letter Go/No-Go task SDRT, based on average PM2.5 exposure level across the respective CWs (Figure 5) and stated covariates. Again, average PM2.5 exposure across the CW was significantly associated with increased Go/No-Go SDRT for all three stimulus types (Happy: Bcw = 2.61 (0.62-4.60) ms, p=0.01; Neutral: Bcw = 2.52 (0.52-4.52) ms, p=0.015; Letter: Bcw = 2.51 (1.74-4.85) ms, p=0.003).
Figure 5.
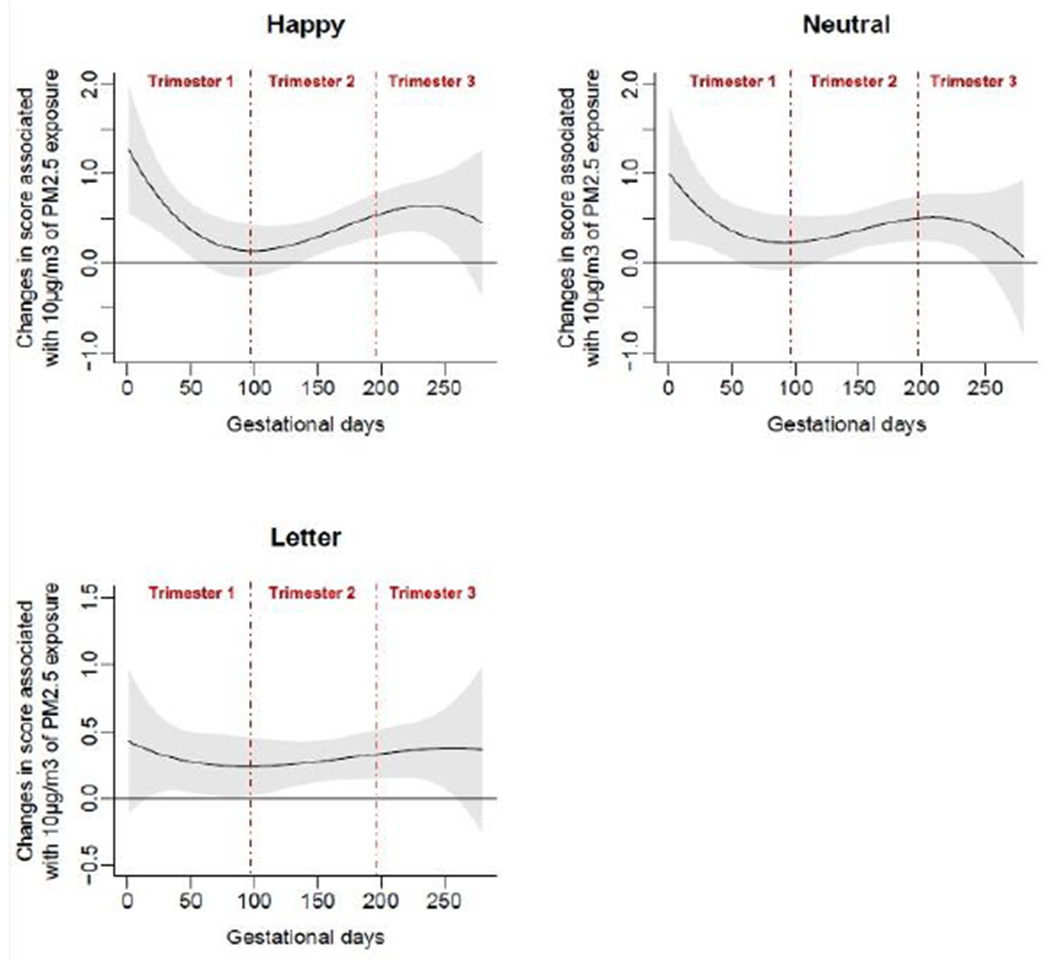
Associations of daily prenatal PM2.5 levels to mean standard deviation of reaction time (SDRT) on three Go/No-Go tasks: Happy, Neutral, and Letter.
Furthermore, we performed multivariate logistic regression modeling to predict class 1 vs class 2 membership based on average PM2.5 exposure across the identified CW (Figure 4) and stated covariates. This result (OR =1.59 (1.16, 2.17), p=0.004) further corroborates the latent classes described in Section 3.2.1. These results are summarized in Table 3.
3.3.4. Sensitivity analysis
Multiple sensitivity analyses were conducted to consider the effects of specific covariates on identified CWs. First, we re-modelled associations between prenatal PM2.5 exposures across gestation and Go/No-Go parameters without controlling for postnatal PM2.5 exposure level; the magnitude and direction of SDRT associations did not change. No new associations between Go/No-Go parameters and prenatal PM2.5 exposure were detected.
Since prenatal lead exposure has been correlated with adverse neurodevelopmental outcomes in childhood (Fruh et al., 2019), we also re-modelled associations between prenatal PM2.5 exposure and Go/No-Go parameters while adjusting for maternal blood lead levels in the second and third trimesters. The magnitude and direction of SDRT associations continued to remain the same, and no new associations were detected (Appendix, Figures A1–A2).
Because maternal smoking and household tobacco exposure data were not available for some participants, all DLMs and regression models were re-fitted without adjusting for these covariates. Results were very similar to those described above (Appendix, Figures A3–A4). Finally, we explored effect modification by sex. Sex-stratified analyses yielded results closely resembling those of the full cohort for both male and female children (Appendix, Figure A5).
Discussion
In this prospective longitudinal study, increased prenatal PM2.5 exposure in the second and third trimesters of gestation predicted diminished child inhibitory control and vigilance in middle childhood (age 9-10 years). Based on neurocognitive outcomes derived from the Go/No-Go task, LCA revealed a two-class solution separating high performers (Class 1) from low performers (Class 2). This result supports current literature in which heterogeneous neurocognitive phenotypes have been observed among children at age 9-10 years (Heeren et al., 2017). Notably, the grouping of children aged 9-10 years as neurodevelopmentally comparable to one another yet different from children of other ages is highly consistent with existing literature (Farber & Petrenko, 2012; Artuso & Palladino, 2019; Zhan et al., 2020).
The FAR, HR, and SDRT parameters of the Go/No-Go task revealed highly significant differences in neurocognitive performance between Class 1 and Class 2. The Go/No-Go task integrates vigilance, inhibitory control, and information processing abilities, all of which can be measured during middle childhood (Bunge et al., 2002; Diaz et al., 2018; Karbach & Unger, 2014). Because Class 1 children outperformed Class 2 children on the Happy, Neutral, and Letter Go/No-Go tasks, our results suggest that inter-class cognitive differences may exist in response to both neutral and emotionally salient stimuli (Bunge et al., 2002; Schulz et al., 2007, Cohen et al., 2012).
In the Go/No-Go task, increased FAR indicates lower levels of inhibitory control, or the ability to repress impulsive and unreasoned behaviors. Along with working memory and flexible thinking, inhibitory control is one of the executive functions, a set of high-level mental skills that develop throughout childhood and coordinate cognition, emotion, and behavior (Diamond, 2013). Executive functions are associated with long-term health, social wellbeing, educational attainment, and economic productivity because they enable motivation, concentration, reasoned behavior, appropriate response to novel stimuli, and resolution of unanticipated challenges and unfamiliar situations (Moffitt et al., 2011; Moffitt, 2012). By demonstrating that Class 2 children with increased FAR were exposed to higher levels of prenatal PM2.5, our data support the hypothesis that early-life PM2.5 exposure longitudinally impacts the development of executive functions— specifically inhibitory control— at age 9-10 years, a time when executive functions are more highly expressed and thus more easily measurable in comparison to early childhood (Davidson et al., 2006; Diamond, 2013; Luna et al., 2004; Luna, 2009).
Furthermore, increased Go/No-Go SDRT (response time variability) reflects reduced vigilance, which is defined as the ability to maintain attention over time and has been linked to ADHD (Lewis et al., 2017). Consistent with our findings, increased third-trimester PM2.5 exposure has been linked to reduced corpus callosum volume— a classic finding of ADHD— at age 8-12 years (Mortamais et al., 2019). Given our findings, we propose that PM2.5 exposure at critical prenatal time points may increase the risk of childhood attention problems. However, additional research examining biomarker and cellular responses to air pollution is warranted both to corroborate these results and to elucidate mechanisms of action.
In addition, increased MRT suggests slower information processing speed, a lower-level cognitive function. Class 1 subjects have significantly lower FAR, lower SDRT, and higher HR than Class 2 subjects across task conditions, whereas MRT did not always differ between the two classes. Thus, our findings support existing evidence that higher-order functions related to attention deficit (such as vigilance and inhibitory control) are preferentially impacted by prenatal PM2.5 exposure (de Prado Bert et al., 2018; Herting et al., 2019).
Next, we note that our distributed lag analysis to predict Class 1 vs Class 2 membership based on daily prenatal PM2.5 exposures revealed a critical window from gestational days 103 to 268— a period encompassing the second and third trimesters. This finding aligns with prior literature that highlights the second and third trimesters as vulnerable timepoints for air pollution exposure particularly with respect to autism, a disorder in which executive functions such as inhibitory control are frequently impaired (Jiang et al., 2014; Kalkbrenner et al.; 2015; Raz et al., 2015). Notably, short- and long- range functional connectivity between brain regions develops in the latter half of gestation, with short-range connections displaying most rapid gains in the early third trimester (Jakab et al., 2014). While replication and validation of these findings are needed, the second to third trimester window may represent a life stage at which targeted public health interventions to reduce PM2.5 exposure yields greatest benefit.
Combining LCA and DLMs contributes to the emerging precedent of analyzing health effects of air pollution in more integrative ways. Integrative data approaches are crucial to understanding the full impacts of exposure timing and the summation of cognitive domains into complex tasks such as Go/No-Go. While individual regressions between prenatal PM2.5 exposure and FAR, HR, and MRT did not display significant critical windows for any Go/No-Go task type, applying LCA and DLMs allowed us to identify disparities in Go/No-Go performance as well as exposure timing effects that were undetectable when analyzing these individual outcomes in isolation. This result argues against using a siloed approach to understand effects of exposure quantity and timing on neurocognitive parameters; research that attributes critical windows to individual cognitive functions without assessing overall phenotypes of cognitive performance may underestimate the interconnectedness of diverse areas of cognition in relation to environmental determinants. Our study applies an accessible methodology in which multiple cognitive outcome variables are combined to detect interrelationships between child vigilance, inhibitory control, and information processing abilities.
Additionally, because prenatal and postnatal PM2.5 exposures are correlated, it is important to parse out their differential effects. Statistical significance of prenatal exposures can dissipate after controlling for postnatal PM2.5 exposure (Bellinger, 2013), so postnatal exposure data were routinely included as covariates to discern prenatal exposures’ partial effects. All findings were robust to controls for postnatal conditions, and postnatal conditions themselves were not significantly associated with neurocognitive phenotypes. This result is reasonable, considering that prenatal conditions guide the earliest neurodevelopmental stages (Konkel, 2018) and that toxin clearance mechanisms of the central nervous system continue to develop postnatally (Rodier, 1995).
With regards to mechanism, prenatal exposure to air pollutants like PM2.5 may impact Go/No-Go task performance by inducing a hyperinflammatory state in the developing brain. Although multiple mechanisms likely contribute to toxin-elicited disruption of fetal development, current evidence suggests that PM2.5 exposures are associated with oxidative stress and inflammation in the fetal central nervous system (Costa et al., 2020; Allen et al., 2017; Costa et al., 2017; Calderón-Garcidueñas et al., 2008). For instance, environmental insults that coincide temporally with vulnerable stages of brain development may trigger increased inflammation (Block & Calderón-Garcidueñas, 2009), thereby disrupting specific sequences of development that impact downstream cell and tissue maturation (Jansson & Powell, 2007; Calderón-Garcidueñas et al., 2008). Our longitudinal findings lend support to the hypothesis that air pollution exposure at sensitive prenatal timepoints may override normal growth trajectories towards long-lasting, maladaptive neurobehavioral phenotypes that manifest as compromised executive functioning later in life (Calderón-Garcidueñas et al., 2014; Calderón-Garcidueñas et al., 2013). Indeed, a growing body of literature suggests that the prenatal and perinatal periods may be the most sensitive time periods in which pro-inflammatory exposures are linked to adverse neurobehavioral phenotypes such as learning disabilities and psychopathologies in later childhood and adulthood (Girchenko et al., 2020; Gumusoglu & Stevens, 2019; Goeden et al., 2016). While we found evidence for critical windows of PM2.5 exposure that affect inhibitory control and vigilance, additional studies are needed to replicate these findings and to better elucidate the pathophysiologic mechanisms driving them.
Our study benefits from numerous strengths, including high spatial resolution of PM2.5 exposure measurements that cover every day of gestation and longitudinal covariate data and phenotype data spanning conception to middle childhood. Since cross-sectional studies cannot address longitudinal health effects of prenatal air pollution exposure, prospective studies such as the Programing Research in Obesity, Growth, Environment and Social Stress (PROGRESS) study in Mexico City offer an important opportunity to better understand fetal programming of executive functions. Relatedly, another strength of our study is its emphasis on methods that address life-stage effects, such as DLM for critical exposure windows. Regarding health equity, our study emphasizes the experiences of working-class women and children in a middle-income country, who are disproportionately exposed to neurotoxic environmental exposures (Catalán-Vázquez et al., 2009; Xu et al., 2016). While our results may not translate well to developed countries with lower levels of air pollution, levels of air pollution in Mexico City are similar to some large urban areas in the United States such as Los Angeles.
We also recognize potential limitations, such as residual confounding from unmeasured factors. While prioritizing working-class women and children is important for health equity, it also reduces data variability on covariates of maternal education and socioeconomic status. Prenatal smoking was also very infrequent within our cohort (less than one percent of participating women reported smoking in pregnancy), thereby limiting our ability to measure the hypothesized neurocognitive risk factor of active prenatal tobacco exposure (Holz et al., 2014). We further acknowledge that ambient outdoor PM2.5 concentration using residential address only approximates true exposure and cannot fully account for time pregnant women spent indoors or away from home. Although the practice of keeping household windows open is custom in Mexico City, thereby allowing for equilibration of indoor and outdoor PM2.5 concentrations, additional indoor sources of PM2.5 such as cooking appliances may contribute to true PM2.5 exposure (Estévez-García et al., 2020; Vallejo et al., 2004). A related limitation of our study is the lack of data on whether mothers were working during pregnancy and the difficulty of pinpointing occupational pollution exposures due to varied work environments. However, as noted previously, it is likely that the majority of mothers remained at home while pregnant and those that continued working remained in areas with similar pollution levels to their homes. In future research, applying our methodology to predict child educational, health, and psychosocial outcomes may provide a deeper understanding of the trajectory-shaping impacts of prenatal PM2.5 exposure.
In conclusion, this study demonstrates significant association between prenatal PM2.5 exposure and neurocognitive functions such as inhibitory control in Mexico City children at age 9-10 years. Combining distributed lag modeling and latent class analysis, we found that increased PM2.5 exposure in gestational weeks 14.7 to 38.3 (second and third trimesters) predicted lower performance on the Go/No-Go task, a test of vigilance, inhibitory control, and information processing. To our knowledge, this is the first study that both identifies neurodevelopmental phenotypes spanning several cognitive processes and links critical gestational timepoints for PM2.5 exposure with the manifestation of these phenotypes in children. As such, this paper highlights how holistic, integrative analysis of cognitive performance metrics can provide a more rigorous understanding of the environmental determinants shaping child neurodevelopment.
Acknowledgements
This work was supported by the National Institutes of Health/ National Institute of Environmental Health Sciences (grant numbers: R01ES014930; R01ES013744, R24ES028522, R01ES028927, P30ES023515) and the National Institute of Public Health/ Ministry of Health of Mexico. Funding was also provided by Mount Sinai International Exchange Program for Minority Students (grant number: 5T37MD001452) from the National Center on Minority Health and Health Disparities. We would like to thank the American British Cowdray Hospital for providing research facilities for this study and we gratefully acknowledge the Global Health Scholars Program at the Icahn School of Medicine at Mount Sinai and all members of the PROGRESS study team.
Abbreviations:
- PM2.5
Particulate matter of aerodynamic diameter less than 2.5μm
- LCA
Latent class analysis
- DLM
Distributed lag modeling
- FAR
False alarm rate
- HR
Hit rate
- MRT
Mean reaction time
- SDRT
Standard deviation of reaction time
- PROGRESS
Programming Research in Obesity, GRowth, Environment, and Social Stressors Study
Appendix
Figure A1.
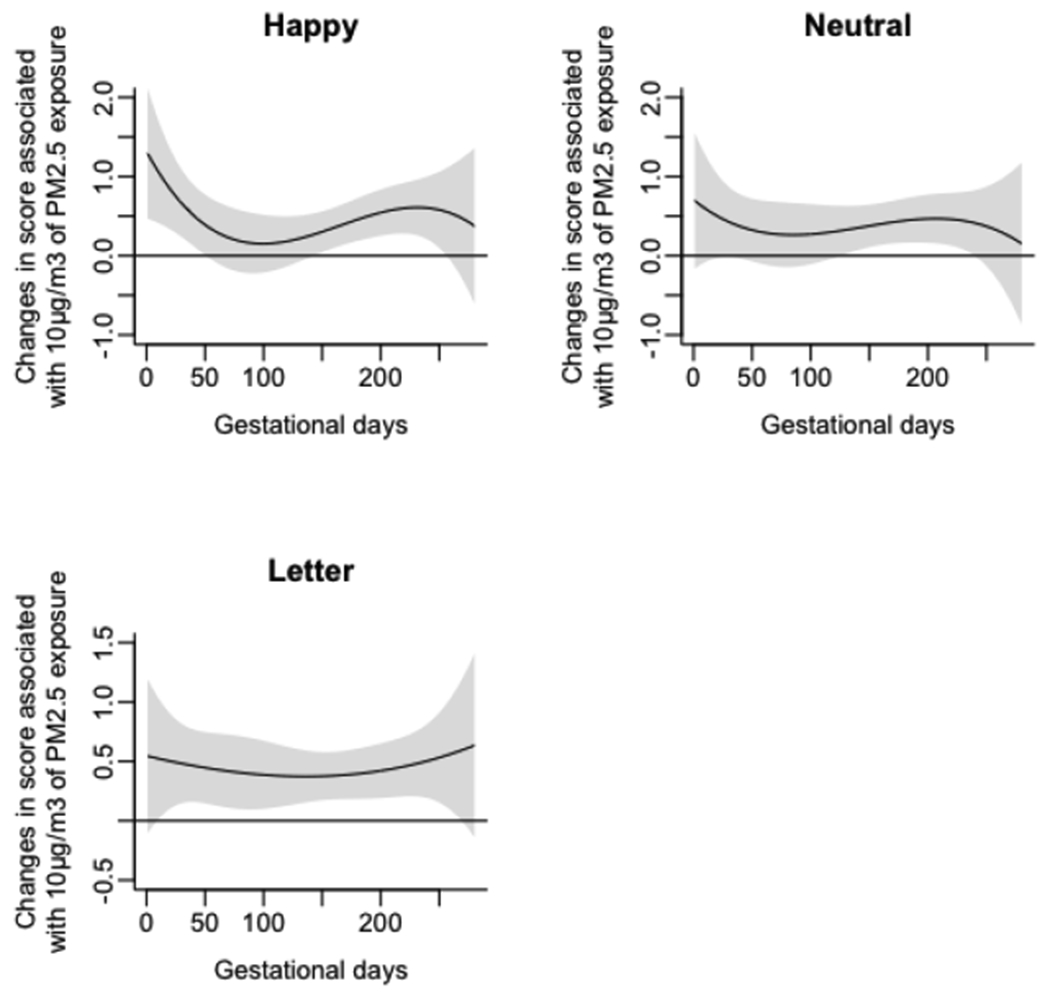
Associations of daily prenatal PM2.5 levels to mean standard deviation of reaction time (SDRT) on three Go/No-Go tasks (Happy, Neutral, and Letter), accounting for prenatal maternal blood lead concentrations.
Figure A2.
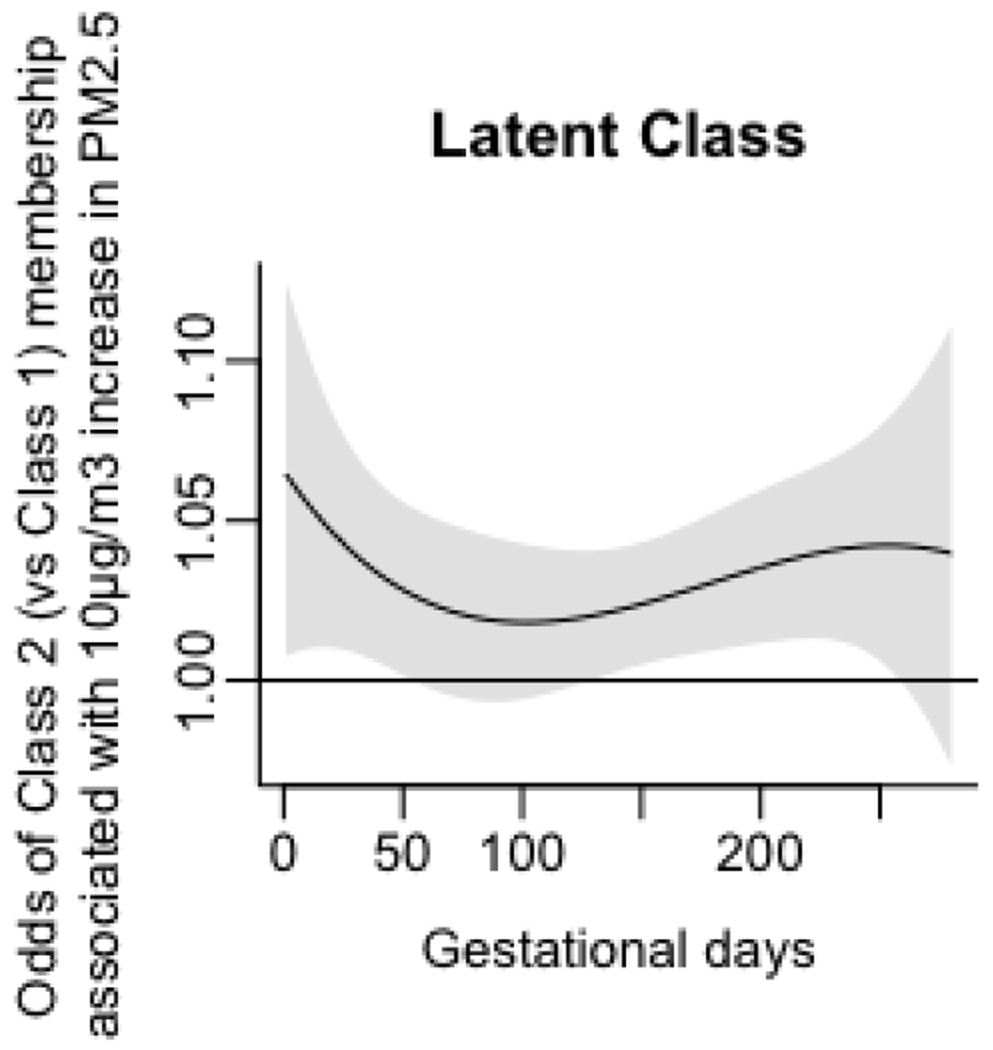
Associations of daily prenatal PM2.5 levels to odds ratio of membership in Class 2 (vs Class 1), accounting for prenatal maternal blood lead concentrations.
Figure A3.
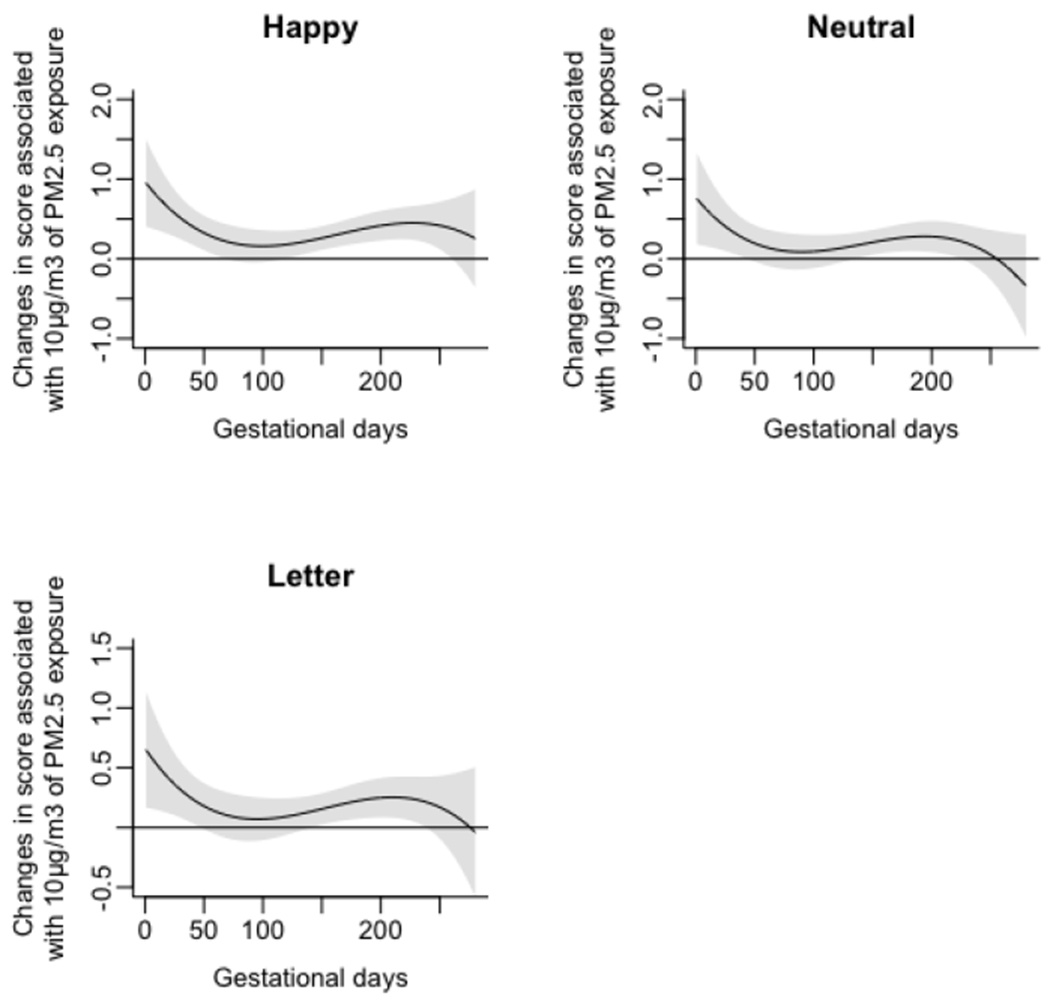
Associations of daily prenatal PM2.5 levels to mean standard deviation of reaction time (SDRT) on three Go/No-Go tasks (Happy, Neutral, and Letter), without accounting for maternal smoking and household tobacco exposure.
Figure A4.
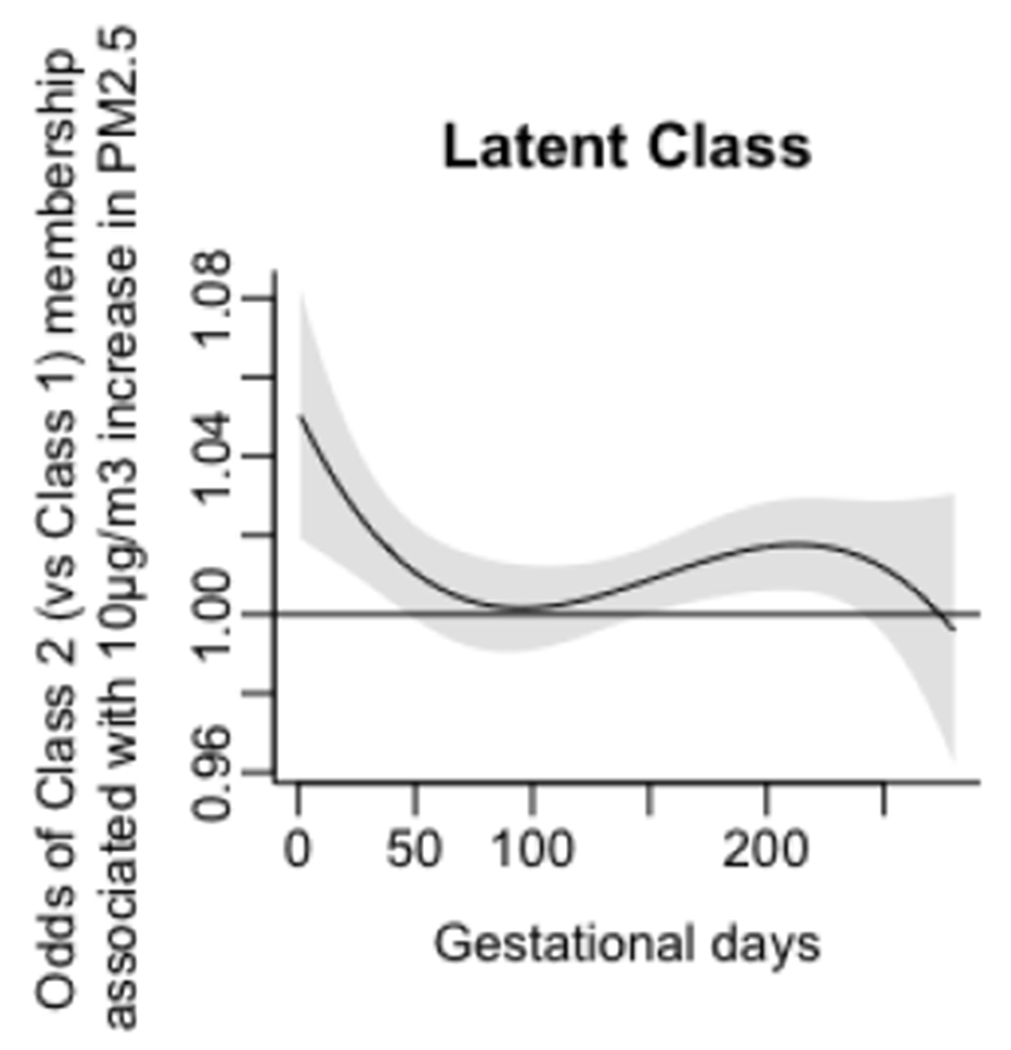
Associations of daily prenatal PM2.5 levels to odds ratio of membership in Class 2 (vs Class 1), without accounting for maternal smoking and household tobacco exposure.
Figure A5.
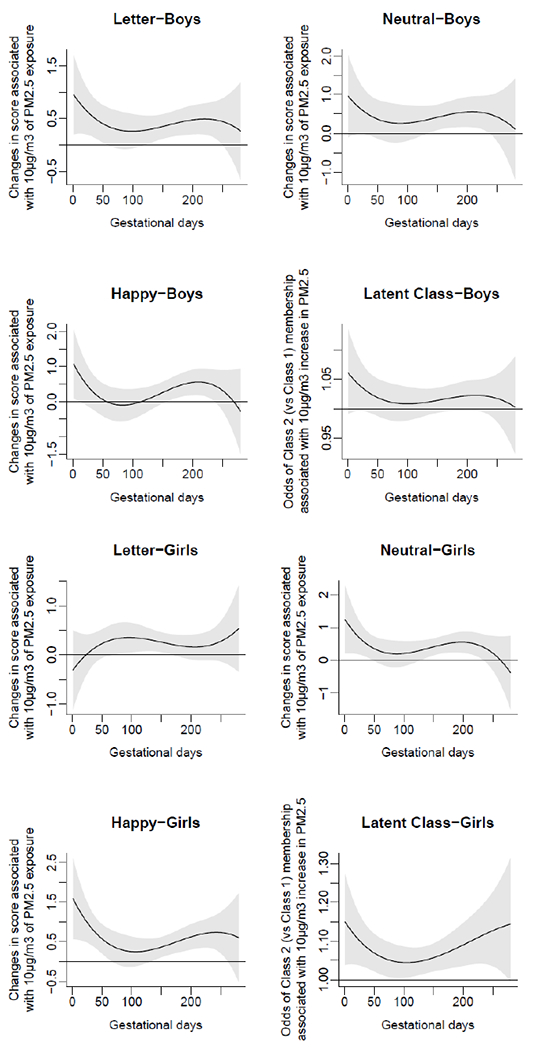
Sex-specific associations of daily prenatal PM2.5 levels to mean standard deviation of reaction time (SDRT) on three Go/No-Go tasks: Happy, Neutral, and Letter.
Footnotes
Publisher's Disclaimer: This is a PDF file of an unedited manuscript that has been accepted for publication. As a service to our customers we are providing this early version of the manuscript. The manuscript will undergo copyediting, typesetting, and review of the resulting proof before it is published in its final form. Please note that during the production process errors may be discovered which could affect the content, and all legal disclaimers that apply to the journal pertain.
Declaration of Competing Interest
The authors declare that they have no known competing financial interests or personal relationships that could have influenced the work reported in this paper. The authors declare no actual or potential conflicts of interest.
References
- Ackerman S (1992). The Development and Shaping of the Brain. Discovering the Brain, 86–103. [Google Scholar]
- Allen JL, Oberdorster G, Morris-Schaffer K, Wong C, Klocke C, Sobolewski M, … & Cory-Slechta DA (2017). Developmental neurotoxicity of inhaled ambient ultrafine particle air pollution: Parallels with neuropathological and behavioral features of autism and other neurodevelopmental disorders. Neurotoxicology, 59, 140–154. [DOI] [PMC free article] [PubMed] [Google Scholar]
- Aris IM, Rifas-Shiman SL, Li LJ, Belfort MB, Hivert MF, & Oken E (2019). Early-Life Predictors of Systolic Blood Pressure Trajectories From Infancy to Adolescence: Findings From Project Viva. American journal of epidemiology, 188(11), 1913–1922. [DOI] [PMC free article] [PubMed] [Google Scholar]
- Artuso C, & Palladino P (2019). Long-term memory effects on working memory updating development. PloS one, 14(5), e0217697. [DOI] [PMC free article] [PubMed] [Google Scholar]
- Bellinger DC (2013). Prenatal exposures to environmental chemicals and children’s neurodevelopment: an update. Safety and health at work, 4(1), 1–11. [DOI] [PMC free article] [PubMed] [Google Scholar]
- Block ML, & Calderón-Garcidueñas L (2009). Air pollution: mechanisms of neuroinflammation and CNS disease. Trends in neurosciences, 32(9), 506–516. [DOI] [PMC free article] [PubMed] [Google Scholar]
- Booker CL, Harding S, & Benzeval M (2011). A systematic review of the effect of retention methods in population-based cohort studies. BMC public health, 11(1), 1–12. [DOI] [PMC free article] [PubMed] [Google Scholar]
- Braun JM, Wright RJ, Just AC, Power MC, y Ortiz MT, Schnaas L, … & Tellez-Rojo MM(2014). Relationships between lead biomarkers and diurnal salivary cortisol indices in pregnant women from Mexico City: a cross-sectional study. Environmental Health, 13(1), 50. [DOI] [PMC free article] [PubMed] [Google Scholar]
- Bunge SA, Dudukovic NM, Thomason ME, Vaidya CJ, & Gabrieli JD (2002). Immature frontal lobe contributions to cognitive control in children: evidence from fMRI. Neuron, 33(2), 301–311. [DOI] [PMC free article] [PubMed] [Google Scholar]
- Calderón-Garcidueñas L, Engle R, Mora-Tiscareño A, Styner M, Gómez-Garza G, Zhu H, … & Bryant C (2011). Exposure to severe urban air pollution influences cognitive outcomes, brain volume and systemic inflammation in clinically healthy children. Brain and cognition, 77(3), 345–355. [DOI] [PubMed] [Google Scholar]
- Calderón-Garcidueñas L, Mora-Tiscareño A, Ontiveros E, Gómez-Garza G, Barragán-Mejía G, Broadway J, … & Henríquez-Roldán C (2008). Air pollution, cognitive deficits and brain abnormalities: a pilot study with children and dogs. Brain and cognition, 68(2), 117–127. [DOI] [PubMed] [Google Scholar]
- Calderón-Garcidueñas L, Serrano-Sierra A, Torres-Jardón R, Zhu H, Yuan Y, Smith D, … & Guilarte TR (2013). The impact of environmental metals in young urbanites’ brains. Experimental and toxicologic pathology, 65(5), 503–511. [DOI] [PMC free article] [PubMed] [Google Scholar]
- Calderón-Garcidueñas L, Solt AC, Henríquez-Roldán C, Torres-Jardón R, Nuse B, Herritt L, … & Brooks DM (2008). Long-term air pollution exposure is associated with neuroinflammation, an altered innate immune response, disruption of the blood-brain barrier, ultrafine particulate deposition, and accumulation of amyloid β-42 and α-synuclein in children and young adults. Toxicologic pathology, 36(2), 289–310. [DOI] [PubMed] [Google Scholar]
- Calderón-Garcidueñas L, Torres-Jardón R, Kulesza RJ, Park SB, & D’Angiulli A (2014). Air pollution and detrimental effects on children’s brain. The need for a multidisciplinary approach to the issue complexity and challenges. Frontiers in human neuroscience, 8, 613. [DOI] [PMC free article] [PubMed] [Google Scholar]
- Carrasco A (2002). The AMAI system of classifying households by socio-economic level: ESOMAR. [Google Scholar]
- Casey BJ, Trainor RJ, Orendi JL, Schubert AB, Nystrom LE, Giedd JN, … & Forman SD (1997). A developmental functional MRI study of prefrontal activation during performance of a go-no-go task. Journal of cognitive neuroscience, 9(6), 835–847. [DOI] [PubMed] [Google Scholar]
- Catalán-Vázquez M, Riojas-Rodríguez H, Jarillo-Soto EC, & Delgadillo-Gutiérrez HJ (2009). Perception of health risks due to air pollution in adolescents in Mexico City. Salud publica de Mexico, 51(2), 148–156. [DOI] [PubMed] [Google Scholar]
- Chiu YHM, Hsu HHL, Coull BA, Bellinger DC, Kloog I, Schwartz J, … & Wright RJ (2016). Prenatal particulate air pollution and neurodevelopment in urban children: examining sensitive windows and sex-specific associations. Environment international, 87, 56–65. [DOI] [PMC free article] [PubMed] [Google Scholar]
- Clifford A, Lang L, Chen R, Anstey KJ, & Seaton A (2016). Exposure to air pollution and cognitive functioning across the life course–a systematic literature review. Environmental research, 147, 383–398. [DOI] [PubMed] [Google Scholar]
- Cohen JR, Berkman ET, & Lieberman MD (2012). Ventrolateral PFC as a self-control muscle and how to use it without trying. Principles of Frontal Lobe Functions. [Google Scholar]
- Costa LG, Cole TB, Coburn J, Chang YC, Dao K, & Roqué PJ (2017). Neurotoxicity of traffic-related air pollution. Neurotoxicology, 59, 133–139. [DOI] [PMC free article] [PubMed] [Google Scholar]
- Costa LG, Cole TB, Dao K, Chang YC, Coburn J, & Garrick JM (2020). Effects of air pollution on the nervous system and its possible role in neurodevelopmental and neurodegenerative disorders. Pharmacology & Therapeutics, 107523. [DOI] [PMC free article] [PubMed] [Google Scholar]
- Cowell W, Lee A, Chiu Y, Kloog I, Bollati V, Just A, … & Wright R (2019). Critical windows of telomere susceptibility to PM2. 5 over gestation: modification by fetal sex and maternal antioxidant intake. Environmental Epidemiology, 3, 82–83. [Google Scholar]
- Cserbik D, Chen JC, McConnell R, Berhane K, Sowell ER, Schwartz J, … & Herting MM (2020). Fine particulate matter exposure during childhood relates to hemispheric-specific differences in brain structure. Environment International, 143, 105933. [DOI] [PMC free article] [PubMed] [Google Scholar]
- D’Unger AV, Land KC, McCall PL, & Nagin DS (1998). How many latent classes of delinquent/criminal careers? Results from mixed Poisson regression analyses. American journal of sociology, 103(6), 1593–1630. [Google Scholar]
- Davidson MC, Amso D, Anderson LC, & Diamond A (2006). Development of cognitive control and executive functions from 4 to 13 years: Evidence from manipulations of memory, inhibition, and task switching. Neuropsychologia, 44(11), 2037–2078. [DOI] [PMC free article] [PubMed] [Google Scholar]
- de Prado Bert P, Mercader EMH, Pujol J, Sunyer J, & Mortamais M (2018). The effects of air pollution on the brain: a review of studies interfacing environmental epidemiology and neuroimaging. Current environmental health reports, 5(3), 351–364. [DOI] [PMC free article] [PubMed] [Google Scholar]
- Dennery PA (2010). Oxidative stress in development: nature or nurture?. Free Radical Biology and Medicine, 49(7), 1147–1151. [DOI] [PubMed] [Google Scholar]
- Diamond A (2013). Executive functions. Annual review of psychology, 64, 135–168. [DOI] [PMC free article] [PubMed] [Google Scholar]
- Diaz A, Blankenship TL, & Bell MA (2018). Episodic memory in middle childhood: Age, brain electrical activity, and self-reported attention. Cognitive development, 47, 63–70. [DOI] [PMC free article] [PubMed] [Google Scholar]
- Eagle DM, Bari A, & Robbins TW (2008). The neuropsychopharmacology of action inhibition: cross-species translation of the stop-signal and go/no-go tasks. Psychopharmacology, 199(3), 439–456. [DOI] [PubMed] [Google Scholar]
- Egger HL, Pine DS, Nelson E, Leibenluft E, Ernst M, Towbin KE, & Angold A (2011). The NIMH Child Emotional Faces Picture Set (NIMH-ChEFS): a new set of children’s facial emotion stimuli. International journal of methods in psychiatric research, 20(3), 145–156. [DOI] [PMC free article] [PubMed] [Google Scholar]
- Estévez-García JA, Schilmann A, Riojas-Rodríguez H, Berrueta V, Blanco S, Villaseñor-Lozano CG, … & Pérez-Padilla R (2020). Women exposure to household air pollution after an improved cookstove program in rural San Luis Potosi, Mexico. Science of The Total Environment, 702, 134456. [DOI] [PubMed] [Google Scholar]
- Farber DA, & Petrenko NE (2012). Development of mechanisms of recognition fragmented images at the preschool and early school ages. Fiziologiia cheloveka, 38(5), 5–15. [PubMed] [Google Scholar]
- Fruh V, Rifas-Shiman SL, Amarasiriwardena C, Cardenas A, Bellinger DC, Wise LA, … & Henn BC (2019). Prenatal lead exposure and childhood executive function and behavioral difficulties in project viva. Neurotoxicology, 75, 105–115. [DOI] [PMC free article] [PubMed] [Google Scholar]
- Gasparrini A, Armstrong B, & Kenward MG (2010). Distributed lag non-linear models. Statistics in medicine, 29(21), 2224–2234. [DOI] [PMC free article] [PubMed] [Google Scholar]
- Gasparrini A (2011). Distributed lag linear and non-linear models in R: the package dlnm. Journal of statistical software, 43(8), 1. [PMC free article] [PubMed] [Google Scholar]
- Gaytán Jiménez E, Rosales González M, Reyes Hernández H, Díaz-Barriga Martínez F, & Calderón Hernández J (2015). Prevalencia de dificultades emocionales, conductuales y cognitivas en niños de escenarios urbanos con diferente grado de marginación. Revista de psicología y ciencias del comportamiento de la Unidad Académica de Ciencias Jurídicas y Sociales, 6(1), 57–74. [Google Scholar]
- Giancotti A, Monti M, Nevi L, Safarikia S, D’Ambrosio V, Brunelli R, … & Chiappetta MF (2019). Functions and the Emerging Role of the Foetal Liver into Regenerative Medicine. Cells, 8(8), 914. [DOI] [PMC free article] [PubMed] [Google Scholar]
- Girchenko P, Lahti-Pulkkinen M, Heinonen K, Reynolds RM, Laivuori H, Lipsanen J, … & Räikkönen K (2020). Persistently high levels of maternal antenatal inflammation are associated with and mediate the effect of prenatal environmental adversities on neurodevelopmental delay in the offspring. Biological psychiatry, 87(10), 898–907. [DOI] [PubMed] [Google Scholar]
- Goasdoué K, Miller SM, Colditz PB, & Björkman ST (2017). The blood-brain barrier; protecting the developing fetal brain. Placenta, 54, 111–116. [DOI] [PubMed] [Google Scholar]
- Goeden N, Velasquez J, Arnold KA, Chan Y, Lund BT, Anderson GM, & Bonnin A (2016). Maternal inflammation disrupts fetal neurodevelopment via increased placental output of serotonin to the fetal brain. Journal of Neuroscience, 36(22), 6041–6049. [DOI] [PMC free article] [PubMed] [Google Scholar]
- Grandjean P, & Landrigan PJ (2006). Developmental neurotoxicity of industrial chemicals. The Lancet, 368(9553), 2167–2178. [DOI] [PubMed] [Google Scholar]
- Grandjean P, & Landrigan PJ (2014). Neurobehavioural effects of developmental toxicity. The lancet neurology, 13(3), 330–338. [DOI] [PMC free article] [PubMed] [Google Scholar]
- Gumusoglu SB, & Stevens HE (2019). Maternal inflammation and neurodevelopmental programming: a review of preclinical outcomes and implications for translational psychiatry. Biological Psychiatry, 85(2), 107–121. [DOI] [PubMed] [Google Scholar]
- Guxens M, Lubczyńska MJ, Muetzel RL, Dalmau-Bueno A, Jaddoe VW, Hoek G, … & Tiemeier H (2018). Air pollution exposure during fetal life, brain morphology, and cognitive function in school-age children. Biological psychiatry, 84(4), 295–303. [DOI] [PubMed] [Google Scholar]
- Heeren T, Joseph RM, Allred EN, O’Shea TM, Leviton A, & Kuban KC (2017). Cognitive functioning at the age of 10 years among children born extremely preterm: a latent profile approach. Pediatric research, 82(4), 614–619. [DOI] [PMC free article] [PubMed] [Google Scholar]
- Herting MM, Younan D, Campbell CE, & Chen JC (2019). Outdoor air pollution and brain structure and function from across childhood to young adulthood: a methodological review of brain MRI studies. Frontiers in Public Health, 7. [DOI] [PMC free article] [PubMed] [Google Scholar]
- Hitchler MJ, & Domann FE (2007). An epigenetic perspective on the free radical theory of development. Free Radical Biology and Medicine, 43(7), 1023–1036. [DOI] [PMC free article] [PubMed] [Google Scholar]
- Holz NE, Boecker R, Baumeister S, Hohm E, Zohsel K, Buchmann AF, … & Plichta MM (2014). Effect of prenatal exposure to tobacco smoke on inhibitory control: neuroimaging results from a 25-year prospective study. JAMA psychiatry, 71(7), 786–796. [DOI] [PubMed] [Google Scholar]
- Huang Y, Zhang T, Zhu Z, Gong W, & Xia X (2021). PM2. 5 concentration estimation with 1-km resolution at high coverage over urban agglomerations in China using the BPNN-KED approach and potential application. Atmospheric Research, 258, 105628. [Google Scholar]
- Jakab A, Schwartz E, Kasprian G, Gruber GM, Prayer D, Schöpf V, & Langs G (2014). Fetal functional imaging portrays heterogeneous development of emerging human brain networks. Frontiers in human neuroscience, 8, 852. [DOI] [PMC free article] [PubMed] [Google Scholar]
- Jansson T, & Powell TL (2007). Role of the placenta in fetal programming: underlying mechanisms and potential interventional approaches. Clinical science, 113(1), 1–13. [DOI] [PubMed] [Google Scholar]
- Jiang CB, Hsi HC, Fan CH, & Chien LC (2014). Fetal exposure to environmental neurotoxins in Taiwan. PLoS One, 9(10), e109984. [DOI] [PMC free article] [PubMed] [Google Scholar]
- Just AC, Wright RO, Schwartz J, Coull BA, Baccarelli AA, Tellez-Rojo MM, … & Kloog I (2015). Using high-resolution satellite aerosol optical depth to estimate daily PM2. 5 geographical distribution in Mexico City. Environmental science & technology, 49(14), 8576–8584. [DOI] [PMC free article] [PubMed] [Google Scholar]
- Kalkbrenner AE, Windham GC, Serre ML, Akita Y, Wang X, Hoffman K, … & Daniels JL (2015). Particulate matter exposure, prenatal and postnatal windows of susceptibility, and autism spectrum disorders. Epidemiology, 26(1), 30–42. [DOI] [PubMed] [Google Scholar]
- Karbach J, & Unger K (2014). Executive control training from middle childhood to adolescence. Frontiers in psychology, 5, 390. [DOI] [PMC free article] [PubMed] [Google Scholar]
- Keribin C (1998). Consistent estimate of the order of mixture models. Comptes Rendus De L Academie Des Sciences Serie I-Mathematique, 326(2), 243–248. [Google Scholar]
- Konkel L (2018). The brain before birth: Using fMRI to explore the secrets of fetal neurodevelopment. [DOI] [PMC free article] [PubMed] [Google Scholar]
- Kwon EJ, & Kim YJ (2017). What is fetal programming?: a lifetime health is under the control of in utero health. Obstetrics & gynecology science, 60(6), 506–519. 10.5468/ogs.2017.60.6.506 [DOI] [PMC free article] [PubMed] [Google Scholar]
- Lee WJ, Liu CY, Peng LN, Lin CH, Lin HP, & Chen LK (2020). PM 2.5 air pollution contributes to the burden of frailty. Scientific reports, 10(1), 1–6. [DOI] [PMC free article] [PubMed] [Google Scholar]
- Lewis FC, Reeve RA, Kelly SP, & Johnson KA (2017). Sustained attention to a predictable, unengaging Go/No-Go task shows ongoing development between 6 and 11 years. Attention, Perception, & Psychophysics, 79(6), 1726–1741. [DOI] [PubMed] [Google Scholar]
- Liu J, Bann C, Lester B, Tronick E, Das A, Lagasse L, et al. Neonatal neurobehavior predicts medical and behavioral outcome. Pediatrics. 2010;125(1):e90–8. doi: 10.1542/peds.2009-0204. [DOI] [PMC free article] [PubMed] [Google Scholar]
- Luna B (2009). Developmental changes in cognitive control through adolescence. Advances in child development and behavior, 37, 233–278. [DOI] [PMC free article] [PubMed] [Google Scholar]
- Luna B, Garver KE, Urban TA, Lazar NA, & Sweeney JA (2004). Maturation of cognitive processes from late childhood to adulthood. Child development, 75(5), 1357–1372. [DOI] [PubMed] [Google Scholar]
- Molina LT, de Foy B, Martínez OV, & Paramo Figueroa VH (2009). Air quality, weather and climate in Mexico City. World Meteorological Organization (WMO) Bulletin, 58(1), 48. [Google Scholar]
- McGuinn LA, Bellinger DC, Colicino E, Coull BA, Just AC, Kloog I, … & Horton MK (2020). Prenatal PM2. 5 exposure and behavioral development in children from Mexico City. Neurotoxicology, 81, 109–115. [DOI] [PMC free article] [PubMed] [Google Scholar]
- Moffitt TE, Arseneault L, Belsky D, Dickson N, Hancox RJ, Harrington H, … & Sears MR (2011). A gradient of childhood self-control predicts health, wealth, and public safety. Proceedings of the national Academy of Sciences, 108(7), 2693–2698. [DOI] [PMC free article] [PubMed] [Google Scholar]
- Moffitt TE (2012). Childhood self-control predicts adult health, wealth, and crime: Paper presented at the Multi-Disciplinary Symposium Improving the Well-Being of Children and Youth Copenhagen. [Google Scholar]
- Molina LT, de Foy B, Martínez OV, & Paramo Figueroa VH (2009). Air quality, weather and climate in Mexico City. World Meteorological Organization (WMO) Bulletin, 58(1), 48. [Google Scholar]
- Mortamais M, Pujol J, Martínez-Vilavella G, Fenoll R, Reynes C, Sabatier R, … & Cirach M (2019). Effects of prenatal exposure to particulate matter air pollution on corpus callosum and behavioral problems in children. Environmental research, 178, 108734. [DOI] [PMC free article] [PubMed] [Google Scholar]
- Psychology Software Tools, Inc. [E-Prime 3.0], (2016). Retrieved from https://www.pstnet.com.
- R Core Team (2018). R: A language and environment for statistical computing. R Foundation for Statistical Computing, Vienna, Austria. Available online at https://www.R-project.org/. [Google Scholar]
- Raz R, Roberts AL, Lyall K, Hart JE, Just AC, Laden F, & Weisskopf MG (2015). Autism spectrum disorder and particulate matter air pollution before, during, and after pregnancy: a nested case–control analysis within the Nurses’ Health Study II cohort. Environmental health perspectives, 123(3), 264–270. [DOI] [PMC free article] [PubMed] [Google Scholar]
- Rodier PM (1995). Developing brain as a target of toxicity. Environmental health perspectives, 103(suppl 6), 73–76. [DOI] [PMC free article] [PubMed] [Google Scholar]
- Rosa MJ, Just AC, y Ortiz MT, Schnaas L, Svensson K, Wright RO, … & Wright RJ (2016). Prenatal and postnatal stress and wheeze in Mexican children: sex-specific differences. Annals of Allergy, Asthma & Immunology, 116(4), 306–312. [DOI] [PMC free article] [PubMed] [Google Scholar]
- Rosa MJ, Hair GM, Just AC, Kloog I, Svensson K, Pizano-Zárate ML, … & Tellez-Rojo MM (2020). Identifying critical windows of prenatal particulate matter (PM2. 5) exposure and early childhood blood pressure. Environmental Research, 182, 109073. [DOI] [PMC free article] [PubMed] [Google Scholar]
- Schulz KP, Fan J, Magidina O, Marks DJ, Hahn B, & Halperin JM (2007). Does the emotional go/no-go task really measure behavioral inhibition? Convergence with measures on a non-emotional analog. Archives of Clinical Neuropsychology, 22(2), 151–160. [DOI] [PMC free article] [PubMed] [Google Scholar]
- Sidaoui J, Ramos-Francia M, & Cuadra G (2010). The global financial crisis and policy response in Mexico. BIS papers, (54), 279–298. [Google Scholar]
- Sierra Sanjurjo N, Montañes P, Sierra Matamoros FA, & Burin D (2015). Estimating intelligence in Spanish: regression equations with the Word Accentuation Test and demographic variables in Latin America. Applied Neuropsychology: Adult, 22(4), 252–261. [DOI] [PubMed] [Google Scholar]
- Tottenham N, Hare TA, & Casey BJ (2011). Behavioral assessment of emotion discrimination, emotion regulation, and cognitive control in childhood, adolescence, and adulthood. Frontiers in psychology, 2, 39. [DOI] [PMC free article] [PubMed] [Google Scholar]
- Vallejo M, Lerma C, Infante O, Hermosillo AG, Riojas-Rodriguez H, & Cárdenas M (2004). Personal exposure to particulate matter less than 2.5 μ m in Mexico City: a pilot study. Journal of Exposure Science & Environmental Epidemiology, 14(4), 323–329. [DOI] [PubMed] [Google Scholar]
- Vermunt J, Magidson J. Latent class cluster analysis. In: Hagenaars J, McCutcheon A, editors. Applied Latent Class ANalysis. Cambridge: Cambridge University Press; 2002. pp. 89–106. [Google Scholar]
- Villarreal MA (2010, September). The Mexican economy after the global financial crisis. Library of Congress Washington DC Congressional Research Service. [Google Scholar]
- Wolffe MC, Wild O, Long SP, & Ashworth K (2021). Temporal variability in the impacts of particulate matter on crop yields on the North China Plain. Science of the Total Environment, 776, 145135. [DOI] [PubMed] [Google Scholar]
- Xu X, Ha SU, & Basnet R (2016). A review of epidemiological research on adverse neurological effects of exposure to ambient air pollution. Frontiers in public health, 4, 157. [DOI] [PMC free article] [PubMed] [Google Scholar]
- Yerys BE, Kenworthy L, Jankowski KF, Strang J, & Wallace GL (2013). Separate components of emotional go/no-go performance relate to autism versus attention symptoms in children with autism. Neuropsychology, 27(5), 537. [DOI] [PMC free article] [PubMed] [Google Scholar]
- Yu X, Zheng L, Jiang W, & Zhang D (2020). Exposure to air pollution and cognitive impairment risk: a meta-analysis of longitudinal cohort studies with dose-response analysis. Journal of Global Health 10(1). [DOI] [PMC free article] [PubMed] [Google Scholar]
- Zhan Z, Ai J, Ren F, Li L, Chu CH, & Chang YK (2020). Cardiorespiratory fitness, age, and multiple aspects of executive function among preadolescent children. Frontiers in Psychology, 11, 1198. [DOI] [PMC free article] [PubMed] [Google Scholar]
- Zhang W, Zheng F, Zhang W, & Yang X (2021). Estimating Ground-Level Hourly PM 2.5 Concentrations Over North China Plain with Deep Neural Networks. Journal of the Indian Society of Remote Sensing, 1–14. [Google Scholar]
- Zhang Y, West JJ, Mathur R, Xing J, Hogrefe C, Roselle SJ, … & Wong DC (2018). Long-term trends in the ambient PM2. 5-and O3-related mortality burdens in the United States under emission reductions from 1990 to 2010. Atmospheric chemistry and physics, 18(20), 15003. [DOI] [PMC free article] [PubMed] [Google Scholar]


