Abstract
Purpose:
Although inflammation has been recognized as a key process in the pathogenesis of osteoarthritis (OA), there remains no clinical non-invasive imaging modality that can specifically diagnose inflammatory activity of OA. In this study, a formyl peptide receptor 1 (Fpr1) targeting probe cFLFLF-PEG-HYNIC-99mTc and Single-Photon Emission Computed Tomography (SPECT) imaging was used to detect inflammatory activity by targeting macrophages involved in the pathogenesis of OA.
Procedures:
In vitro experiments were performed to evaluate Fpr1 expression during macrophage inflammatory response. In the in vivo studies, anterior cruciate ligament transection (ACLT) surgery was performed and magnetic resonance imaging (MRI) and histological data was assessed to analyze the OA model in both mice and rats. The radioactive probe cFLFLF-PEG- HYNIC-99mTc and SPECT imaging were used to corroborate OA-related inflammation and compare ACLT vs sham knees.
Results:
In vitro macrophage activation resulted in a remarkable increase in Fpr1 expression. In vivo experiments in mice and rats produced similar results. MRI and histological analysis demonstrated significant joint degeneration in the ACLT knee. The ACLT knee produced a much stronger signal from the probe when compared to the sham knee. It is important to note the ratio of ACLT/sham knee signal intensity decreased with OA progression, indicating greater differences earlier in the progression of OA.
Conclusion:
The radioactive probe cFLFLF-PEG- HYNIC-99mTc and SPECT imaging is effective for detecting and monitoring inflammation during OA progression by targeting Fpr1 expression in the knee joint.
Keywords: Anterior cruciate ligament transection, formyl peptide receptor 1, inflammation, macrophages, osteoarthritis, single-photon emission computed tomography imaging
Introduction
Currently, there are no validated non-invasive techniques available to precisely detect and measure the extent of inflammation in osteoarthritis (OA). Anatomic imaging techniques, such as radiography and magnetic resonance imaging (MRI), help identify structural changes caused by OA such as cartilage degeneration, bone marrow lesions, meniscal defects, and joint effusion [1–4]. These are simply results of the disease process and do not visualize the true disease activity [5].
Traditionally, OA has been considered a non-inflammatory disease that is caused by abnormal mechanical and biochemical conditions within the joint, including anatomic abnormalities, genetic disorders, bone fracture, and aging [6]. However, recent studies have revealed that synovial inflammation, immune cells, cytokines, chemokines, and complement are involved in the pathogenesis of OA [7, 8]. These components act in concert in the early stage of OA [7]. Furthermore, it has been suggested that synovitis is a primary trigger of OA’s pathogenesis through activation of macrophages and T cells [8, 9]. Although the role of macrophages in human OA is still largely unknown, their importance has been implicated by their close relevance to OA symptoms such as cartilage destruction, osteophyte formation, and pain [10–12]. In this regard, activated macrophages are key players among early events in OA progression and can serve as a target for detection of disease activity in OA [7].
The formyl peptide receptor 1 (Fpr 1) is expressed in a variety of immune cells and the peptide cinnamoyl-F-(D)L-F-(D)L-F (cFLFLF) has been reported as a potential inflammation imaging probe due to high affinity to the Fpr 1 [13, 14]. Previously we demonstrated that a positron emission tomography (PET) probe cFLFLF-PEG-64Cu could be used for targeting Fpr1 of activated macrophages during OA development using a rat knee model induced by monosodium iodoacetate (MIA) [15]. Unfortunately, MIA has limitations as a metabolic poison and produces extensive chondrocyte cell death, unlike human OA [16]. Furthermore, PET is less widely available and more expensive than SPECT, limiting its potential for clinical application. Another study we performed in rats using an acute osteomyelitis model demonstrated that inflammation could be imaged by cFLFLF-PEG- HYNIC -99mTc/SPECT with high specificity and sensitivity [17]. Additionally, aortic aneurysms in a mouse model can be diagnosed by cFLFLF-PEG- HYNIC -99mTc/SPECT, further demonstrating its ability to image inflammation activity [18].
Our current study utilizes cFLFLF-PEG- HYNIC -99mTc/SPECT during OA development using a rodent knee model induced by surgical anterior cruciate ligament transection (ACLT). This improves upon our previous OA study by using SPECT, which is more available than PET, and an ACLT model that offers a slower, progressive OA disease course, similar to human OA.
Materials and Methods
Study Design
The study was composed of in vitro and in vivo experiments. For in vitro experiments, mouse peritoneal macrophages (PMs) and bone marrow macrophages (BMMs) were prepared. Expression of Fpr1 and other inflammatory phenotypes were assessed after both cells were stimulated by lipopolysaccharide (LPS), aiming to establish a possible correlation of Fpr1 with macrophage activation. For in vivo experiments, the cFLFLF-PEG- HYNIC -99mTc probe was validated for SPECT imaging of inflammation during OA progression using a mouse OA model induced by ACLT surgery of knee joints and characterized by MRI and histology. Furthermore, the SPECT probe for OA imaging was validated in rats as well, to provide evidence that its use is not species limited.
Animals
C57BL/6 mice (12–14 weeks old) and Sprague–Dawley rats (12–14 weeks old) were purchased from Charles River (Boston, MA) and housed, as outlined and approved by the institutional Animal Care and Use Committee, in a vivarium in the Comparative Medicine Center at University of Virginia to ensure the humane care and use of animals. Euthanasia was performed upon completion of experiment by cervical dislocation after ketamine/xylazine anesthesia or CO2 treatment.
Mouse Peritoneal Macrophages (PMs) and Bone marrow derived macrophages (BMMs)
The PMs were isolated from peritoneum, and cultured in Dulbecco’s modified Eagle’s medium (DMEM, Gibco BRL, Gaithersburg, MD) supplemented with 10% fetal bovine serum (FBS) (Hyclone Laboratories, Logan, VT) and 100 IU/mL penicillin G and 100 μg/mL streptomycin, in a humidified atmosphere of 5% carbon dioxide at 37°C. Cells were then treated with or without 100 ng/ml lipopolysaccharide (LPS, Sigma-Aldrich) as needed [19]. The BMMs were harvested and cultured as previously described [20]. Briefly, bone marrow was harvested from femurs and tibias and incubated overnight in RPMI 1640 (Gibco, USA) supplemented with 10% FBS (Gibco) and antibiotics containing 100 IU/mL penicillin G and 100 μg/mL streptomycin. Then cells in the supernatants were counted and replated in RPMI 1640 with 20 ng/mL macrophage colony stimulating factor (MCSF, purchased from Sigma-Aldrich) at a density of 1×10⁶ cells/well (24-well plate, Corning Incorporate). After 24 hr culture, cells were activated with 100 ng/ml LPS and MCSF or treated with MCSF alone. Both cells and cell medium of PMs and DMMs were harvested at the indicated time points, generally 24 hours post-stimulation for gene expression analysis, and TNFα and nitrite assay, respectively.
Gene Expression Analysis
Total RNA was extracted and purified using an RNeasy kit (QIAGEN Sciences, Valencia, CA) according to the protocol provided by the manufacturer. The RNase-Free DNase is used to digest DNA during RNA purification. The purified RNA was stored at −80°C. The yield of RNA was determined by measuring absorbance at 260 nm. Synthesis of cDNA from total RNA and the quantitative PCR was carried out by using the iscript™ cDNA synthesis kit and the iQ™ SYBR Green Supermix kit (Bio-Rad Laboratories, Hercules, CA), respectively. The target genes included iNOS, TNFα, IL-1β and IL-6. Gene of 18s ribosomal RNA was used as an internal control. The threshold cycle (CT) value was calculated from amplification plots. Data was analyzed using the 2−ΔΔΔCT method with 18s rRNA serving as the reference. Gene expression was normalized to the control group in each experiment and represented as fold of change. The primer sequences are listed as follows: 5’- GTGACCAGTTCACTCTTGGT -3’ (forward), 5’- CATTGGAAGTGAAGCGTTTCG -3’ (reverse) for 18s rRNA, 5’- TTCATGAGGTTCACTGCAGACT -3’ (forward), 5’- AGGACAGAGGGAAACAAC -3’ (reverse) for Fpr1, 5’-GAGGGATGCCTTCCGCAGCTG -3’ (forward), 5’- GAATCGAACCCTGATTCCCCGTC -3’ (reverse) for iNOS, 5’-CATCTTCTCAAAATTCGAGTGACAA-3’ (forward), 5’- TGGGAGTAGACAAGGTACAACCC -3’ (reverse) for TNF α, 5’- CAACCAACAAGT GATATTCTCCATG -3’ (forward), 5’- GATCCACACTCTCCAGCTGCA -3’ (reverse) for IL-1β and 5’- GAGTCCTTCAGAGAGATACAG -3’ (forward), 5’- TGGTCTTGGTCCTTAGCC -3’ (reverse) for IL-6.
Detection of TNFα Level and Nitric Oxide (NO) Production
The TNFα and NO production in cell medium were measured by a commercial ELISA kit (Sigma-Aldrich) and Griess reagent kit (Promega Corporation, Madison, WI, USA), according to the instructions provided by the manufacturer. The optical density (OD) of resultant solutions were read at 450 nm for ELISA and at 530 nm for nitrite production on a microplate reader respectively.
ACLT Surgery of OA Model
The animal surgery was performed under a protocol approved by the Institutional Animal Care and Use Committee at the University of Virginia. Mice and rats were allowed to settle for 2 days upon arrival to the vivarium, and anesthesia were induced with a ketamine/xylazine injection. The procedure for ACLT surgery were performed under sterile conditions, according to the protocol described previously [21]. After shaving the knee joint, the skin was disinfected with iodine and an incision was made through the patellar tendon in the longitudinal direction to obtain access to the knee joint. The patellar tendon was retracted using 2 surgical hooks. Once the ACL was visible, it was transected using a von Graefe knife (Fine Science Tools) with the knee in a semi-flexed position of about 30°. A positive anterior drawer test was used to ensure complete transection of the ligament. Sham operations were performed in the contralateral knee joint and consist of opening the joint space without transection of the ACL. The animals were allowed to fully recover from the anesthesia and were monitored appropriately before returning them to the vivarium.
Histological Analysis
After completion of SPECT and MRI imaging, animals were euthanized. The joint capsules from 4 animals per group were collected and were decalcified. Additionally, the synovial membranes from rats were surgically excised. They were then paraffin-embedded and routinely processed to produce 5 μm micro-sections. The tissue sections were stained by Safranin O/Fast green and Hematoxylin/Eosin, respectively. Microscopic images of each section were taken by a Nikon ECLIPSE E600 microscope with a Zeiss software.
MRI analysis
Three animals were imaged using 7T MRI scanner (Agilent/Varian, Santa Clara, CA) to assess cartilage changes in four compartments (medial femur, lateral femur, medial tibia, and lateral tibia). For the imaging procedure, animals were anesthetized using 1.5–2% isoflurane mixed with oxygen and were placed in a dedicated plastic holder in a 63 mm diameter volume coil (for signal transmission) with a 20 mm surface coil (for signal reception) attached to the knee. After scanning, animals were kept on a warm heating pad until completely recovered. Sagittal three-dimensional (3D) and 2T images were obtained with the software attached to the machine.
cFLFLF-PEG- HYNIC -99mTc Preparations
The [99mTc]cFLFLF preparations were synthesized and characterized according to our previous report[17]. Briefly, a 1.5 mL autoclaved Eppendorf tube containing 0.1 mg of cFLFLF-PEG- HYNIC had the following consecutively added: 200 μL of tricine solution (30 mg/mL in double distilled water), 100 μL of nicotinic acid solution (10 mg/mL in double distilled water), 10 mCi 99mTcO4-solution (procured from Cardinal Health, VA) and 20 μL SnCl2 solution (3.0 mg/mL in ethanol). The mixture was placed at room temperature for 15–20 min. The radiochemical purity of the reaction mixture was analyzed by instant thin-layer chromatography (ITLC) and then the reaction mixture was purified by the Sep-Pak C18 cartridge. The Sep-Pak cartridge was washed by 3×2mL ml double distilled water to remove free 99mTc species. The peptide ligands were washed down by 4×0.5 mL ethanol. The ethanol fraction was dried with nitrogen flow and re-suspended in brine for administration in animals. The radiochemical purity of the final product was analyzed by ITLC and was observed to be >97%.
SPECT Imaging
SPECT/computed tomography (CT) was performed on the Albira Si Trimodal preclinical scanner (Bruker) comprised of PET, SPECT, and CT subsystems. SPECT/CT modalities are coplanar with the SPECT imaging module fitted with two opposing 180-degree gamma cameras. The CT module, X-ray emitter, and detector are placed orthogonal to the SPECT module. Injection of the radioactive probe (35 MBq/mouse or 200 MBq/rat) was administered via tail vein 2 hr before imaging. For probe blocking experiments, double amounts of the blocking peptide (PEGylated cFLFLF peptide without 99mTc labeling) were injected via tail vein prior to injection of the probe. During injection and imaging, the animals were placed under isoflurane anesthesia. The field of view (FOV) of the SPECT scanner was centered in between two knee joints to capture signals from two joints. The acquisition time for each SPECT projection image was adjusted to compensate for radioactivity decay. Animal body weight was obtained to calibrate the radioactive intensity. A volume of interest (VOI) was defined for quantification of the radioactivity, using only the micro-CT scan such that the researcher was not influenced by the radioactive signal. The reconstructed SPECT and CT images were processed, fused, and analyzed with π.pmode software (3.8 version; PMOD Technologies LLC, Zurich, Switzerland) and the standard uptake value (SUV) of radioactivity within each scan was obtained. Reconstruction of 3D images was also accomplished by the Volview software (Kitware Inc., New York, USA).
Statistical Analysis
All data was reported as mean ± SD, and statistically significant differences between two groups were determined using two-tailed Student’s t-test. Significance was defined by results with p<0.05.
Results
Stimulation of Fpr1 expression and inflammatory responses by LPS in mouse macrophages
Two types of the mouse primary macrophages, PMs and BMMs, were isolated and treated by 100 ng/mL LPS in vitro. Expression of Fpr1 and selected inflammation related genes, including iNOS, TNFα and IL-1β, were determined by quantitative RT-PCR. Production of TNFα and NO in culture medium was measured by the ELISA kit and Griess reagent, respectively. It was found that in PMs, LPS remarkably increased mRNA levels of Fpr1 (Fig. 1a) as well as iNOS, TNFα and IL-1β (Fig. 1b). It also significantly stimulated production of TNFα (Fig. 1c) and NO (Fig. 1d). Similar results were obtained in BMMs stimulated by LPS (Fig. 1e–1g).
Fig. 1. LPS stimulated Fpr1 expression and inflammatory responses in mouse peritoneal macrophages (PMs, a–d) and bone marrow macrophages (BMMs, e–g).
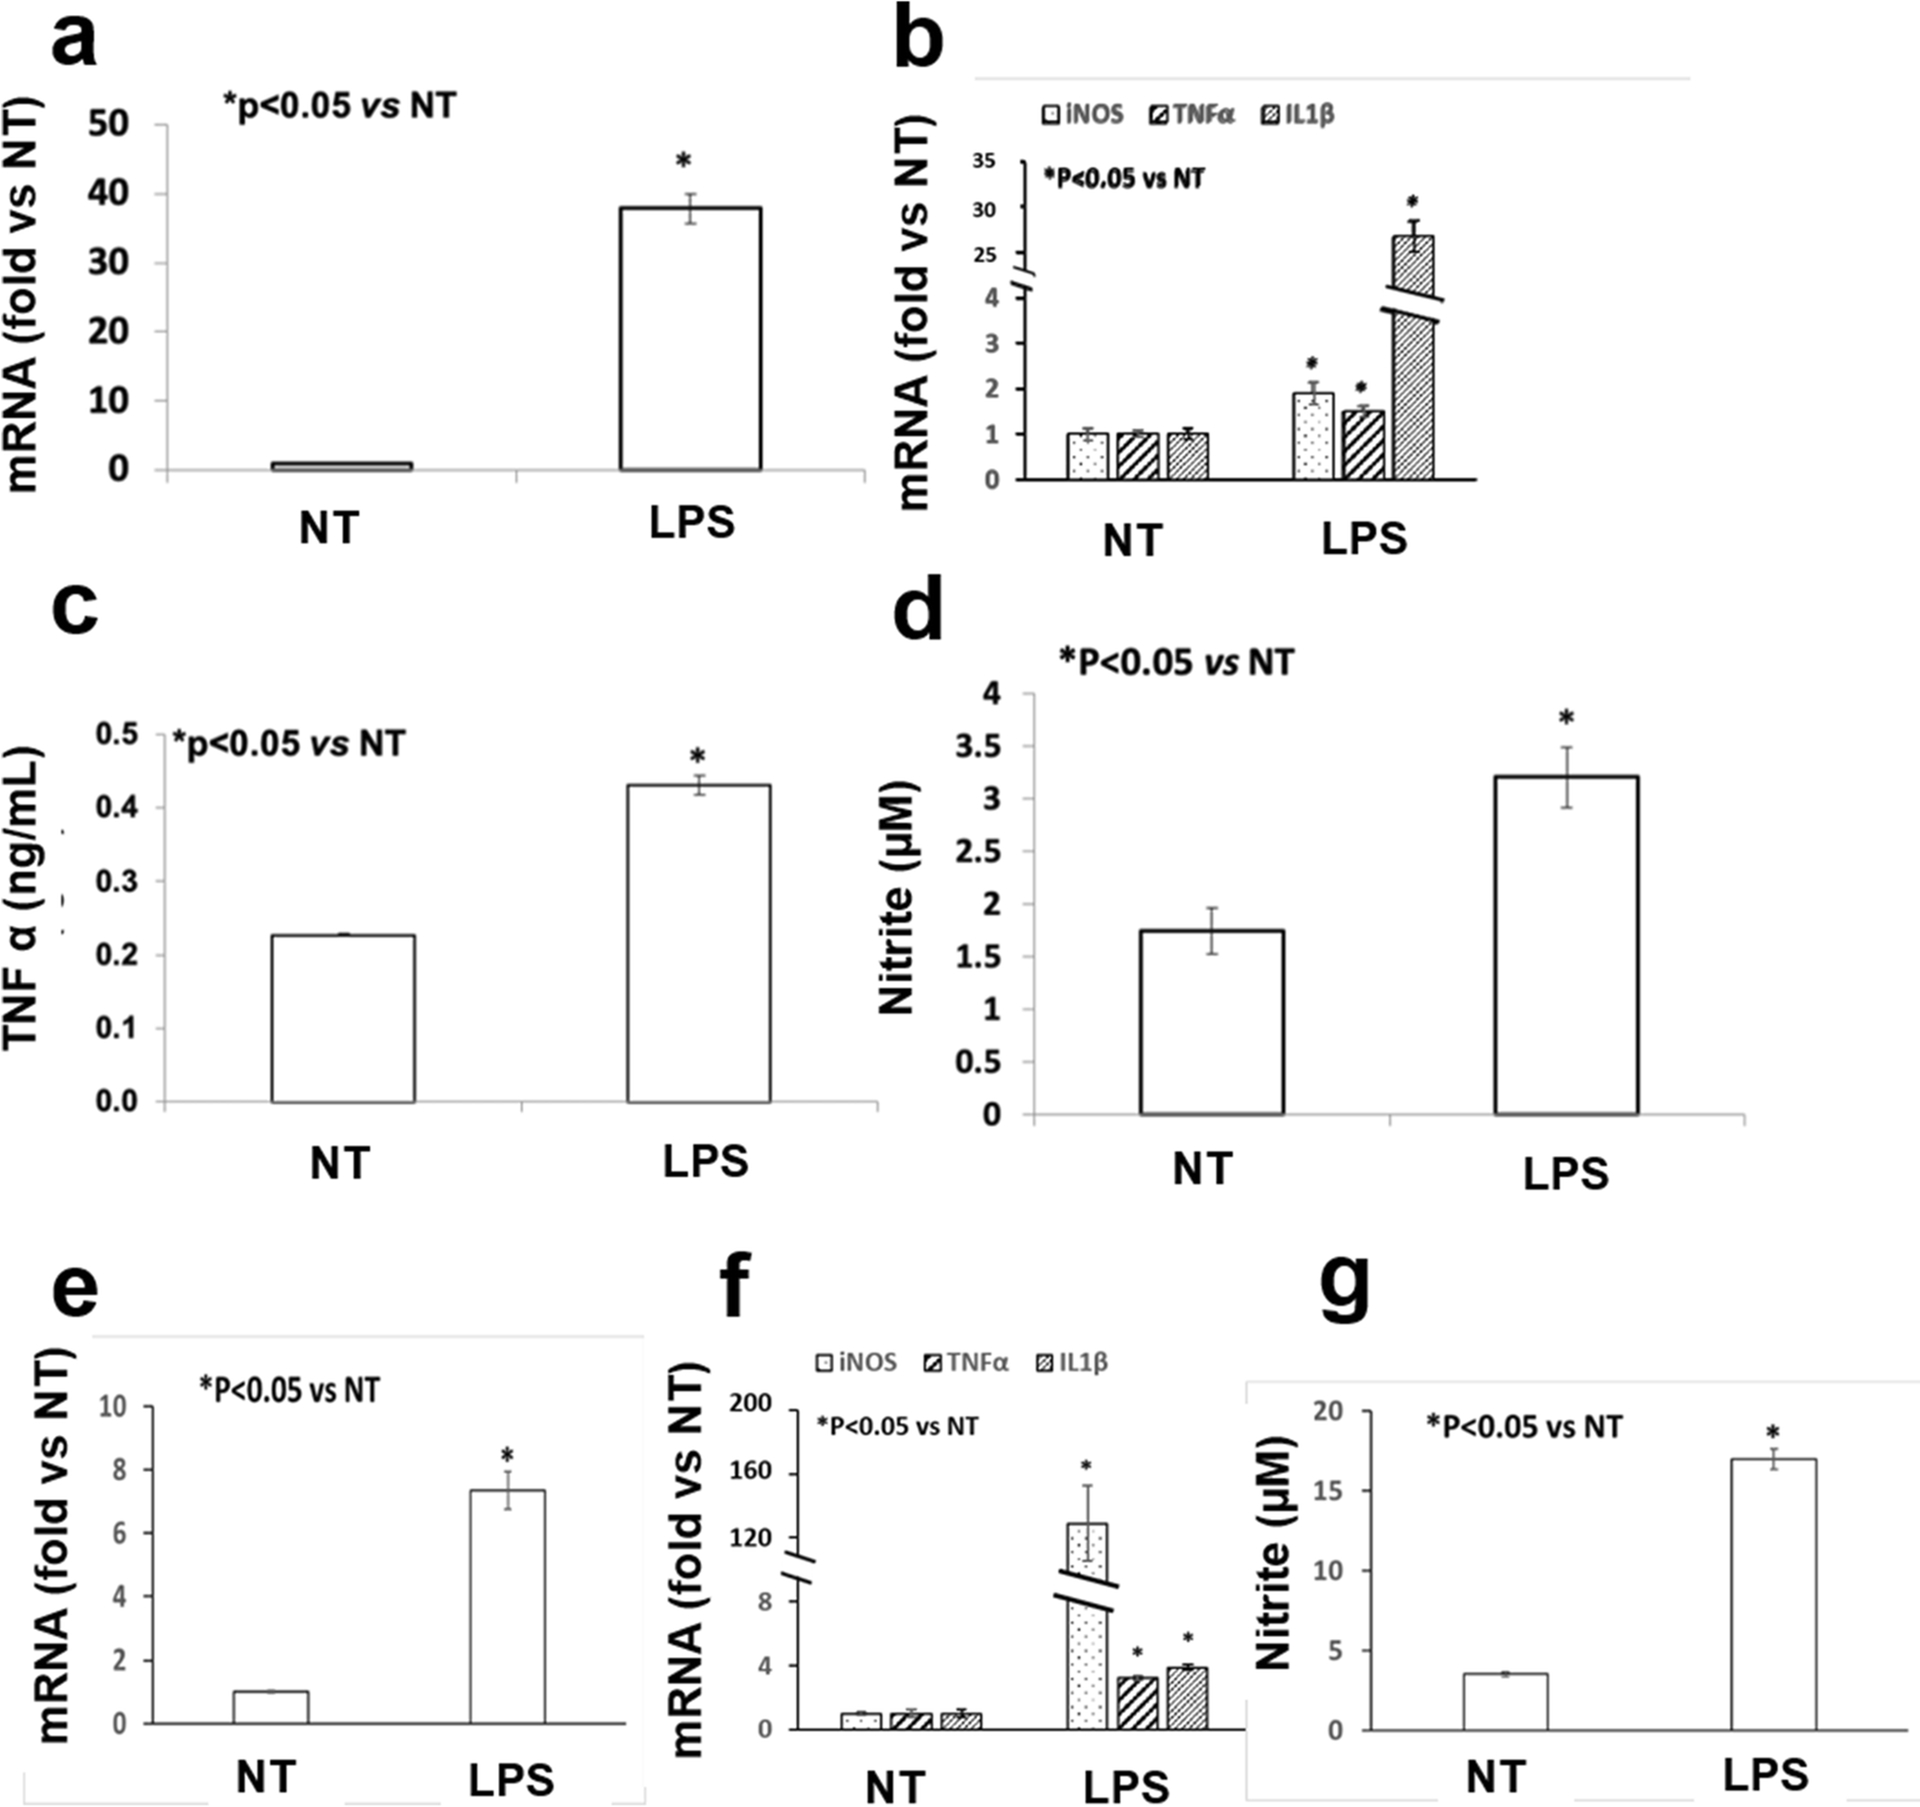
Both PMs and BMMs were treated by 100 ng/mL LPS for 24 h (LPS group) or not (NT group). Cellular mRNA levels of Fpr1 (a, e) and other inflammatory genes including iNOS, TNF α and IL1β (b, f) were measured by the quantitative RT-PCR. The production of TNF α and the nitrite level in the medium were determined by the ELISA kit and Griess reagent, respectively. Four repeats were done for each group in all experiments and each experiment was duplicated.
Degenerative appearance of knee joints after ACLT surgery in mice and rats
Both mice and rats demonstrated degenerative changes in the ACLT knee. After 16 weeks of ACLT surgery in mouse, histological analysis demonstrated the presence of joint degeneration in the injured knee, including reduced hyaline cartilage, erosion of articular cartilage, and formation of ectopic bone (Fig. 2). Occurrence of ectopic bones was also revealed by MRI at the patella, tibia and femur (Fig. 3).
Fig. 2. Safranin O and Fast Green staining of mouse knee joints at week 16 after surgery.
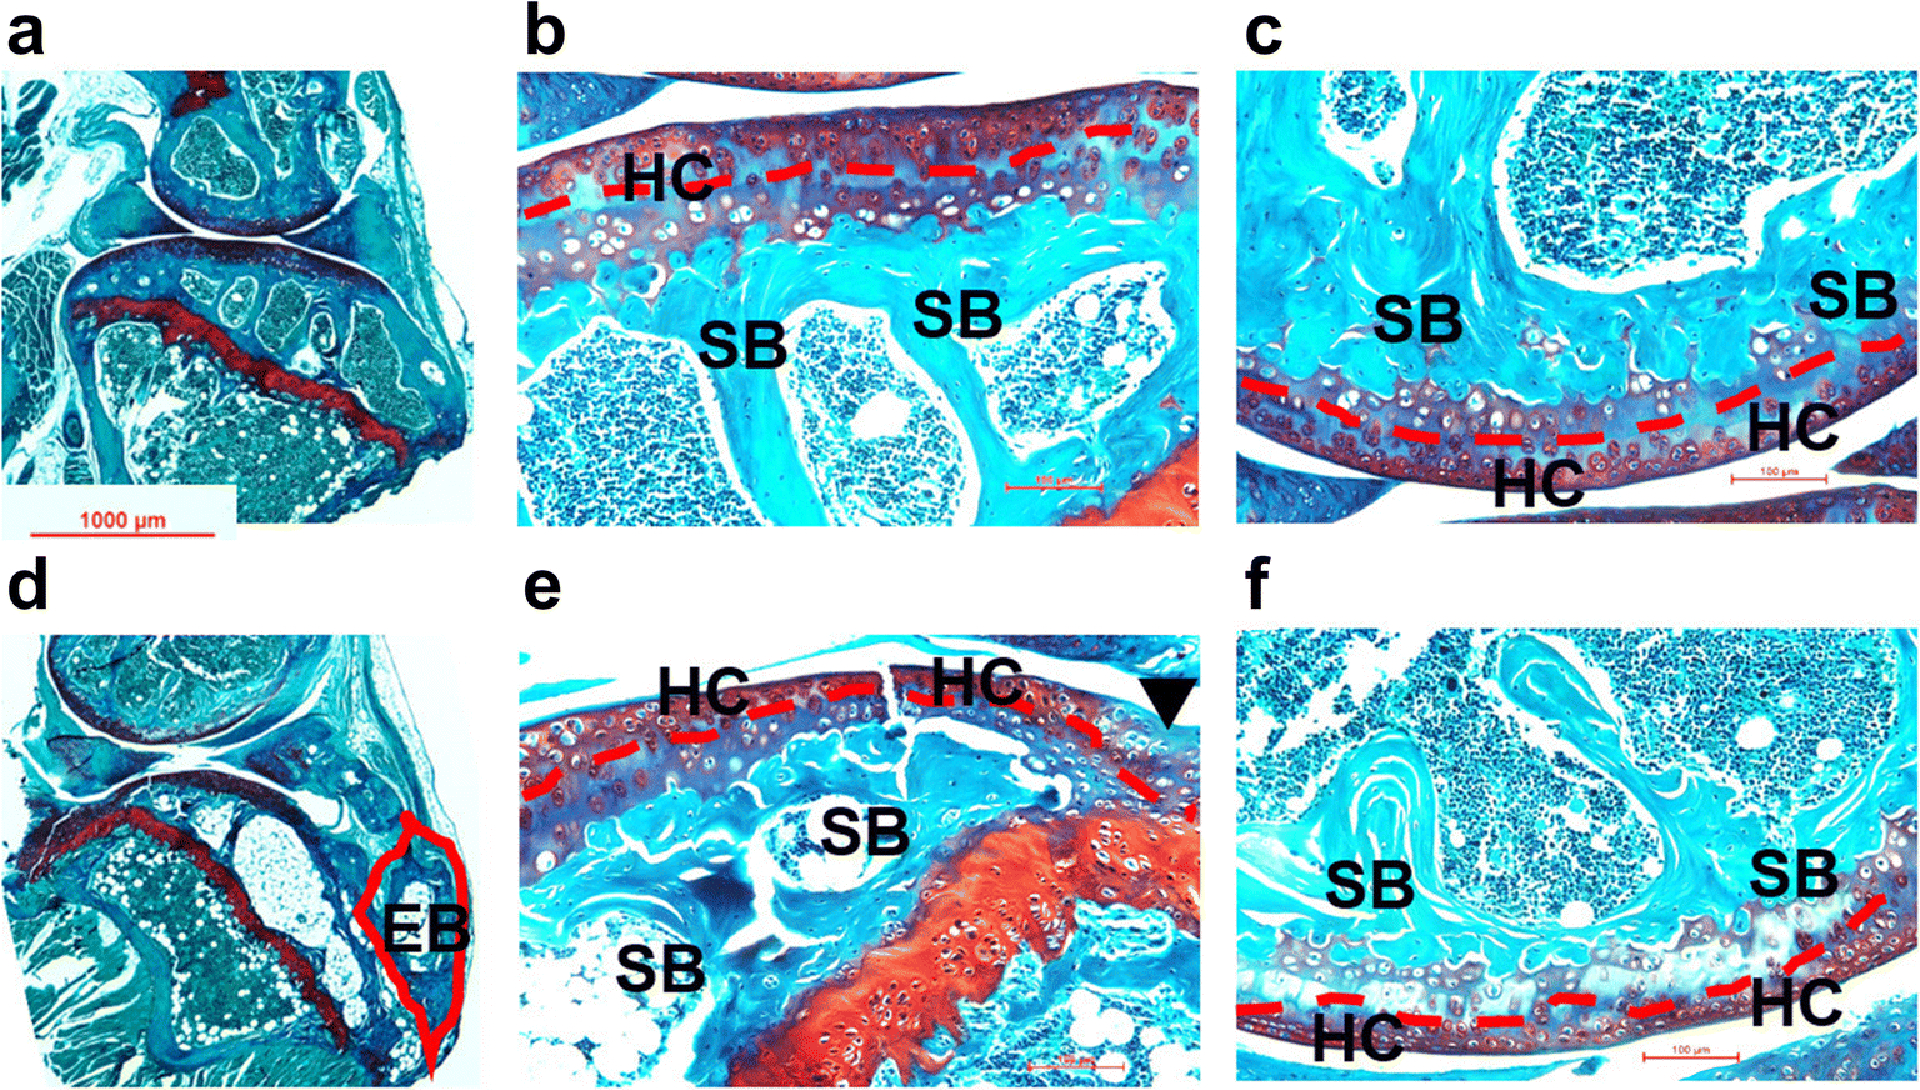
Microphotographs of sham (a: whole joint; b: tibia; c: femur) and ACLT (d: whole joint; e: tibia; f: femur) samples were taken under a microscope. Compared to the sham joints, various degenerative changes were found in ACLT joints, including reduced hyaline cartilage (red dash line), erosion of articular cartilage (black arrow head) and formation of ectopic bone (red line frame). EB: ectopic bone; HC: hyaline cartilage; SB: subchondral bone.
Fig. 3. Representative MRI images of mouse knee joints at week 4 after ACLT surgery.
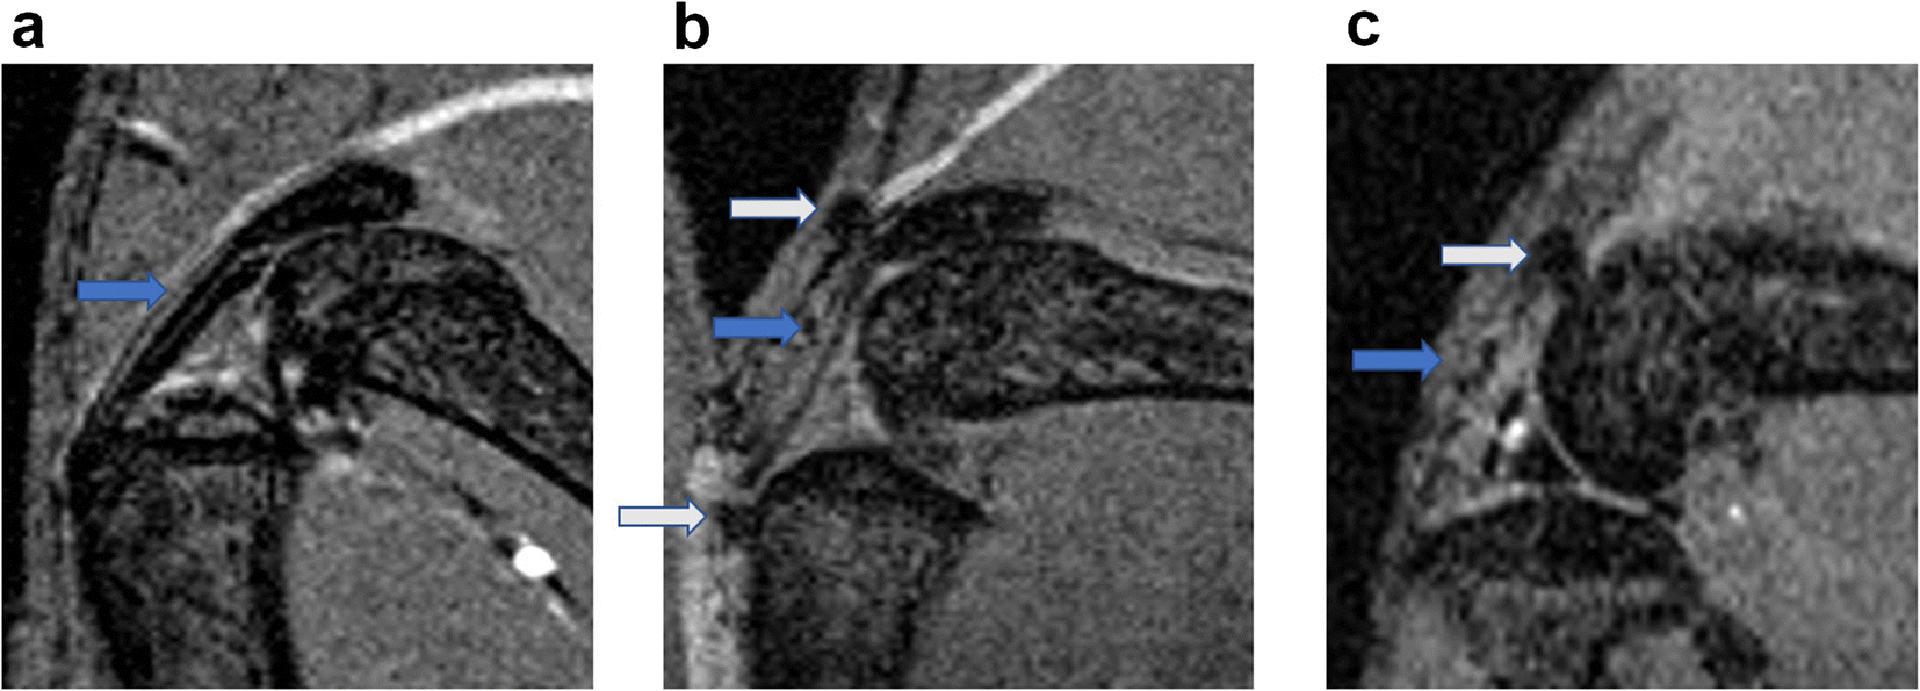
Compared to the sham joints (a), osteophytes were found at different sites of the ACLT joints (b, c), including patella tendon (marked by grey arrow in b), tibia (marked by grey arrow in b) and femur (marked by grey arrow in c).
In rats, the ACLT knee had severe degeneration of the knee joints. Fibroblast-like cells were enriched at a specific region (double arrow) within the synovial membrane of rat ACLT knee joints at 2 months after surgery (Fig. 4b). MicroCT scan and MRI analysis revealed more remarkable changes to the rat ACLT joints at 3 months after surgery, including osteophyte formation (white block arrow in Fig. 4c), and deleterious changes in tibia cartilage (blue arrow in Fig. 4e ), meniscus (red arrow in Fig. 4e), tibia subchondral bone (white arrow in Fig. 4e), and tibia osteophyte formation (white line frame in Fig. 4e).
Fig. 4. Representative images of HE staining of the synovial membrane at month 2 (a, b), as well as microCT (c) and MRI (d, e) analysis at month 3 after ACLT surgery in rat.
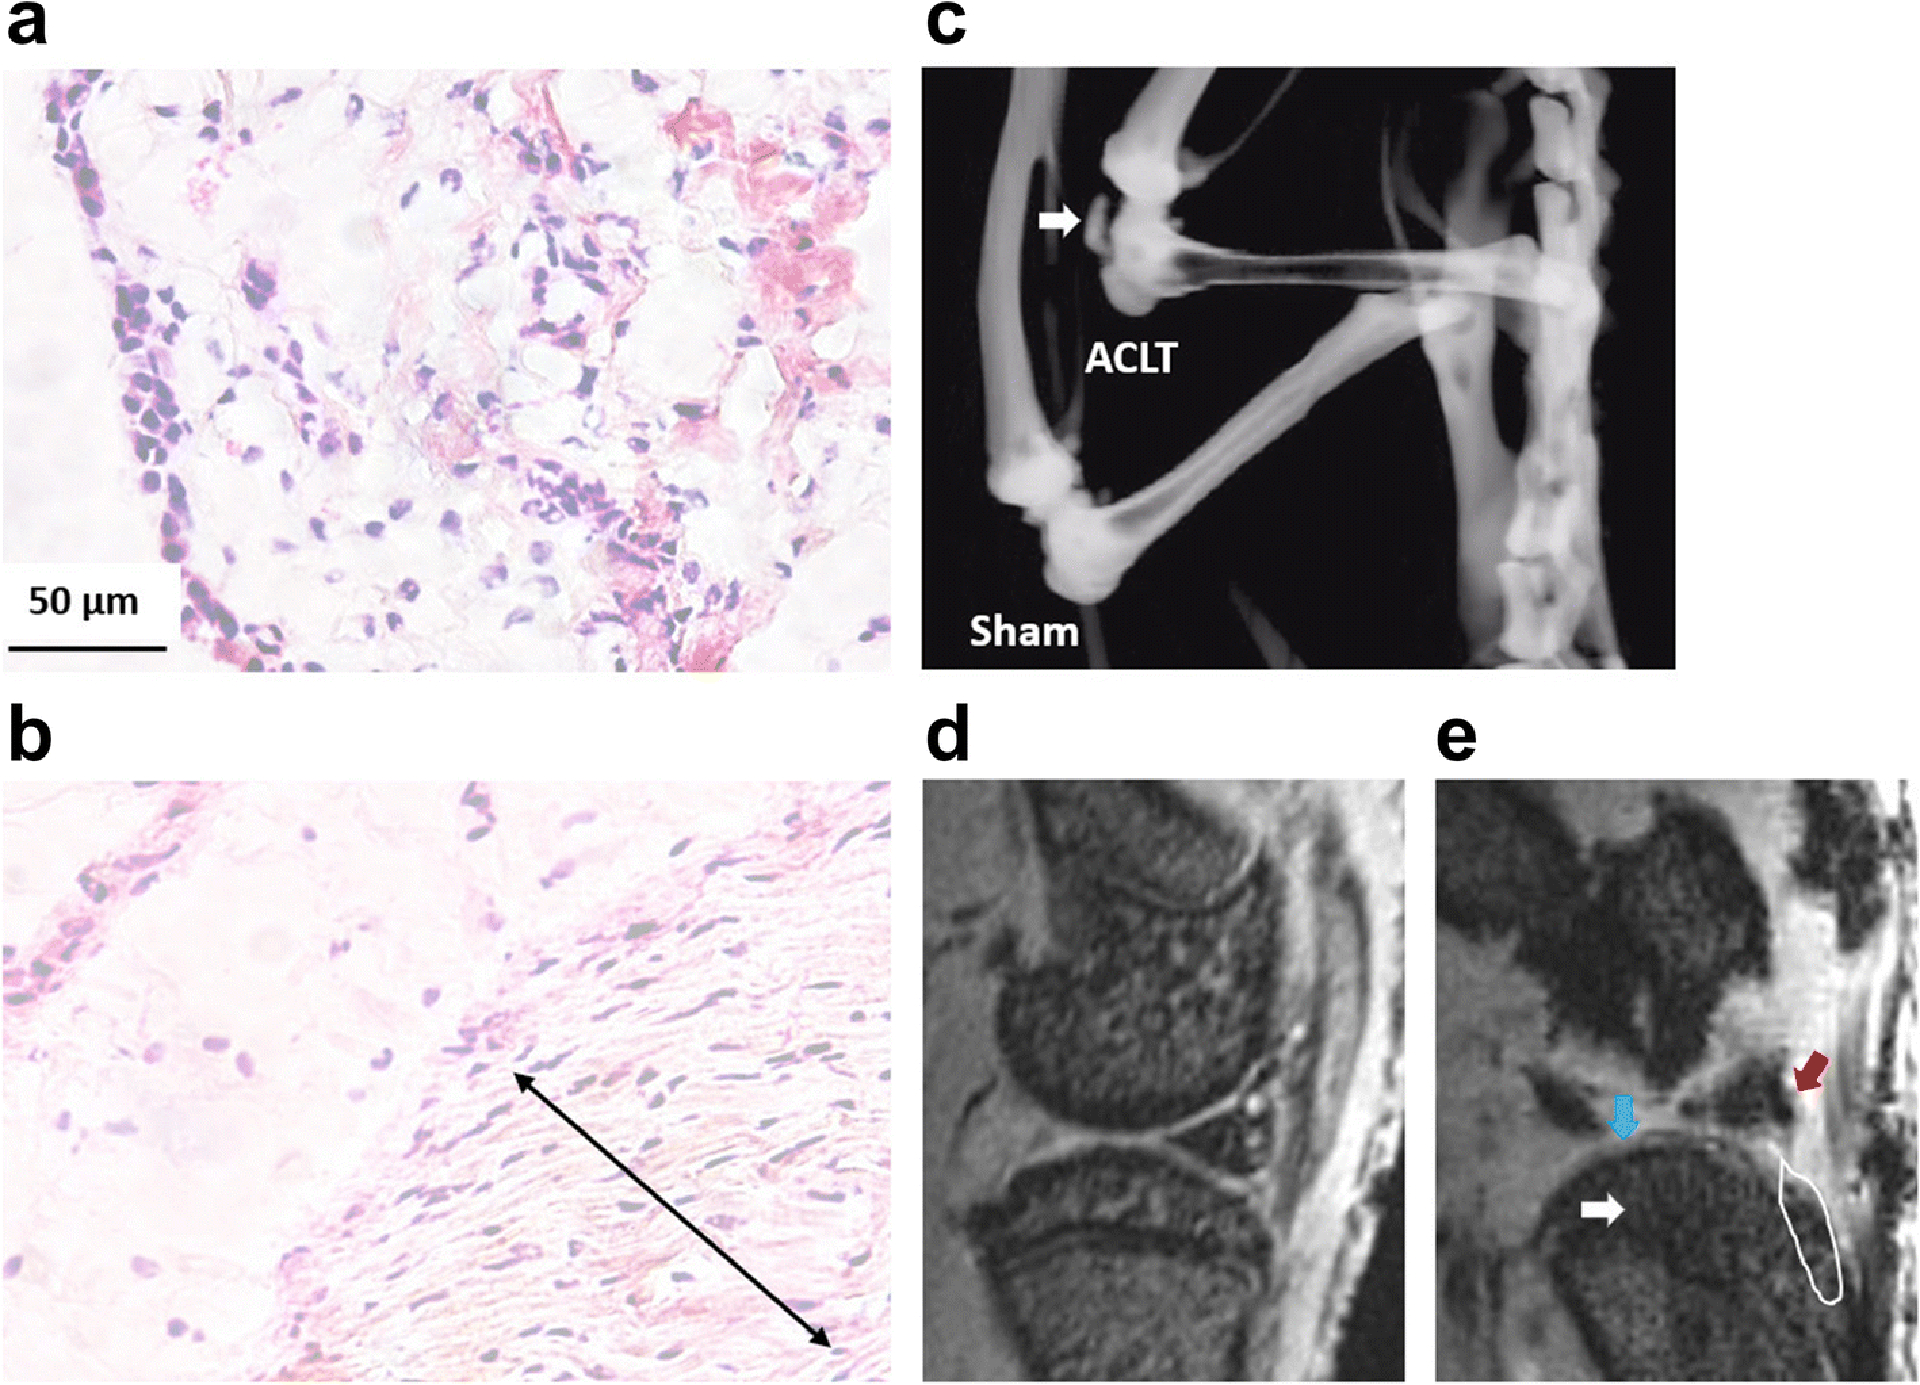
The degenerative changes were seen in the ACLT knee (b, e) compared to the sham knee (a, d), including formation of fibroblast-like cell enriched regions (double arrow in b) within the synovial membrane, osteophyte formation within the joint (white arrow in c and white line frame in e), and structural damages in tibia cartilage (blue arrow in e ), meniscus (red arrow in e) and tibia subchondral bone (white arrow in c).
Enhancement of SPECT signal within knee joints after ACLT surgery in mice and rats
In mouse, SPECT analysis using [99mTc]cFLFLF was done at week 1, 2, 5, and 11 post-surgery (Fig. 5). It was found that ACLT surgery produced much stronger signal (red arrowhead) from the probe than the sham (blue arrowhead) at week 1 (Fig. 5a), as well as week 2 (Fig. 5c) and 5 (Fig. 5d). The signal appeared to decrease with OA progression by comparing week 11 (Fig. 5b) with week 2 post-ACLT (Fig. 5a). At week 1 post OA induction, the SUV of the SPECT signal within the joint was 5.44 ± 1.00 from the ACLT surgery, compared to 3.66 ± 0.76 from the sham operation (P<0.05, Fig. 5c). The probe blocking experiment was accomplished by injection of a mixture of the radioactive probe with its 100 fold dose of the non-radiolabeled peptide. The SUV ratio of (ACLT-Sham)/Sham was found to sharply decrease from 1.30 of the non-block group to 0.08 of the block group (P<0.05, Fig. 5d). The SPECT signal was also determined in a rat model (Fig. 6). The signal from the ACLT joint increased remarkably and was distinguished from the sham joint at 7 weeks post ACLT. This can be seen in the representative 3D images from one animal (Fig. 6a) and a quantitative analysis of 4 animals (Fig. 6b). The SUVs from the ACLT and sham knees were 14.16 ± 1.93 and 8.44 ± 0.82, respectively (P<0.05, Fig. 6b).
Fig. 5. SPECT signals within the knee joints of mice with ACLT surgery and sham operation using [99mTc]cFLFLF.
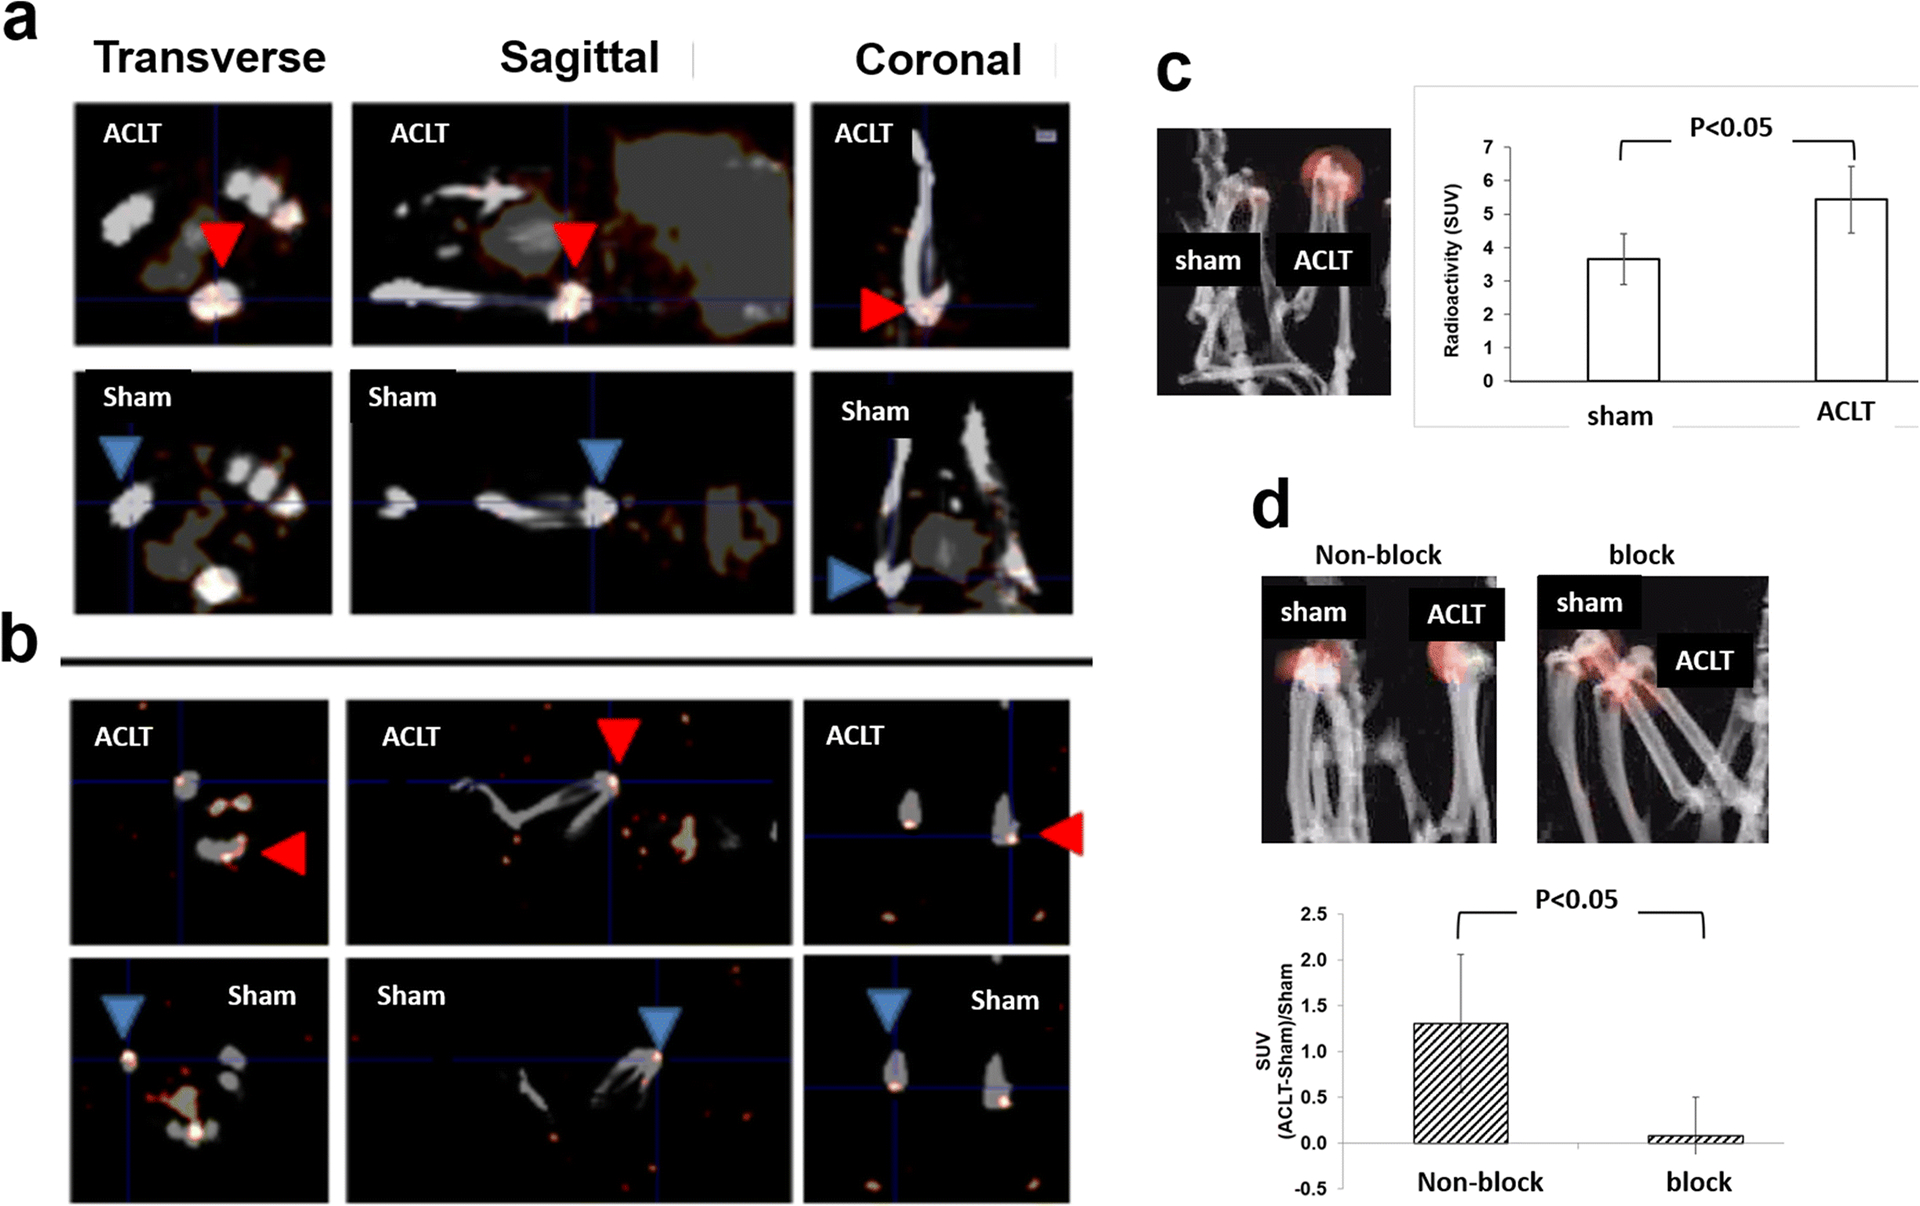
Representative 2D SPECT images show that ACLT surgery produced much stronger signal (red arrowhead) from the probe than the sham (blue arrowhead) at week 2 (a) and 11 (b) post-surgery. In addition, the SPECT signals from 4 mice/group were quantified at week 1 (c) and 5 (d) post-surgery, and a representative reconstructed 3D image is also displayed from each group.
Fig. 6. SPECT signals within the knee joints of rats with ACLT surgery and sham operation using [99mTc]cFLFLF.
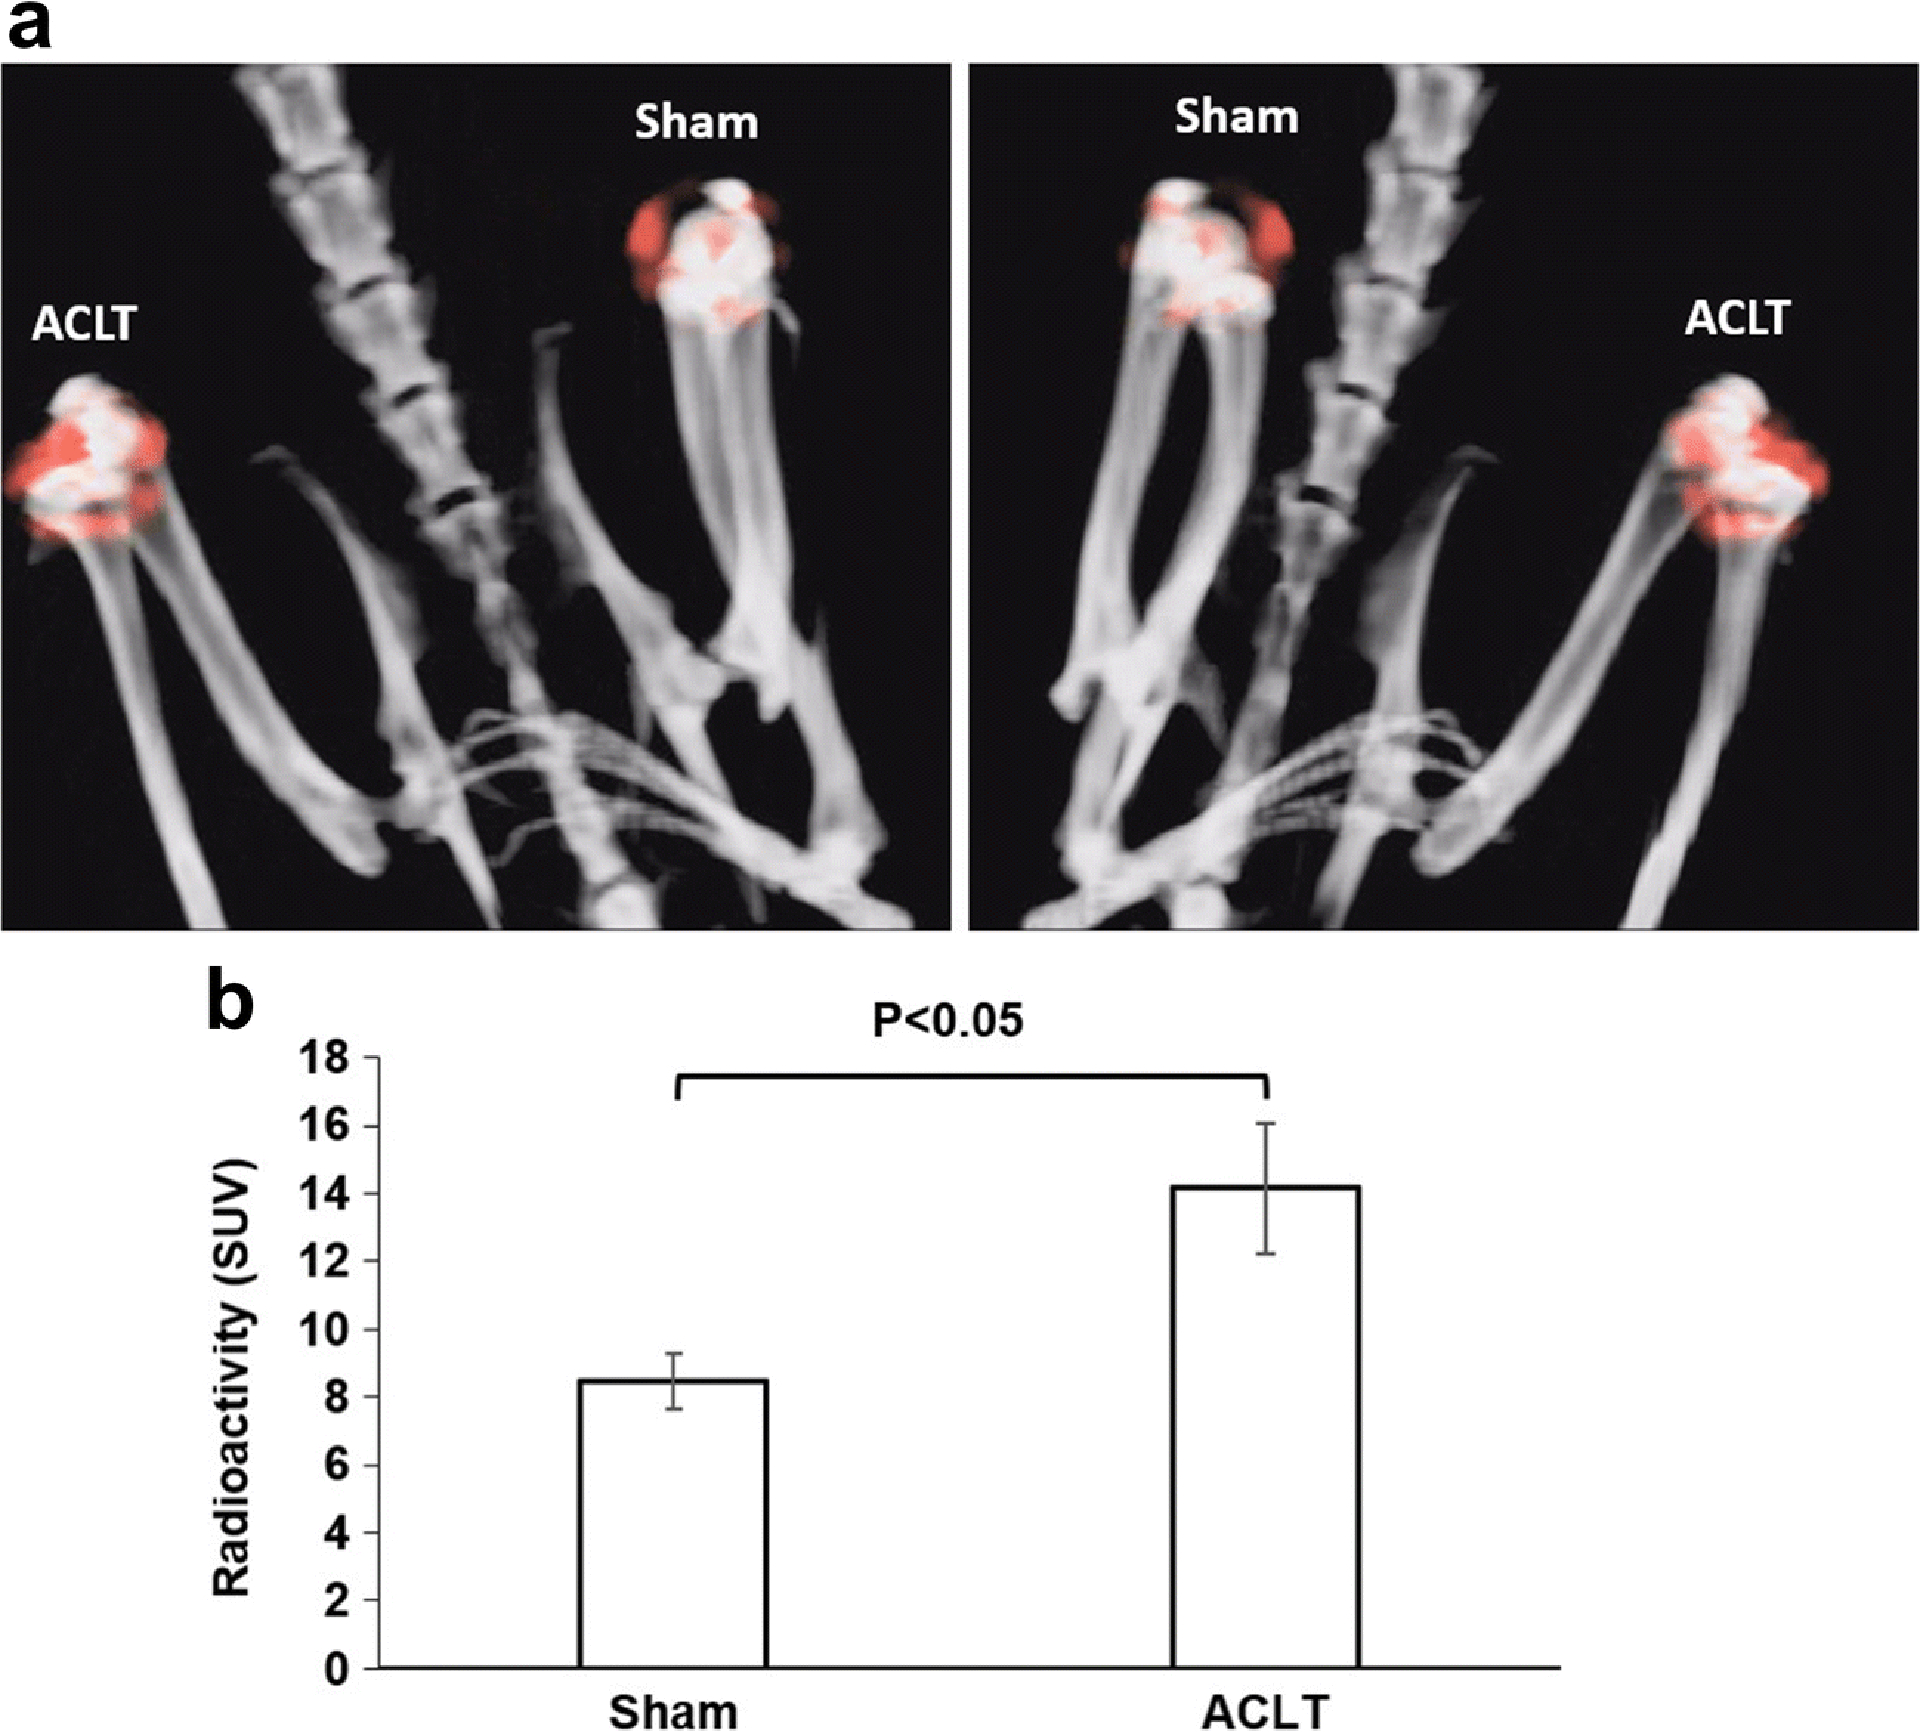
SPECT/CT was performed using the probe cFLFLF-PEG-99mTc at 7 weeks after surgery. (a) Representative reconstructed 3D images from one animal. The left and right images show views of one rat at two opposite locations. (b) Quantitative analysis of the SPECT signals determined by the standard uptake values (SUV) from 4 rats.
Discussion
In this study, we established a positive correlation of Fpr1 expression with macrophage activation and sequentially utilized an ACLT surgery knee OA model, a cFLFLF-PEG-HYNIC- 99mTc probe, and SPECT imaging to develop an inflammation specific imaging modality for disease activity in OA. The experimental data from histology, microCT and MRI imaging revealed that the ACLT knee model in both mice and rats was effective, resulting in deleterious changes in cartilage, meniscal erosion, and osteophyte formation. In mice and rats, the SPECT signal in the ACLT knee was significantly increased and could be distinguished from the sham knee, indicating that the probe was able to detect the infiltration of immune cells into the injured site. These findings point to a novel imaging modality of SPECT for detection of osteoarthritis inflammation with the potential for clinical application.
The current clinical standard is to use radiography, MRI, or ultrasound imaging techniques to determine an OA diagnosis. Radiography is often the first choice to identify structural characteristics of OA, but its inability to image soft tissue and the functional aspect of inflammation limits its application in synovitis, a primary trigger of OA pathogenesis [8, 9]. Functional MRI has great potential to provide noninvasive imaging biomarkers for osteoarthritis, such as glycosaminoglycan content and collagen organization in joint structures, but it is not currently able to identify specific inflammatory markers at the molecular and cellular level [22, 23].
Despite no specific molecular or cellular target, MRI does have a role in OA and a recent meta-analysis evaluated MRI as a tool to visualize synovitis for detection of OA [24]. They found that non-contrast enhanced MRI is unable to distinguish synovitis from effusion, as both are hyperintense with fluid-sensitive sequences. Contrast-enhanced (CE) MRI may distinguish synovitis, with imaging revealing a thickened synovial membrane. However, there is only a weak positive correlation coefficient of 0.41 between CE-MRI and inflammatory infiltrates in synovial tissues [24]. This weak correlation and the need for intravenous contrast in the setting of longitudinal assessment over extensive follow-up does not make CE-MRI an ideal imaging modality for identification of early stages of OA [23, 24].
There still remains no clinical non-invasive imaging modality that can identify specific inflammatory markers for detection of early OA. To address this critical need, we first utilized in vitro experiments in PMs and BMMs to detect the expression of inflammatory phenotypes, which represent potential probe targets. In both PMs and BMMs the mRNA expression of Fpr1 was remarkably increased in the presence of LPS, as well as iNOS, TNFα, and IL-1β (Fig. 1). This strong positive correlation between Fpr1 expression and macrophage-mediated inflammation, which has been implicated in OA pathogenesis [7], confirmed that Fpr1 is a viable target for the cFLFLF-PEG- HYNIC- 99mTc probe to detect OA disease activity via SPECT.
In vivo studies were then performed in both mice and rats. The ACLT surgery model of OA was confirmed via histology, microCT and MRI. Histology revealed OA characteristics such as reduced hyaline cartilage, erosion of cartilage and osteophyte formation. MicroCT and MRI analysis further demonstrated degenerative changes in the joint structures including osteophyte formation and deleterious changes in the synovial membrane, cartilage, subchondral bone and meniscus (Figs. 2–4). These results demonstrated a successful induction of OA in the animal models.
The SPECT signal intensity from the probe was remarkably stronger in the ACLT knee when compared to the sham knee in mice at week 1, 2, and 5 (Fig. 5) and rats at week 7 post surgery (Fig. 6), indicating the probe can effectively detect OA-related inflammation within the knee. The macrophages in the inflamed area were the main target of the imaging probe. This is evidenced by findings in our previous report that showed that the inflamed area recognized by the peptide cFLFLF was identical to where macrophages resided in the synovial membrane of the knee joint in the rat MIA-induced OA [15]. Additionally, when blocked with a non-labeled peptide of 100 folds dose equivalent to the radio-active probe, the (ACLT-Sham)/Sham ratio sharply decreased, indicating a high specificity of the tested SPECT probe (Fig. 5). It is important to note that in the mouse model the ratio of signal intensity (ACLT/sham) decreased with OA progression (Fig. 5).
The early distinguishable ACLT signal and the decline of ACLT/sham signal ratio during OA progression suggest the primary role of this imaging modality is in the early stages of OA. During this early period in the pathogenesis of OA the disease activity and inflammation may be high, yet the structural changes found later in the pathogenesis of OA via radiography and MRI may not be present. Thus, this technique may be able to identify patients earlier in the OA progression than purely anatomical imaging, the current clinical standard for diagnosing OA. This would allow early appropriate interventions that can potentially improve the long-term outcomes of OA patients.
The SPECT technique described in this study has greater clinical potential than our previous study utilizing the probe cFLFLF-PEG-64Cu and PET that was able to identify inflammation in OA induced by MIA [15]. The previous study used an MIA model, which is a fast-progressing, biochemically induced model of OA. MIA has limitations as a metabolic poison and produces extensive chondrocyte death, unlike human OA. In this study we selected an ACLT model, which is a slow-progressing, surgically induced biomechanical model that is closer to the pathogenesis of human OA and presumably mimics the disease state progression. For greater clinical imaging potential, we utilized SPECT imaging as it is more widely available and less expensive to use than PET. However, to translate this cFLFLF-PEG-99mTc/SPECT imaging technique to humans there may be additional considerations such as pharmacokinetics and safety of the cFLFLF-PEG-HYNIC-99mTc probe prior to clinical use.
Conclusions
The radioactive probe cFLFLF-PEG-HYNIC -99mTc and SPECT imaging is effective for detecting and monitoring inflammation during OA progression by targeting Fpr1 expressed in the inflammatory cells within the knee joint. This provides a novel imaging modality for OA disease activity with the potential to be used in clinic.
Acknowledgements
The work supported by the NIH/NIAMS grant No. 5R21AR070987 and the Seed Grant Program sponsored by University of Virginia Center for Engineering in Medicine No. LC00182.
Footnotes
Publisher's Disclaimer: This Author Accepted Manuscript is a PDF file of a an unedited peer-reviewed manuscript that has been accepted for publication but has not been copyedited or corrected. The official version of record that is published in the journal is kept up to date and so may therefore differ from this version.
Conflict of interest statement
All authors have no conflict of interest to declare.
References
- 1.Wirth W, Nevitt M, Hellio Le Graverand M-P, et al. (2014) Lateral and medial joint space narrowing predict subsequent cartilage loss in the narrowed, but not in the non-narrowed femorotibial compartment--data from the Osteoarthritis Initiative. Osteoarthr Cartil 22:63–70. [DOI] [PMC free article] [PubMed] [Google Scholar]
- 2.Kwoh CK (2013) Clinical relevance of bone marrow lesions in OA. Nature Reviews Rheumatology 9:7–8. [DOI] [PubMed] [Google Scholar]
- 3.Baum T, Joseph GB, Karampinos DC, et al. (2013) Cartilage and meniscal T2 relaxation time as non-invasive biomarker for knee osteoarthritis and cartilage repair procedures. Osteoarthr Cartil 21:1474–1484. [DOI] [PMC free article] [PubMed] [Google Scholar]
- 4.Binks DA, Bergin D, Freemont AJ, et al. (2014) Potential role of the posterior cruciate ligament synovio-entheseal complex in joint effusion in early osteoarthritis: a magnetic resonance imaging and histological evaluation of cadaveric tissue and data from the Osteoarthritis Initiative. Osteoarthr Cartil 22:1310–1317. [DOI] [PMC free article] [PubMed] [Google Scholar]
- 5.Park H-J, Kim SS, Lee S-Y, et al. (2013) A practical MRI grading system for osteoarthritis of the knee: association with Kellgren-Lawrence radiographic scores. Eur J Radiol 82:112–117. [DOI] [PubMed] [Google Scholar]
- 6.Haseeb A, Haqqi TM (2013) Immunopathogenesis of osteoarthritis. Clin Immunol 146:185–196. [DOI] [PMC free article] [PubMed] [Google Scholar]
- 7.Kandahari AM, Yang X, Dighe AS, et al. (2015) Recognition of Immune Response for the Early Diagnosis and Treatment of Osteoarthritis. J Immunol Res 2015:192415. [DOI] [PMC free article] [PubMed] [Google Scholar]
- 8.Sokolove J, Lepus CM (2013) Role of inflammation in the pathogenesis of osteoarthritis: latest findings and interpretations. Ther Adv Musculoskelet Dis 5:77–94. [DOI] [PMC free article] [PubMed] [Google Scholar]
- 9.de Lange-Brokaar BJE, Ioan-Facsinay A, van Osch GJVM, et al. (2012) Synovial inflammation, immune cells and their cytokines in osteoarthritis: a review. Osteoarthr Cartil 20:1484–1499. [DOI] [PubMed] [Google Scholar]
- 10.Braun HJ, Gold GE (2012) Diagnosis of osteoarthritis: imaging. Bone 51:278–288. [DOI] [PMC free article] [PubMed] [Google Scholar]
- 11.Bondeson J, Blom AB, Wainwright S, et al. (2010) The role of synovial macrophages and macrophage-produced mediators in driving inflammatory and destructive responses in osteoarthritis. Arthritis Rheum 62:647–657. [DOI] [PubMed] [Google Scholar]
- 12.Smith MD, Triantafillou S, Parker A, et al. (1997) Synovial membrane inflammation and cytokine production in patients with early osteoarthritis. J Rheumatol 24:365–371 [PubMed] [Google Scholar]
- 13.Migeotte I, Communi D, Parmentier M (2006) Formyl peptide receptors: a promiscuous subfamily of G protein-coupled receptors controlling immune responses. Cytokine Growth Factor Rev 17:501–519. [DOI] [PubMed] [Google Scholar]
- 14.Babich JW, Tompkins RG, Graham W, et al. (1997) Localization of radiolabeled chemotactic peptide at focal sites of Escherichia coli infection in rabbits: evidence for a receptor-specific mechanism. J Nucl Med 38:1316–1322 [PubMed] [Google Scholar]
- 15.Yang X, Chordia MD, Du X, et al. (2016) Targeting formyl peptide receptor 1 of activated macrophages to monitor inflammation of experimental osteoarthritis in rat. J Orthop Res 34:1529–1538. [DOI] [PubMed] [Google Scholar]
- 16.Poole R, Blake S, Buschmann M, et al. (2010) Recommendations for the use of preclinical models in the study and treatment of osteoarthritis. Osteoarthritis and Cartilage 18:S10–S16. [DOI] [PubMed] [Google Scholar]
- 17.Chen J, Cheng H, Dong Q, et al. (2015) [99mTc]cFLFLF for Early Diagnosis and Therapeutic Evaluation in a Rat Model of Acute Osteomyelitis. Mol Imaging Biol 17:337–344. [DOI] [PubMed] [Google Scholar]
- 18.Shannon AH, Chordia MD, Spinosa MD, et al. (2020) Single-Photon Emission Computed Tomography Imaging Using Formyl Peptide Receptor 1 Ligand Can Diagnose Aortic Aneurysms in a Mouse Model. Journal of Surgical Research 251:239–247. [DOI] [PMC free article] [PubMed] [Google Scholar]
- 19.Pei Y, Cui F, Du X, et al. (2019) Antioxidative nanofullerol inhibits macrophage activation and development of osteoarthritis in rats. Int J Nanomedicine 14:4145–4155. [DOI] [PMC free article] [PubMed] [Google Scholar]
- 20.Crane DD, Ireland R, Alinger JB, et al. (2013) Lipids Derived from Virulent Francisella tularensis Broadly Inhibit Pulmonary Inflammation via Toll-Like Receptor 2 and Peroxisome Proliferator-Activated Receptor α. Clin Vaccine Immunol 20:1531–1540. [DOI] [PMC free article] [PubMed] [Google Scholar]
- 21.Stoop R, Buma P, van der Kraan PM, et al. (2001) Type II collagen degradation in articular cartilage fibrillation after anterior cruciate ligament transection in rats. Osteoarthr Cartil 9:308–315. [DOI] [PubMed] [Google Scholar]
- 22.Ding C, Zhang Y, Hunter D (2013) Use of imaging techniques to predict progression in osteoarthritis. Curr Opin Rheumatol 25:127–135. [DOI] [PubMed] [Google Scholar]
- 23.Juras V, Chang G, Regatte RR (2020) Current status of functional MRI of osteoarthritis for diagnosis and prognosis. Curr Opin Rheumatol 32:102–109. [DOI] [PMC free article] [PubMed] [Google Scholar]
- 24.Yao H, Xu J, Wang J, et al. (2020) Combination of magnesium ions and vitamin C alleviates synovitis and osteophyte formation in osteoarthritis of mice. Bioact Mater 6:1341–1352. [DOI] [PMC free article] [PubMed] [Google Scholar]


