

Abstract
Microalgae cultivation for exopolysaccharide production has getting more attention as a result of their high hydrocarbon biosynthesis skill. The aim of this study is to examine the exopolysaccharide production potential of different species of microalgae. In this context, exopolysaccharides were produced from Chlorella minutissima, Chlorella sorokiniana and Botryococcus braunii microalgae and the effects of carbon and nitrogen content in the growth medium and illumination time on exopolysaccharide production were analyzed statistically using Box-Behnken experimental design. In addition, techno-economic assessment of exopolysaccharide production were also performed by using the most productive microalgae and optimum conditions determined in this study. As a result of the experiments, it was seen that C. minutissima, C. sorokiniana and B. braunii produced 0.245 ± 0.0025 g/L, 0.163 ± 0.0016 g/L and 0.117 ± 0.0007 g/L exopolysaccharide, respectively. Statistically, it was observed that there was an inverse relationship between the exopolysaccharide production and investigated parameters such as illumination period and carbon and nitrogen amounts of culture mediums. The techno-economic assessment comprising microalgal exopolysaccharide (EPS) bioprocess was carried out, and it showed that the system can be considered economically viable, yet can be improved with biorefinery approach.
Keywords: Exopolysaccharide, Microalgae, Bioprocess, Chlorella minutissima, Chlorella sorokiniana, Botryococcus braunii
Introduction
Exopolysaccharides (EPSs) are biopolymers that are encapsulated in the cell surface of microorganisms or synthesized out of the cell. Their main tasks are to ensure the adhesion and protection of cells. Microbial EPSs protect cells against drying, osmotic stress, toxic components, phagocytosis and phage attacks. They also contribute to the recognition of cells and biofilm formation [1]. EPSs have many important technological and physiological features to be utilized in the food industry safely. In the literature, it is stated that there are many species of microorganisms producing EPS [2]. These microorganisms are bacteria such as Bacillus spp., Pseudomonas spp., and Lactobacillus spp. [3]; fungus such as Aspergillus niger and Fusarium solani [4]; and microalgae such as Dunaliella salina and Chlorella vulgaris [5].
Among the EPSs-producing microorganisms, microalgae are prokaryotic or eukaryotic microorganisms which can perform photosynthesis and contain high lipid and carbohydrate contents. Microalgae are used in a variety of applications because they grow quickly and easily and have a diverse chemical composition. While microalgae are commonly used to produce biofuels like biodiesel and bioethanol, recently, they have been investigated for the development of functional materials in the pharmaceutical and food industries [6–8]. When their physiological properties are explored, it can be seen that microalgae can synthesize structural forms such as polysaccharides, intracellular polysaccharides, and EPSs like other microorganisms [9]. Today, EPSs are the most prominent polysaccharides used in the food industry to enhance rheological and textural properties of food. Especially, EPS–producing lactic acid bacteria are evaluated in the production of fermented milk products, and EPSs become an alternative for other commercial food additives by enhancing stabilization and increasing viscosity and water holding capacity [10]. Furthermore, studies have shown that EPSs produced by lactic acid bacteria have anti-tumor and anti-ulcer activity, and can lower the cholesterol [11]. Similar to lactic acid bacteria, microalgae produce non-toxic EPS, and it has been discovered that microalgal EPS have anti-coagulant, anti-viral, anti-oxidant, anti-tumor and immune system–regulating properties [5]. There are numerous studies related to microalgal EPS production in the literature. Li et al. investigated Microcystis aeruginosa growth and EPS production from this cyanobacteria in their study [12]. Bafana [13], Gaignard et al. [14], and Halaj et al. [15] studied EPS production from Chlamydomonas reinhardtii, Flintiella sanguinaria, and Dictyosphaerium sp. microalgae, respectively.
Techno-economic assessment is a method that enables the design, modelling and economical analysis of a process or service [6]. Techno-economic assessment is a useful method for evaluating various bioprocesses such as biofuel production and obtaining valuable chemicals from biomass [16]. Engineering design, technical information, costs and profits can be gathered with this method. It can provide support not only for a long-term business decision, but also for on-going process and improvement [6]. Thomassen et al. conducted a techno-economic analysis of the production of β-carotene and astaxanthin from Dunaliella salina and Haematococcus pluvialis microalgae [17]. Davis et al. [18], Hoffman et al. [19], Juneja and Murthy [20], and Zamalloa et al. [21] studied microalgal biofuel production with a techno-economic approach.
Efficient and expedient structured methodology is provided by experimental design. With the minimum amount of materials, resources and time, it helps to understand the results of the process. A statistical assessment requires statistical modelling or ANOVA to interpret the data. Statistical assessment also gives information about the interactions between the variables [22]. For this reason, in this study, the potential of EPS production from Chlorella minutissima, Chlorella sorokiniana and Botryococcus braunii which are promising microalgae was compared, and the parameters such as effect of carbon amount and nitrogen amount in culture mediums and illumination time on microalgal EPS production were investigated statistically.
Materials and methods
Microalgae cultivation and EPS production
Chlorella sorokiniana (CS), Botryococcus braunii (BB) and Chlorella minutissima (CM) microalgae, obtained from the Culture Collection of Algae at Göttingen University (Goettingen, Germany) and Algal Biotechnology and Bioprocess Laboratory of Yildiz Technical University, were selected as a promising source for the production of EPSs due to their high content of naturally excreted sugars. The selected microalgae strains were grown in BG-11 medium containing the following chemicals: NaNO3 (1.5 g/L), K2HPO4 (0.04 g/L), MgSO4.7H2O (0.075 g/L), CaCl2.2H2O (0.036 g/L), citric acid (0.006 g/L), ammonium ferric citrate (0.006 g/L), Na2.EDTA (0.001 g/L), Na2CO3 (0.02 g/L), and trace elements (B, Mn, Zn, Mo, Cu, and Co) [23]. These microalgae species were grown in 250-mL Erlenmeyer flasks at the temperature of 25 ± 2 °C under continuous white illumination (8000 lx) for 15 days. The cell density was monitored using a UV–visible spectrophotometer (PG Instruments T60, UK). A standard curve for biomass (g/L) vs. absorbance (750 nm) was made by using diluted samples from each concentrated microalgae cultures [24]. After the cultivation, microalgae cells were harvested by centrifugation for EPS extraction and characterization. All the cultivation experiments were performed in triplicate. During the cultivation, the doubling time (td) and the growth rate (µ) of microalgae cultures were determined with Eq. (1) and Eq. (2), respectively:
| 1 |
| 2 |
where OD0 is the optical density on the initial day, ODt is the optical density measured on day t, and µ is the growth rate of the algae culture [25].
EPS extraction process
EPS extraction process was carried out according to Zhang et al. [26]. Protein precipitation was carried out by adding trichloroacetic acid (TCA) to the cell-free supernatant (12% (w/v) final concentration of TCA), and the obtained solution was kept overnight at 4 °C under static conditions. Polysaccharides were precipitated by adding two volumes of 95% (v/v) cold ethanol to the supernatant, further kept for 24 h at 4 °C. After centrifugation at 14,000 rpm for 10 min at 4 °C and lyophilization, the dry powder EPSs were collected. The amount of microalgal EPS was determined with the phenol–sulfuric acid method using glucose as standard [27]. All chemicals used for microalgae cultivation and EPS extraction were obtained from Merck Millipore (Darmstadt, Germany). During the cultivation, EPS productivities of microalgae cultures were determined according to the Eq. (3):
| 3 |
where C1 and C2 are the EPS concentrations and t is the time [28].
Characterization analyses
For the characterization of microalgal biomass, moisture content, ash content and biochemical content were determined. The moisture and ash contents of microalgae were determined by proximate analysis [29] using a thermogravimetric analysis (TGA) equipment (TA Instruments SDTQ600, USA). For the determination of carbohydrate, lipid and protein contents of microalgae, the phenol–sulfuric acid method [30], the Bligh-Dyer method [31] and the Lowry method [32] were carried out, respectively.
For the characterization of microalgal EPS, Fourier transform infrared spectrometry (FTIR) analysis, gas chromatography (GC) analysis and thermogravimetric analysis were carried out. The FTIR spectra of EPSs were determined by using a Bruker Alpha FTIR spectrometer for detection of various functional groups in the frequency range of 4000–650 cm−1. Thermal behavior of the EPS was studied by using a TA Instruments SDTQ600 thermogravimetric analyzer. The substance was subjected to a temperature range of 20–450 °C under nitrogen atmosphere at a heating rate of 10 °C/min, and the weight loss was determined [33]. The monosaccharide compositions of the obtained microalgal EPSs were determined according to the method specified in Bramhachari and Dubey [34]. For the determination of monosaccharide compositions, lyophilized EPSs were analyzed by using a YL Instruments 6100 gas chromatograph (GC) consisting of a flame ion detector (FID) and a fused silica capillary column coated with CP Sil-88 (25 m, i.d. 0.32 mm, ds 0.12).
Statistical analysis of EPS production
Box-Behnken experimental design was used to optimize the parameters of nitrogen and carbon amounts in the medium and illumination time for effective EPS production. In order to examine the effects of these parameters on EPS production, microalgae were grown for 15 days at room temperature, and the concentration of produced EPS was determined by using the phenol–sulfuric acid method. These factors were studied at three levels and three replicates at the center points. The three factors and their levels are listed in Table 1.
Table 1.
Parameters and their levels
| Parameter | Unit | − 1 | 0 | + 1 |
|---|---|---|---|---|
| NaNO3 (X1) | g/L | 0.2 | 1.6 | 3.0 |
| Na2CO3 (X2) | g/L | 0.02 | 0.21 | 0.40 |
| Illumination time (X3) | h | 8 | 12 | 16 |
The model used was as following:
| 4 |
where Y is a response; β0, β1, β2, β3, β12, β13, β23, β11, β22 and β33, are constant factors. X1, X2, and X3, which are defined as the independent factors, are the amount of nitrogen, carbon, and illumination time, respectively.
The best-fitting models were determined using quadratic regression where insignificant model parameters were removed from the models, and only the variables significant levels were selected for the model construction using Box-Behnken procedure. The computational work including the designation of experimental points, randomization, analysis of variance fitting of the quadratic models and graphical representations as well as optimization was performed using a statistical package Design-Expert version 7.0 (Stat-Ease In., Minneapolis, USA).
Techno-economic assessment of EPS production from microalgae
Techno-economic analysis of microalgal EPS production has carried out by considering the optimum conditions obtained in this study. In this context, the process flow diagram of microalgal EPS production was created by using the SuperPro Designer and stoichiometric and economic calculations were made based on this process diagram. In this section of the study, C. minutissima was chosen to produce EPS in a large-scale production scenario due to their fast growth and having the highest amount of EPS production. Since this is a scenario, assumptions were made by using the results of microalgal EPS production. EPS production bioprocess was illustrated in Fig. 1. The carbohydrate, protein and lipid contents of C. minutissima are approximately 26–33%, 25% and 42%, respectively [35, 36]. The algal-based EPS production is operated for 330 days per year. The other days cannot be used for cultivation because of maintenance requirements.
Fig. 1.

Process flow diagram of EPS production from microalgae
PBR (R-101) was selected as a large-scale cultivation method for the production of the microalgae. Chlorella minutissima cultures were cultivated in modified BG-11 medium (0.2 g/L NaNO3, 0.02 g/L Na2CO3). The maximum biomass concentration was measured to be 0.98 ± 0.01 g/L day. Microalgae were harvested (DC-101 centrifuge) and assumed to have a biomass recovery rate of 97% [37]. After this step, the separated supernatant was sent for EPS extraction. In an extraction system, polysaccharides were precipitated by using 95% (v⁄v) cold ethanol. After precipitation, EPS was collected and dried. Ethanol was recycled via distillation and sent again to the extraction process.
Results and discussion
Biomass and EPS production
The growth curves of microalgal biomass were shown in Fig. 2. Firstly, as can be seen in Fig. 2, the lag phase of BB was longer than that of CM and CS. After reaching logarithmic phase, CM was found to have the highest biomass concentration (0.98 ± 0.01 g/L) among three microalgae species. CS and BB microalgae reached the concentrations of 0.96 ± 0.009 and 0.71 ± 0.004 g/L, respectively. The growth rates in the logarithmic phases of CM, CS and BB were calculated as 0.33 ± 0.011 day−1, 0.32 ± 0.008 day−1 and 0.26 ± 0.007 day−1, respectively. The doubling times of these microalgae were calculated as 2.10 ± 0.07 day, 2.13 ± 0.057 day and 2.61 ± 0.073 day, respectively.
Fig. 2.

Growth curves of microalgae
The growth of microalgae can change according to the species, environmental conditions and culture media. For instance, B. braunii grow slower than other microalgal species due to the synthesis of energetically expensive hydrocarbons [38]. In this context, Onay [39] stated that the lag phase duration of the Chlorella sp. microalgae is 1–2 days; however, Gouveia et al. [40] reported that the lag phase duration of the BB microalgae is 2–4 days. Additional carbon sources to the growth medium can enhance the microalgal growth due to the ATP formation in both photochemical and heterotrophic reactions [39]. Researchers have extensively looked into the shift in microalgal growth, as shown in the literature. Yang et al. found the growth rates of CM as between 0.34 and 0.41 day−1 in their study which the effects of different glycerin concentrations on CM growth were investigated [40]. Kim et al. calculated the growth rates of CS microalgae in different conditions between 0.24 and 0.53 day−1 [41]. Kumar et al. [42] stated that the growth rate of CS microalgae is 0.24 day−1; Harun et al. [43] stated that the growth rate of the BB microalgae is 0.26 day−1. Based on that, the calculated growth rates and doubling times for the present study are within the expected range specified in the literature.
The amounts of produced EPSs by microalgae during the cultivation were shown in Fig. 3. Comparing the curves in Figs. 2 and 3, the similarity between microalgae growth and EPS production is notorious. It was determined that CM, CS and BB produced 0.245 ± 0.0025 g/L, 0.163 ± 0.0016 g/L and 0.117 ± 0.0007 g/L EPS during microalgae cultivation, respectively. When the EPS productivity of these microalgae in log phase was compared, it was found that CM has the highest productivity. The EPS productivity of CM, CS and BB microalgae was calculated as 0.033 ± 0.000135 g/L/day, 0.021 ± 0.000023 g/L/day and 0.016 ± 0.000039 g/L/day, respectively. In the literature, biomass and EPS production are inversely proportional [12, 24], and the EPS production potential and EPS productivity of microalgae varied according to the microalgae species, media contents, and environmental conditions. For example, Diaz Bayona and Garces [24] examined EPS production potentials of BB microalgae in different media in their study. In the study of Diaz Bayona and Garces [24], the EPS productivity of BB grown in BG-11 medium was found as 0.0068 ± 0.0002 g/L/day; the EPS productivity of BB grown in D medium was found to be 0.0105 ± 0.0015 g/L/day. Zhang et al. [26] reported that Chlorella zofingiensis and Chlorella vulgaris microalgae grown on BG-11 medium produced 0.208 and 0.364 g/L EPS, respectively. Yim et al. [44] reported that Gymnodinium impudicum microalgae produced EPS between 0.0175 and 0.135 g/L in different media. Raposo et al. [45] reported that the EPS production potential of Porphyridium cruentum microalgae in different media ranges between 0.3 and 1 g/L. Bafana [13] also examined the production of EPS from Chlamydomonas reinhardtii microalgae statistically. They found that the resulting response surface model was statistically significant and predicted maximum EPS production of 628 mg/L. Li et al. [12] found that the specific growth rate of Microcystis aeruginosa and EPS production from this cyanobacteria were inversely proportional.
Fig. 3.
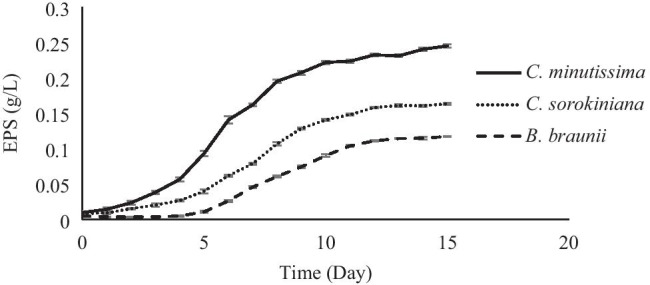
EPS production by microalgae
The results of the statistical examination of the effects of NaNO3 and Na2CO3 amounts in BG-11 medium and illumination time on EPS production are presented in Table 2, showing that the highest EPS production was performed by CM microalgae. The maximum and minimum EPS productions were determined as 0.40 g/L and 0.215 g/L for CM, respectively. The highest EPS amounts obtained from BB and CS were also found as 0.120 g/L and 0.183 g/L, respectively. The relationships between EPS amount and the selected parameters were fitted to the quadratic regression model equations. Based on the coded levels of these parameters, these equations were represented as Eqs. 5, 6, and 7 for CM, BB and CS microalgae, respectively.
| 5 |
| 6 |
| 7 |
Table 2.
Design matrix and experimental results
| Run | Coded factors | Actual factors | EPS amounts | ||||||
|---|---|---|---|---|---|---|---|---|---|
| X1 | X2 | X3 |
X1 (g/L) |
X2 (g/L) |
X3 (h) |
CS (g/L) |
BB (g/L) |
CM (g/L) |
|
| 1 | 0 | − 1 | 1 | 1.6 | 0.02 | 16 | 0.040 | 0.043 | 0.046 |
| 2 | − 1 | 0 | − 1 | 0.2 | 0.21 | 8 | 0.139 | 0.117 | 0.171 |
| 3 | − 1 | − 1 | 0 | 0.2 | 0.02 | 12 | 0.183 | 0.120 | 0.215 |
| 4 | 0 | 1 | 1 | 1.6 | 0.40 | 16 | 0.040 | 0.050 | 0.079 |
| 5 | − 1 | 1 | 0 | 0.2 | 0.40 | 12 | 0.127 | 0.070 | 0.124 |
| 6 | − 1 | 0 | 1 | 0.2 | 0.21 | 16 | 0.057 | 0.057 | 0.109 |
| 7 | 0 | 0 | 0 | 1.6 | 0.21 | 12 | 0.035 | 0.034 | 0.042 |
| 8 | 1 | 0 | − 1 | 3.0 | 0.21 | 8 | 0.066 | 0.059 | 0.112 |
| 9 | 0 | 0 | 0 | 1.6 | 0.21 | 12 | 0.036 | 0.035 | 0.040 |
| 10 | 1 | − 1 | 0 | 3.0 | 0.02 | 12 | 0.125 | 0.070 | 0.121 |
| 11 | 0 | 0 | 0 | 1.6 | 0.21 | 12 | 0.036 | 0.035 | 0.042 |
| 12 | 0 | − 1 | − 1 | 1.6 | 0.02 | 8 | 0.128 | 0.083 | 0.128 |
| 13 | 0 | 1 | − 1 | 1.6 | 0.40 | 8 | 0.053 | 0.055 | 0.083 |
| 14 | 1 | 0 | 1 | 3.0 | 0.21 | 16 | 0.081 | 0.064 | 0.119 |
| 15 | 1 | 1 | 0 | 3.0 | 0.40 | 12 | 0.138 | 0.85 | 0.149 |
X1 amount of nitrogen source, X2 amount of carbon source, X3 illumination time
The ANOVA results of the statistical evaluation were shown in Table 3. Table 3 showed that the R2 values for all microalgae organisms were found to be very close to the value of 1. Furthermore, since the gap between Pred-R2 and Adj-R2 was less than 0.2, the values of Pred-R2 were most likely in agreement with the values of Adj-R2. Thus, the regression models were important since the p values for all microalgae organisms are less than 0.01.
Table 3.
ANOVA results of statistical evaluation for microalgae species
| Microalgae | Sources of variations | Degree of freedom | Sum of squares | Mean square | f-value | p-value |
|---|---|---|---|---|---|---|
| CS | Regression model | 9 | 33,884.92 | 3764.99 | 69.76 | 0.0001 |
| Error | 2 | 0.58 | 0.29 | |||
| Corrected total | 14 | 34,154.77 | ||||
| R2 = 0.9921; Adj-R2 = 0.9779; Pred-R2 = 0.8783 | ||||||
| BB | Regression model | 9 | 10,026.71 | 1114.08 | 82.15 | < 0.0001 |
| Error | 2 | 0.25 | 0.12 | |||
| Corrected total | 14 | 10,094.52 | ||||
| R2 = 0.9933; Adj-R2 = 0.9812; Pred-R2 = 0.8929 | ||||||
| CM | Regression model | 9 | 36,137.95 | 4015.33 | 38.68 | 0.0004 |
| Error | 2 | 2.71 | 1.36 | |||
| Corrected total | 14 | 36,656.96 | ||||
| R2 = 0.9858; Adj-R2 = 0.9604; Pred-R2 = 0.7745 |
According to the obtained results, it was observed that the three selected parameters affect the EPS production negatively. The reason for that is because microalgae have metabolic mechanisms to protect themselves against stress conditions and producing EPS instead of growing in biomass is one of those strategies. One of the most important stress parameters for microalgae cells is the nitrogen deficiency. According to Table 2, it was found that the usage of low amounts of nitrogen compounds caused an increase in the EPS production. In many studies, it has been reported that increasing nitrogen concentration improves the biomass production of microalgae [24]. With the increase in the amount of nitrogen, the synthesis of proteins and photosynthetic pigments in microalgae increases, and the synthesis of metabolites such as lipid and EPS is reduced. However, when the amount of nitrogen in the media decreases, the photosynthesis rate of microalgae decreases and the organism tries to tolerate this stress by accumulating carbon sources in different forms such as lipid and EPS [24]. This conversion is reported by Miqueleto et al. [46] and Maalej et al. [47] who stated that a high C/N ratio had a positive effect on EPS production.
Among with nitrogen content, the carbon content in the growth medium is also a significant parameter for microalgal biomass and EPS production. Since carbon sources are essential for the growth of microalgae, limited amount of carbon compounds can cause increase in the EPS production as a stress response. In the presented study, the higher EPS productions were achieved with the growth medium containing low amounts of carbon content. Similar results were obtained in the literature studies. Yeh et al. reported that biomass production increased with the increase of carbon concentration in media [48]. Yim et al. also used NaHCO3 as a carbon source in the growth medium, and they found that the highest yield of EPS was determined as 0.047 g/L, when NaHCO3 was supplied in a final concentration of 0.05 mM, representing a 2.3 times increase compared with the f/2 medium [44].
Illumination time is an environmental factor that affects the growth of microalgae and its biochemical content. Microalgae are photosynthetic microorganisms that can produce biomass via photosynthesis. Up to a point, increasing illumination time can boost the growth of microalgae providing an opportunity for photosynthesis more than regular conditions. Since the growth conditions are convenient for microalgae, excessive lipid production or EPS production does not observed. In this study, it can be reported that the higher illumination time resulted with low amount of EPS production. Similarly, Yim et al. stated that the amount of EPS produced in 10 h of illumination was approximately 20 mg/L; on the other hand, this amount decreased to 10 mg/L in continuous illumination [44]. Therefore, the results are in agreement with the data in the literature, and stress conditions may increase EPS production in microorganisms [24, 44, 49].
Characterization experiments
Biomass characterization
The results of microalgal biomass characterization were presented in Table 4. As can be seen in Table 4, the contents of Chlorella species were found to be similar to each other. Protein, lipid and carbohydrate contents of CM and CS species were calculated as 40.61-38.25%, 34.33-32.56% and 18.12-20.80%, respectively. These microalgae can be used as food additives, animal feed or fertilizers due to their high protein content [50]. The protein, lipid and carbohydrate contents of BB microalgae were found to be 17.48%, 50.6% and 21.85%, respectively. This microalgae can be used in cosmetics, healthcare and biofuel industries due to its high lipid content [51]. Koçer et al. [52] reported the carbohydrate, lipid and protein contents of Chlorella vulgaris as 25.3%, 19.61% and 33.64%, respectively. Caporgno et al. [53] found the lipid content of the freshwater microalgae as 30.2%, the carbohydrate content as 29.1% and the protein content as 39.7%. Liang et al. [54] found the carbohydrate, lipid and protein contents of Chlorella sp. as approximately 22%, 23% and 25%, respectively. While Chisti [55] stated that the lipid content of the BB microalgae varied between 25 and 75%; Ruangsomboon [56] found lipid content of BB between 12 and 55%.
Table 4.
The characterization of microalgal biomass
| CM | CS | BB | |
|---|---|---|---|
| Carbohydrate (%) | 18.12 | 20.80 | 21.85 |
| Lipid (%) | 34.33 | 32.56 | 50.6 |
| Protein (%) | 40.61 | 38.25 | 17.48 |
| Moisture (%) | 6.31 | 5.98 | 7.24 |
| Ash (%) | 7.42 | 5.14 | 5.99 |
In this study, moisture and ash contents of all cultivated microalgae species were calculated between 5.14 and 7.42%. Molino et al. studied seven microalgae species consisting of fresh and marine microalgae. It was reported that the microalgae species grown in a highly saline environment can cause a high percentage of ash due to the presence of salts on the surface of the dry biomass [57]. It was found that the obtained results from this study are compatible with the literature. Koçer et al. [52], Agrawal and Chakraborty [58] and Miao et al. [59] stated the moisture content of Chlorella sp. microalgae as 6.78%, 9.1% and 5.39%, respectively. Koçer et al. [52], Miao et al. [59] and Kent et al. [60] reported the ash content of Chlorella sp. as 4.90%, 6.36% and 5.71%, respectively. Arbelaez et al. [61] reported the moisture and ash contents of BB as 4.6% and 4.8%, respectively.
EPS characterization
It was observed that the FTIR spectra of EPS produced from three microalgae species were overlapped (Fig. 4). The strong peak at 3369 cm−1 originated from vibrations at O–H bonds due to the moisture of the material [62–64]. The weak absorption bands at 2981 cm−1 and 2900 cm−1 were characteristic of the C − H stretching vibration of CH2 groups [24]. Wang [65] stated that weak peaks between 3000 and 2900 cm−1 were due to the stretching vibrations of the C–H bond of carbohydrates. The strong absorption band at 1651 cm−1 can be assigned to stretching of the –CHO and –C = O links from –COOH groups [24]. The weak peaks between 1400 and 1200 cm−1 were due to vibration at C-O bonds [33]. Carbohydrates showed high absorbance peaks between wavenumbers of 1200 and 950 cm−1. These peaks were considered as fingerprint regions of exopolysaccharides [66]. The strong peak at 1024 cm−1 indicated the presence of the pyranose and furanose rings [67]. The absorption peak at 877 cm−1 was related to the deformation vibration of C − H of β-pyranose ring [24].
Fig. 4.

FTIR spectra of microalgal EPSs
Thermogravimetric (TG) curves of microalgal EPSs were given in Fig. 5. According to these thermograms, total mass loss occurred in two stages for all EPSs. The first stage took place between about the temperature of 20 and 150 °C, and approximately 8% of mass was lost from the EPS. The second stage took place between 150 and 450 °C when approximately 55% mass loss occurred. The first stage corresponded to the loss of moisture and the degradation of the carboxyl group [68]. In the second stage, the degradation of EPS occurred [69]. Thermal decomposition of bacterial EPS between 20 and 450 °C occurred in two stages in the analysis carried out by Solmaz et al., with a total mass loss of approximately 65% [69]. Ismail and Nampoothiri found that the thermal degradation of EPS between 20 and 450 °C was approximately 60% [70]. According to the studies in the literature and the results obtained from this study, it can be proposed that EPSs have good thermal stability and could be used in industrial applications as processes hit a temperature of about 150 °C [71, 72].
Fig. 5.
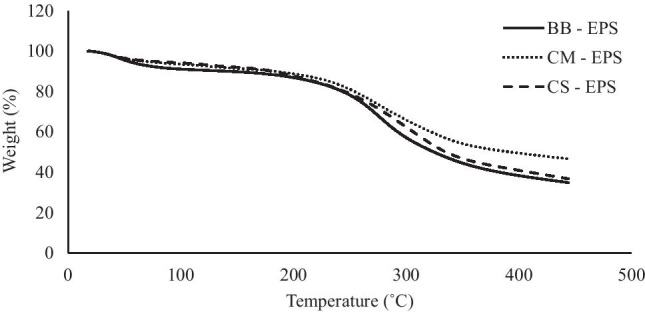
TG curves of microalgal EPSs
The monosaccharide composition obtained as a result of the GC analysis was given in Table 5, and their chromatograms were presented in Fig. 6. According to this table, the monosaccharide compositions of EPSs synthesized by each Chlorella species were similar; however, EPS synthesized by BB was different from Chlorella species.While Chlorella species were mainly composed of galactose, glucose and mannose monosaccharides; EPS synthesized by BB was mainly composed of galactose, fucose and glucose monosaccharides. In both cases, results were in agreement with literature already described [26, 73]. For each microalgae species, the most abundant neutral sugar in the structure of the synthesized EPS was galactose with a ratio of approximately 50%. In addition, there was glucose between 17.88 and 28.68% in the structure of each EPS. The most distinctive difference between microalgal EPS was observed as fucose which was approximately one-fourth of EPS synthesized by BB. The high content of fucose indicated that this EPS could be used in medical and cosmetic applications due to its anticancer, anti-inflammatory, moisturizing and antigen-synthesizing properties [74]. Garcia-Cubero et al. stated that the galactose and fucose contents of EPS synthesized by the BB microalgae were 51% and 31%, respectively [73]. Ragavan and Das stated that EPS with high fucose content can be used in the production of nutraceuticals and functional foods [75]. Another important conclusion that can be drawn from this table is that EPSs synthesized by Chlorella species contained more mannose than those of BB. Because mannose shows a range of health benefits, EPS with high mannose content can be applied as a glyconutrient recommendation for babies and children [76].
Table 5.
Composition of exopolysaccharides of CM, CS and BB
| Monosaccharides | CM | CS | BB | Retention time (min) |
|---|---|---|---|---|
| Glucose | 25.07 ± 3.69 | 28.68 ± 5.09 | 17.88 ± 2.35 | 26–27 |
| Galactose | 51.28 ± 5.37 | 45.89 ± 6.12 | 49.21 ± 3.96 | 27–28 |
| Rhamnose | 2.11 ± 0.09 | 2.95 ± 0.07 | 1.25 ± 0.05 | 13–14 |
| Fucose | 0.12 ± 0.01 | 1.33 ± 0.09 | 23.54 ± 3.51 | 14–15 |
| Arabinose | 3.95 ± 0.08 | 3.64 ± 0.85 | 3.47 ± 0.34 | 17–18 |
| Mannose | 14.52 ± 3.10 | 13.79 ± 2.66 | 1.06 ± 0.07 | 23–24 |
Fig. 6.

GC chromatograms of EPSs produced from CM, CS and BB
Techno-economic assessment
Inputs and outputs of EPS production from microalgae and the main economic results were given in Table 6. The scenario required a large amount of water as 100000 t per year and limited amount of nutrients to obtain optimal cultivation conditions. Approximately, 2100 t of microalgal biomass was obtained and processed with ethanol to acquire 600 t of EPS. Although operational costs can change in the following years due to the recycling, the cost of the first year was presented. The main investment costs were consist of the costs for the photobioreactor, land, centrifuge, extractor, drying and distillation equipment to recycle the excessive ethanol. Similar to other techno-economic analysis of algal bioprocesses, the investment costs were considerably high. It was found that labor-dependent costs and facility-dependent costs constitute 56% and 27% of the total cost, respectively. Usage of photobioreactor was the main reason of the high investment costs. Harvesting costs were reduced due to the photobioreactor system and the need of smaller volumes for harvesting. According to Pierre et al., microalgal saccharides are used on the market as moisturizing agents, immune-stimulants, hydrating agents, aggregating agents, and plant elicitors with a selling price changing from € 2.5 k to 200 k/t [77]. Based on this market evaluation, the net present value will be positive and the production system can be considered economically viable. In the literature, numerous studies which investigate the techno-economic assessment of the microalgal biofuel or microalgal bioactive compounds like astaxhantin and β-carotene. These studies presents different results due to the target product which has different production process and making the comparison of the results difficult [78].
Table 6.
Inputs and outputs of EPS production from microalgae
| Inputs | Outputs | Economic results | |||
|---|---|---|---|---|---|
| Water (t/yr) | 100000 | EPS (t/yr) | 600 | Investment cost ($) | 11040 |
| CO2 (t/yr) | 1000 | Microalgal biomass (t/yr) | 2100 | Operational costs ($/yr) | 7028 |
| Nutrient (t/yr) | 1000 | ||||
| Ethanol (liter) | 150 | ||||
| Std power (kW-h/yr) | 2711 | ||||
Investment and operational costs must be reduced in order to make EPS output from microalgae economically viable. For instance, the use of open ponds instead of photobioreactor was considered to reduce the investment cost significantly [6]. In addition to that, genetic modifications which change the metabolic pathways of the microalgae to improve its biochemical content or photon utilization efficiency of microalgae may reduce the operational costs [79]. In the scope of bioeconomical approach, biological-based productions or innovations we evaluated not only with techno-economic aspects, but also with their systematic evaluation of the environmental effects of inputs and outputs at all stages in their life cycle [6]. In this context, this system can be converted to a biorefinery where the remains of microalgae can be valorized for biofuel production after EPS extraction. Besides, assessment of the process should be evaluated with considering the environmental impacts such as usage of water. According to Thomassen et al., the relation between environmental impacts and economic costs draws attention, but it can be explained only with a full-fledged assessment which consist of an evaluation with technological, economic, and environmental aspects [17].
Conclusion
Microalgae are important living organisms for obtaining metabolites accumulated both inside and outside the cell. In this regard, valuable metabolites such as EPS derived from microalgae would be useful in a variety of applications while also contributing significantly to the economies of the countries as commercial goods. According to the results of this study, CM, BB and CS microalgae species would be a useful alternative to produce EPS for the industrial applications whether these microalgae species could be grown in optimum conditions to obtain a high yield. Furthermore, since microalgae are suitable microorganisms for EPS biosynthesis, a low-cost and efficient industrial process should be developed to compete with lactic acid-derived EPS. In addition, wastes resulting from EPS production can be converted into biofuels, and thus, energy costs can be reduced with a biorefinery approach. Future advancements in biotechnology and bioengineering that can reduce the investment and operational costs, can make microalgal EPS production advantageous in market.
Author contribution
All authors contributed to the study conception and design. Material preparation, data collection, and analysis were performed by Anıl Tevfik Koçer, Benan İnan, Sedef Kaptan Usul, Didem Özçimen, Mustafa Tahsin Yılmaz and İbrahim Işıldak. All authors read and approved the final manuscript.
Funding
This study was supported by General Directorate of Agricultural Research and Policies of Republic of Turkey Ministry of Food, Agriculture and Livestock (Project No: TAGEM-15/AR-GE/35). Anıl Tevfik Koçer is also supported by TUBITAK-BIDEB 2211 National Scholarship Programme for PhD Students and 100/2000 YÖK Doctorate Scholarship.
Data availability
Not applicable.
Code availability
Not applicable.
Declarations
Ethics approval
Not applicable.
Consent to participate
Not applicable.
Consent for publication
Not applicable.
Conflict of interest
The authors declare no competing interests.
Footnotes
Responsible Editor: Ernani Pinto
Publisher's note
Springer Nature remains neutral with regard to jurisdictional claims in published maps and institutional affiliations.
References
- 1.Ruas-Madiedo P, Hugenholtz J, Zoon P. An overview of the functionality of exopolysaccharides produced by lactic acid bacteria. Int Dairy J. 2002;12(2–3):163–171. doi: 10.1016/S0958-6946(01)00160-1. [DOI] [Google Scholar]
- 2.Kumar Singha T. Microbial extracellular polymeric substances: production, ısolation and applications. IOSR J Pharm. 2012;2:276–281. doi: 10.9790/3013-0220276281. [DOI] [Google Scholar]
- 3.Lee IY, Seo WT, Kim GJ et al (1997) Optimization of fermentation conditions for production of exopolysaccharide by Bacillus polymyxa. Bioprocess Eng 16:71–75. 10.1007/s004490050290
- 4.Mahapatra S, Banerjee D (2013) Fungal exopolysaccharide: production, composition and applications. Microbiol Insights 6:1–16. 10.4137/mbi.s10957 [DOI] [PMC free article] [PubMed]
- 5.Xiao R, Zheng Y. Overview of microalgal extracellular polymeric substances (EPS) and their applications. Biotechnol Adv. 2016;34:1225–1244. doi: 10.1016/j.biotechadv.2016.08.004. [DOI] [PubMed] [Google Scholar]
- 6.Özçimen D, İnan B, Koçer AT, Vehapi M (2018) Bioeconomic assessment of microalgal production. In: Jacob-Lopes E (ed) Microalgal Biotechnology. InTech, Rijeka, Croatia, pp 195–213. 10.5772/intechopen.73702
- 7.Singh NK, Dhar DW. Microalgae as second generation biofuel. A review Agron Sustain Dev. 2011;31:605–629. doi: 10.1007/s13593-011-0018-0. [DOI] [Google Scholar]
- 8.Karakaş CY, Şahin HT, İnan B, et al (2019) In-vitro cytotoxic activity of microalgal extracts loaded nano-micro particles produced via electrospraying and microemulsion methods. Biotechnol Prog 35(6):1–8. 10.1002/btpr.2876 [DOI] [PubMed]
- 9.Geun Goo B, Baek G, Jin Choi D et al (2013) Characterization of a renewable extracellular polysaccharide from defatted microalgae Dunaliella tertiolecta. Bioresour Technol 129:343–350. 10.1016/j.biortech.2012.11.077 [DOI] [PubMed]
- 10.Frengova GI, Simova ED, Beshkova DM, Simov ZI. Exopolysaccharides produced by lactic acid bacteria of kefir grains. Zeitschrift fur Naturforsch - Sect C J Biosci. 2002;57:805–810. doi: 10.1515/znc-2002-9-1009. [DOI] [PubMed] [Google Scholar]
- 11.Tsuda H, Hara K, Miyamoto T (2008) Binding of mutagens to exopolysaccharide produced by Lactobacillus plantarum mutant strain 301102S. J Dairy Sci 91:2960–2966. 10.3168/jds.2007-0538 [DOI] [PubMed]
- 12.Li M, Zhu W, Gao L, Lu L (2013) Changes in extracellular polysaccharide content and morphology of Microcystis aeruginosa at different specific growth rates. J Appl Phycol 25:1023–1030. 10.1007/s10811-012-9937-7
- 13.Bafana A (2013) Characterization and optimization of production of exopolysaccharide from Chlamydomonas reinhardtii. Carbohydr Polym 95:746–752. 10.1016/j.carbpol.2013.02.016 [DOI] [PubMed]
- 14.Gaignard C, Macao V, Gardarin C et al (2018) The red microalga Flintiella sanguinaria as a new exopolysaccharide producer. J Appl Phycol 30:2803–2814. 10.1007/s10811-018-1389-2
- 15.Halaj M, Paulovičová E, Paulovičová L, et al. Extracellular biopolymers produced by Dictyosphaerium family - chemical and immunomodulative properties. Int J Biol Macromol. 2019;121:1254–1263. doi: 10.1016/j.ijbiomac.2018.10.116. [DOI] [PubMed] [Google Scholar]
- 16.DeSantis D, Mason JA, James BD, et al. Techno-economic analysis of metal-organic frameworks for hydrogen and natural gas storage. Energy Fuels. 2017;31:2024–2032. doi: 10.1021/acs.energyfuels.6b02510. [DOI] [Google Scholar]
- 17.Thomassen G, Egiguren Vila U, Van Dael M, et al. A techno-economic assessment of an algal-based biorefinery. Clean Technol Environ Policy. 2016;18:1849–1862. doi: 10.1007/s10098-016-1159-2. [DOI] [Google Scholar]
- 18.Davis R, Aden A, Pienkos PT. Techno-economic analysis of autotrophic microalgae for fuel production. Appl Energy. 2011;88:3524–3531. doi: 10.1016/j.apenergy.2011.04.018. [DOI] [Google Scholar]
- 19.Hoffman J, Pate RC, Drennen T, Quinn JC. Techno-economic assessment of open microalgae production systems. Algal Res. 2017;23:51–57. doi: 10.1016/j.algal.2017.01.005. [DOI] [Google Scholar]
- 20.Juneja A, Murthy GS. Evaluating the potential of renewable diesel production from algae cultured on wastewater: Techno-economic analysis and life cycle assessment. AIMS Energy. 2017;5:239–257. doi: 10.3934/energy.2017.2.239. [DOI] [Google Scholar]
- 21.Zamalloa C, Vulsteke E, Albrecht J, Verstraete W. The techno-economic potential of renewable energy through the anaerobic digestion of microalgae. Bioresour Technol. 2011;102:1149–1158. doi: 10.1016/j.biortech.2010.09.017. [DOI] [PubMed] [Google Scholar]
- 22.Hanrahan G, Lu K. Application of factorial and response surface methodology in modern experimental design and optimization. Crit Rev Anal Chem. 2006;36:141–151. doi: 10.1080/10408340600969478. [DOI] [Google Scholar]
- 23.Stanier RY, Kunisawa R, Mandel M, Cohen-Bazire G. Purification and properties of unicellular blue-green algae (order Chroococcales) Bacteriol Rev. 1971;35:171–205. doi: 10.1128/mmbr.35.2.171-205.1971. [DOI] [PMC free article] [PubMed] [Google Scholar]
- 24.Díaz Bayona KC, Garcés LA (2014) Effect of different media on exopolysaccharide and biomass production by the green microalga Botryococcus braunii. J Appl Phycol 26:2087–2095. 10.1007/s10811-014-0242-5
- 25.Wang L, Min M, Li Y et al (2010) Cultivation of green algae Chlorella sp. in different wastewaters from municipal wastewater treatment plant. Appl Biochem Biotechnol 162:1174–1186. 10.1007/s12010-009-8866-7 [DOI] [PubMed]
- 26.Zhang J, Liu L, Chen F (2019) Production and characterization of exopolysaccharides from Chlorella zofingiensis and Chlorella vulgaris with anti-colorectal cancer activity. Int J Biol Macromol 134:976–983. 10.1016/j.ijbiomac.2019.05.117 [DOI] [PubMed]
- 27.Do BC, Dang TT, Berrin JG et al (2009) Cloning, expression in Pichia pastoris, and characterization of a thermostable GH5 mannan endo-1,4-beta-mannosidase from Aspergillus niger BK01. Microb Cell Fact 8:59. 10.1021/ac60111a017 [DOI] [PMC free article] [PubMed]
- 28.Hempel N, Petrick I, Behrendt F. Biomass productivity and productivity of fatty acids and amino acids of microalgae strains as key characteristics of suitability for biodiesel production. J Appl Phycol. 2012;24:1407–1418. doi: 10.1007/s10811-012-9795-3. [DOI] [PMC free article] [PubMed] [Google Scholar]
- 29.García R, Pizarro C, Lavín AG, Bueno JL. Biomass proximate analysis using thermogravimetry. Bioresour Technol. 2013 doi: 10.1016/j.biortech.2013.03.197. [DOI] [PubMed] [Google Scholar]
- 30.Dubois M, Gilles KA, Hamilton JK, et al. Colorimetric method for determination of sugars and related substances. Anal Chem. 1956;28:350–356. doi: 10.1021/ac60111a017. [DOI] [Google Scholar]
- 31.Bligh EG, Dyer WJ. A rapid method of total lipid extraction and purification. Can J Biochem Physiol. 1959;37:911–917. doi: 10.1139/o59-099. [DOI] [PubMed] [Google Scholar]
- 32.Lowry OH, Rosenbrough NJ, Farr AL, Randall RJ. Protein measurement with the folin. J Biol Chem. 1951 doi: 10.1016/0304-3894(92)87011-4. [DOI] [PubMed] [Google Scholar]
- 33.Zheng JQ, Wang JZ, Shi CW et al (2014) Characterization and antioxidant activity for exopolysaccharide from submerged culture of Boletus aereus. Process Biochem 49:1047–1053. 10.1016/j.procbio.2014.03.009
- 34.Bramhachari PV, Dubey SK (2006) Isolation and characterization of exopolysaccharide produced by Vibrio harveyi strain VB23. Lett Appl Microbiol 43:571–577. 10.1111/j.1472-765X.2006.01967.x [DOI] [PubMed]
- 35.Sert BS, Inan B, Özçimen D (2018) Effect of chemical pre-treatments on bioethanol production from Chlorella minutissima. Acta Chim Slov 65(1):160–165. 10.17344/acsi.2017.3728 [PubMed]
- 36.Freitas BCB, Morais MG, Costa JAV (2017) Chlorella minutissima cultivation with CO2 and pentoses: effects on kinetic and nutritional parameters. Bioresour Technol 244:338–344. 10.1016/j.biortech.2017.07.125 [DOI] [PubMed]
- 37.Milledge JJ, Heaven S. Disc stack centrifugation separation and cell disruption of microalgae: a technical note. Environ Nat Resour Res. 2011 doi: 10.5539/enrr.v1n1p17. [DOI] [Google Scholar]
- 38.Banerjee A, Sharma R, Chisti Y, Banerjee UC (2002) Botryococcus braunii: a renewable source of hydrocarbons and other chemicals. Crit Rev Biotechnol 22:245–279 [DOI] [PubMed]
- 39.Choi HJ, Yu SW. Influence of crude glycerol on the biomass and lipid content of microalgae. Biotechnol Biotechnol Equip. 2015;29:506–513. doi: 10.1080/13102818.2015.1013988. [DOI] [Google Scholar]
- 40.Yang JS, Rasa E, Tantayotai P et al (2011) Mathematical model of Chlorella minutissima UTEX2341 growth and lipid production under photoheterotrophic fermentation conditions. Bioresour Technol 102:3077–3082. 10.1016/j.biortech.2010.10.049 [DOI] [PMC free article] [PubMed]
- 41.Kim S, Park J, eun, Cho YB, Hwang SJ, (2013) Growth rate, organic carbon and nutrient removal rates of Chlorella sorokiniana in autotrophic, heterotrophic and mixotrophic conditions. Bioresour Technol 144:8–13. 10.1016/j.biortech.2013.06.068 [DOI] [PubMed]
- 42.Kumar K, Dasgupta CN, Das D (2014) Cell growth kinetics of Chlorella sorokiniana and nutritional values of its biomass. Bioresour Technol 167:358–366. 10.1016/j.biortech.2014.05.118 [DOI] [PubMed]
- 43.Harun R, Singh M, Forde GM, Danquah MK. Bioprocess engineering of microalgae to produce a variety of consumer products. Renew Sustain Energy Rev. 2010;14:1037–1047. doi: 10.1016/j.rser.2009.11.004. [DOI] [Google Scholar]
- 44.Yim JH, Kim SJ, Ahn SH, Lee HK. Optimal conditions for the production of sulfated polysaccharide by marine microalga Gyrodinium impudicum strain KG03. Biomol. Eng. 2003;20(4–6):273–280. doi: 10.1016/S1389-0344(03)00070-4. [DOI] [PubMed] [Google Scholar]
- 45.Raposo MFDJ, De Morais AMMB, De Morais RMSC. Influence of sulphate on the composition and antibacterial and antiviral properties of the exopolysaccharide from Porphyridium cruentum. Life Sci. 2014;101:56–63. doi: 10.1016/j.lfs.2014.02.013. [DOI] [PubMed] [Google Scholar]
- 46.Miqueleto AP, Dolosic CC, Pozzi E, et al. Influence of carbon sources and C/N ratio on EPS production in anaerobic sequencing batch biofilm reactors for wastewater treatment. Bioresour Technol. 2010;101:1324–1330. doi: 10.1016/j.biortech.2009.09.026. [DOI] [PubMed] [Google Scholar]
- 47.Maalej H, Hmidet N, Boisset C et al (2015) Optimization of exopolysaccharide production from Pseudomonas stutzeri AS22 and examination of its metal-binding abilities. J Appl Microbiol 118:356–367. 10.1111/jam.12688 [DOI] [PubMed]
- 48.Yeh KL, Chang JS, Chen WM (2010) Effect of light supply and carbon source on cell growth and cellular composition of a newly isolated microalga Chlorella vulgaris ESP-31. Eng Life Sci 10:201–208. 10.1002/elsc.200900116
- 49.Grosu-Tudor SS, Zamfir M. Exopolysaccharide production by selected lactic acid bacteria isolated from fermented vegetables. Sci Bull Ser F Biotechnol. 2014;18:107–114. [Google Scholar]
- 50.Dineshkumar R, Kumaravel R, Gopalsamy J, et al. Microalgae as bio-fertilizers for rice growth and seed yield productivity. Waste and Biomass Valorization. 2018;9:793–800. doi: 10.1007/s12649-017-9873-5. [DOI] [Google Scholar]
- 51.Servel MO, Claire C, Derrien A, et al. Fatty acid composition of some marine microalgae. Phytochemistry. 1994;36:691–693. doi: 10.1016/S0031-9422(00)89798-8. [DOI] [Google Scholar]
- 52.Koçer AT, Mutlu B, Özçimen D. Investigation of biochar production potential and pyrolysis kinetics characteristics of microalgal biomass. Biomass Convers Biorefinery. 2019 doi: 10.1007/s13399-019-00411-7. [DOI] [Google Scholar]
- 53.Caporgno MP, Trobajo R, Caiola N, et al. Biogas production from sewage sludge and microalgae co-digestion under mesophilic and thermophilic conditions. Renew Energy. 2015;75:374–380. doi: 10.1016/j.renene.2014.10.019. [DOI] [Google Scholar]
- 54.Liang K, Zhang Q, Gu M, Cong W (2013) Effect of phosphorus on lipid accumulation in freshwater microalga Chlorella sp. J Appl Phycol 25:311–318. 10.1007/s10811-012-9865-6
- 55.Chisti Y. Biodiesel from microalgae. Biotechnol Adv. 2007;25:294–306. doi: 10.1016/j.biotechadv.2007.02.001. [DOI] [PubMed] [Google Scholar]
- 56.Ruangsomboon S (2012) Effect of light, nutrient, cultivation time and salinity on lipid production of newly isolated strain of the green microalga, Botryococcus braunii KMITL 2. Bioresour Technol 109:261–265. 10.1016/j.biortech.2011.07.025 [DOI] [PubMed]
- 57.Molino A, Iovine A, Casella P, et al. Microalgae characterization for consolidated and new application in human food, animal feed and nutraceuticals. Int J Environ Res Public Health. 2018;15:1–21. doi: 10.3390/ijerph15112436. [DOI] [PMC free article] [PubMed] [Google Scholar]
- 58.Agrawal A, Chakraborty S (2013) A kinetic study of pyrolysis and combustion of microalgae Chlorella vulgaris using thermo-gravimetric analysis. Bioresour Technol 128:72–80. 10.1016/j.biortech.2012.10.043 [DOI] [PubMed]
- 59.Miao X, Wu Q, Yang C. Fast pyrolysis of microalgae to produce renewable fuels. J Anal Appl Pyrolysis. 2004;71:855–863. doi: 10.1016/j.jaap.2003.11.004. [DOI] [Google Scholar]
- 60.Kent M, Welladsen HM, Mangott A, Li Y (2015) Nutritional evaluation of Australian microalgae as potential human health supplements. PLoSONE 10(2):1–14. 10.1371/journal.pone.0118985 [DOI] [PMC free article] [PubMed]
- 61.Arbeláez AA, Giraldo ND, Pérez JF, Atehortúa L (2019) Pyrolysis kinetics using TGA and simulation of gasification of the microalga Botryococcus braunii. Bioenergy Res 12:1077–1089. 10.1007/s12155-019-10037-2
- 62.Koçer AT, Özçimen D. Investigation of the biogas production potential from algal wastes. Waste Manag Res. 2018;36:1100–1105. doi: 10.1177/0734242X18798447. [DOI] [PubMed] [Google Scholar]
- 63.Karakaş C, Özçimen D, İnan B. Potential use of olive stone biochar as a hydroponic growing medium. J Anal Appl Pyrolysis. 2017;125:17–23. doi: 10.1016/j.jaap.2017.05.005. [DOI] [Google Scholar]
- 64.Koçer AT, Özçimen D (2021) Determination of combustion characteristics and kinetic parameters of Ulva lactuca and its biochar. Biomass Convers Biorefinery. 10.1007/s13399-020-01245-4
- 65.Wang B. Chemical characterization and ameliorating effect of polysaccharide from Chinese jujube on intestine oxidative injury by ischemia and reperfusion. Int J Biol Macromol. 2011;48:386–391. doi: 10.1016/j.ijbiomac.2010.12.005. [DOI] [PubMed] [Google Scholar]
- 66.Dertli E, Toker OS, Durak MZ, et al. Development of a fermented ice-cream as influenced by in situ exopolysaccharide production: rheological, molecular, microstructural and sensory characterization. Carbohydr Polym. 2016;136:427–440. doi: 10.1016/j.carbpol.2015.08.047. [DOI] [PubMed] [Google Scholar]
- 67.Sekkal M, Huvenne JP, Legrand P et al (1993) Direct structural identification of polysaccharides from red algae by FTIR microspectrometry I: localization of agar in Gracilaria verrucosa sections. Mikrochim Acta 112:1–10. 10.1007/BF01243315
- 68.Kumar CG, Joo HS, Choi JW et al (2004) Purification and characterization of an extracellular polysaccharide from haloalkalophilic Bacillus sp. I-450. Enzyme Microb Technol 34:673–681. 10.1016/j.enzmictec.2004.03.001
- 69.Solmaz KB, Ozcan Y, Dogan NM et al (2018) Characterization and production of extracellular polysaccharides (EPS) by Bacillus pseudomycoides U10. Environ - MDPI 5:1–16. 10.3390/environments5060063
- 70.Ismail B, Nampoothiri KM (2010) Production, purification and structural characterization of an exopolysaccharide produced by a probiotic Lactobacillus plantarum MTCC 9510. Arch Microbiol 192:1049–1057. 10.1007/s00203-010-0636-y [DOI] [PubMed]
- 71.Ahmed Z, Wang Y, Anjum N et al (2013) Characterization of exopolysaccharide produced by Lactobacillus kefiranofaciens ZW3 isolated from Tibet kefir - part II. Food Hydrocoll 30:343–350. 10.1016/j.foodhyd.2012.06.009
- 72.Botelho PS, Maciel MIS, Bueno LA, et al. Characterisation of a new exopolysaccharide obtained from of fermented kefir grains in soymilk. Carbohydr Polym. 2014;107:1–6. doi: 10.1016/j.carbpol.2014.02.036. [DOI] [PubMed] [Google Scholar]
- 73.García-Cubero R, Cabanelas ITD, Sijtsma L et al (2018) Production of exopolysaccharide by Botryococcus braunii CCALA 778 under laboratory simulated Mediterranean climate conditions. Algal Res 29:330–336. 10.1016/j.algal.2017.12.003
- 74.Vanhooren PT, Vandamme EJ. L-Fucose: occurrence, physiological role, chemical, enzymatic and microbial synthesis. J Chem Technol Biotechnol. 1999;74:479–497. doi: 10.1002/(SICI)1097-4660(199906)74:6<479::AID-JCTB76>3.0.CO;2-E. [DOI] [Google Scholar]
- 75.Ragavan ML, Das N (2019) Optimization of exopolysaccharide production by probiotic yeast Lipomyces starkeyi VIT-MN03 using response surface methodology and its applications. Ann Microbiol 69:515–530. 10.1007/s13213-019-1440-9
- 76.Hu X, Shi Y, Zhang P, et al. d-Mannose: properties, production, and applications: an overview. Compr Rev Food Sci Food Saf. 2016;15:773–785. doi: 10.1111/1541-4337.12211. [DOI] [PubMed] [Google Scholar]
- 77.Pierre G, Delattre C, Dubessay P, et al. What is in store for EPS microalgae in the next decade? Molecules. 2019;24:1–25. doi: 10.3390/molecules24234296. [DOI] [PMC free article] [PubMed] [Google Scholar]
- 78.Quinn JC, Davis R. The potentials and challenges of algae based biofuels: a review of the techno-economic, life cycle, and resource assessment modeling. Bioresour Technol. 2015;184:444–452. doi: 10.1016/j.biortech.2014.10.075. [DOI] [PubMed] [Google Scholar]
- 79.Amer L, Adhikari B, Pellegrino J. Technoeconomic analysis of five microalgae-to-biofuels processes of varying complexity. Bioresour Technol. 2011;102:9350–9359. doi: 10.1016/j.biortech.2011.08.010. [DOI] [PubMed] [Google Scholar]
Associated Data
This section collects any data citations, data availability statements, or supplementary materials included in this article.
Data Availability Statement
Not applicable.
Not applicable.