

Abstract
Batch effect correction is an essential step in the integrative analysis of multiple single-cell RNA-sequencing (scRNA-seq) data. One state-of-the-art strategy for batch effect correction is via unsupervised or supervised detection of mutual nearest neighbors (MNNs). However, both types of methods only detect MNNs across batches of uncorrected data, where the large batch effects may affect the MNN search. To address this issue, we presented a batch effect correction approach via iterative supervised MNN (iSMNN) refinement across data after correction. Our benchmarking on both simulation and real datasets showed the advantages of the iterative refinement of MNNs on the performance of correction. Compared to popular alternative methods, our iSMNN is able to better mix the cells of the same cell type across batches. In addition, iSMNN can also facilitate the identification of differentially expressed genes (DEGs) that are relevant to the biological function of certain cell types. These results indicated that iSMNN will be a valuable method for integrating multiple scRNA-seq datasets that can facilitate biological and medical studies at single-cell level.
Keywords: iterative refinement, batch effect correction, single-cell RNA-seq, mutual nearest neighbor
INTRODUCTION
With the rapidly improving technologies and decreasing sequencing costs, large-scale single-cell RNA-sequencing (scRNA-seq) studies examining tens of thousands to even millions of cells are becoming increasingly common [1, 2]. Integrated analyses of cells across multiple studies (or batches) enable an increase in the sample size for more powerful analysis and more comprehensive understanding of various biological questions and processes [3–7]. In addition, re-using published scRNA-seq datasets not only maximizes the value of existing data but also substantially reduces the costs of generating new data. However, existing datasets may be produced across multiple time points via different experimental protocols, and/or by various laboratories, eliciting the systematic differences between different batches (also known as ‘batch effects’), which present grand challenges to the integrative analyses across multiple datasets [8]. Proper batch effect correction is vital to prevent spurious findings and/or to ensure identification of biological signals, such as novel cell type(s) and differentially expressed genes (DEGs) [8–10].
To address this problem, a number of methods have recently been developed for batch effect correction [11–20]. The correction strategy based on mutual nearest neighbor (MNN) detection has been widely used in several state-of-the-art methods, such as MNNcorrect [11] and Seurat v3 [15], and has shown promising performance. However, these unsupervised MNN methods tend to incorrectly match the neighboring cells belonging to different cell types across batches and lead to undesired corrected results (Figure 1A and B; Supplementary Section 1; Supplementary Figure S1, see Supplementary Data available online at http://bib.oxfordjournals.org/). To address this issue, we previously developed SMNN, a supervised batch effect correction method, which incorporates the cell-type information to restrict the detection of MNNs within the same cell type across batches [18]. Benchmarking results in both simulated and real datasets demonstrated that SMNN outperforms the unsupervised methods, MNNcorrect and Seurat v3, in terms of reducing differences across batches and improving the maintenance of cell-type-specific features [18]. However, SMNN searches for MNNs from original expression matrices. The number of MNNs can be rather small in the presence of substantial batch effects, which may lead to insufficient or inaccurate correction.
Figure 1 .

Motivating real examples. (A) Histogram of the proportion of mismatched MNNs (i.e. MNNs from a mismatched cell type) in the five sets of integration. (B) Histogram of the proportion of MNNs of a certain cell from a mismatching cell type in the hematopoietic datasets. (C) Ratio of the number of MNNs detected in each iteration of batch effect correction, compared to the first iteration, in the five real datasets. (D) The average percentage changes in MNNs detected between the next two iterations of correction. (E) Logarithms of F statistic for the corrected data after each iteration in the five real datasets. Detailed information of the five real datasets is provided in Supplementary Table S1 (see Supplementary Data available online at http://bib.oxfordjournals.org/). The red arrows above indicate where best performance is attained.
To address this issue, we propose a new iterative strategy that searches for MNNs from the corrected data, where the systematic differences across batches are expected to be smaller than in the original data, thus improving the correction. According to our results, as the number of iterations of MNN refining and batch effect correction increased, more MNNs were obtained across batches (Figure 1C). Specifically, 24.8% more neighbors were found, on average, when searching MNNs from the first-iteration-corrected data than from the original data (Figure 1D). Furthermore, with one more iteration of correction, the number of identified MNNs increased by an additional 9.5% over the amount detected in the second iteration. However, neither fourth nor fifth iterations result in substantial changes to the MNN numbers found across batches. More importantly, in two sets of real data, the optimal correction was achieved after three iterations, and in another two datasets, the best results were reached after two or four iterations, respectively, depending on the batch effect size (Figure 1E).
Motivated by these findings, we present iSMNN, an iterative supervised batch effect correction method, which performs multiple iterations of MNN refining and batch effect correction rather than one-iteration correction with the MNNs detected from the original expression matrix. With the further refined MNNs from corrected data, iSMNN improves the correction accuracy compared to those methods using the one-iteration correction from the original data.
RESULTS
Overview of iSMNN
In the current implementation of iSMNN, we first input a harmonized label for each shared cell type across all the batches, either based on prior knowledge (e.g., known cell types and their corresponding marker genes) or inferred via unsupervised clustering followed by annotation of clusters within each batch, as described in SMNN [18]. With the harmonized cell type labels, iSMNN, following the Seurat v3 procedure (detailed in https://satijalab.org/seurat/v3.2/integration.html), selects the top 2000 most informative genes across batches (detailed in Supplementary Section 2, see Supplementary Data available online at http://bib.oxfordjournals.org/), and carries out dimensional reduction jointly across batches via diagonalized canonical correlation analysis (CCA). iSMNN then performs the first iteration of batch effect correction where MNNs are only searched within each matched cell type across batches. Batch effect correction is performed accordingly based on the MNNs identified. To further improve the performance after the first iteration, iSMNN implements multiple iterations of batch effect correction (Figure 2). In each iteration, iSMNN matches MNNs of the same cell type across batches in the corrected results from the last iteration, and then refines the correction with the updated MNN information. The performance after each iteration of correction, measured by the degree of mixing for cells of the same cell type across batches, is quantified by the F statistic from a two-way multivariate analysis of variance (MANOVA), where a smaller F value indicates a better mixing of cells across batches. The iterative MNN searching and batch effect correction continue until the F measure starts to increase. The iteration of correction yielding the smallest F measure is deemed as the optimal iteration, and the corresponding results are the iSMNN output.
Figure 2 .
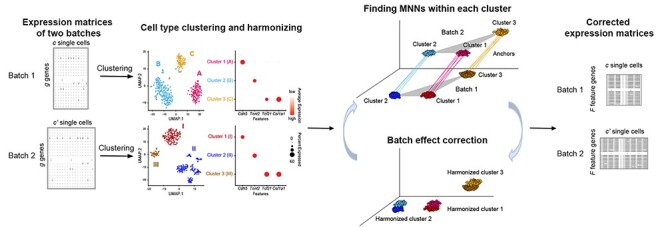
Schematics of iSMNN.
Benchmarking in simulated data
We first assessed the performance of iSMNN using simulated data. We first considered the case where two batches are completely separated from each other in the UMAP space before any correction is performed (Figure 3A; Supplementary Figure S2A, see Supplementary Data available online at http://bib.oxfordjournals.org/). After correction, all the three methods, iSMNN, MNNcorrect and Seurat v3 (denoted as ‘Seurat’ for brevity unless version number is otherwise specified) successfully mitigated the discrepancy between the two batches (Figure 3B–D). In particular, we found that iSMNN properly mixed the cells of the same cell type across the two batches (Figure 3D; Supplementary Figure S2D, see Supplementary Data available online at http://bib.oxfordjournals.org/). However, in both MNNcorrect- and Seurat-corrected results, there were still a large proportion of cells from cell types 2 and 3 of the second batch left unmixed with those from the first batch (Figure 3B and C; Supplementary Figures S2A, B and F–H; Supplementary Figures S3, see Supplementary Data available online at http://bib.oxfordjournals.org/), and in Seurat-corrected results, some cells from cell type 2 of the second batch (green unfilled triangles in Figure 3C) were mixed with those from cell type 3 of the first batch (blue filled triangles). Moreover, across all 30 simulations, iSMNN achieved a substantially reduced F measure compared to Seurat and MNNcorrect (Figure 3E). Specifically, for the example shown in Figure 3, the F value of iSMNN was 98.9% and 97.9% lower than that of Seurat and MNNcorrect, respectively (Supplementary Figure S2E, see Supplementary Data available online at http://bib.oxfordjournals.org/). We further showed that iSMNN still outperforms Seurat and MNNcorrect under the scenarios where only partial cell type(s) are shared between batches or when the batches have a moderate or extreme difference in cell group composition (Supplementary Figures S4 and S5; detailed in Supplementary Section 4, see Supplementary Data available online at http://bib.oxfordjournals.org/). These results suggest that iSMNN provides improved batch effect correction over alternative methods.
Figure 3 .
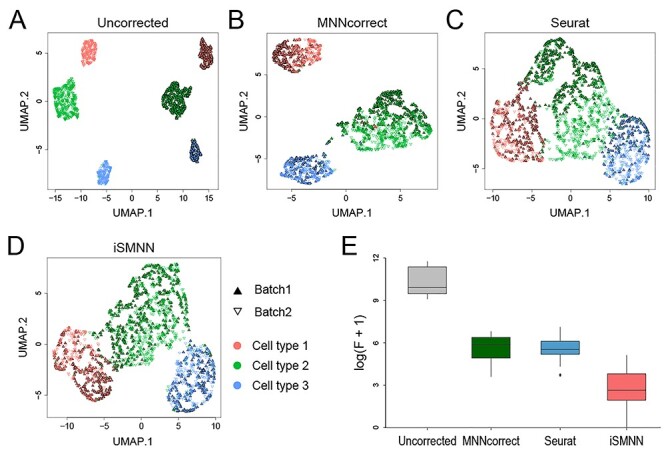
Performance comparison among iSMNN, Seurat and MNNcorrect in simulation data. (A–D) correspond to the UMAP plots for the (A) uncorrected, (B) Seurat-, (C) MNNcorrect- and (D) iSMNN-corrected results, respectively. (E) Boxplot of the logarithms of F statistic for the merged data of the two batches before and after correction.
Benchmarking in real data
Using real data (listed in Supplementary Table S1, see Supplementary Data available online at http://bib.oxfordjournals.org/), we further evaluated the performance of iSMNN by comparing its F statistic to those from six state-of-the-art methods (MNNcorrect, Seurat, Harmony [21], Scanorama [13], BBKNN [22] and SMNN [18]). The results showed that iSMNN consistently performed the best across all six sets of evaluations (Figures 4–6; Supplementary Figures S6–S10, see Supplementary Data available online at http://bib.oxfordjournals.org/), except for cardiac batches 2 and 3, where Harmony’s performance is slightly better than iSMNN and SMNN (Supplementary Figure S9, see Supplementary Data available online at http://bib.oxfordjournals.org/). When examining the average ranking across these analyses, iSMNN ranks first, outperforming all alternative methods, followed by Harmony and Seurat (Figure 4).
Figure 4 .
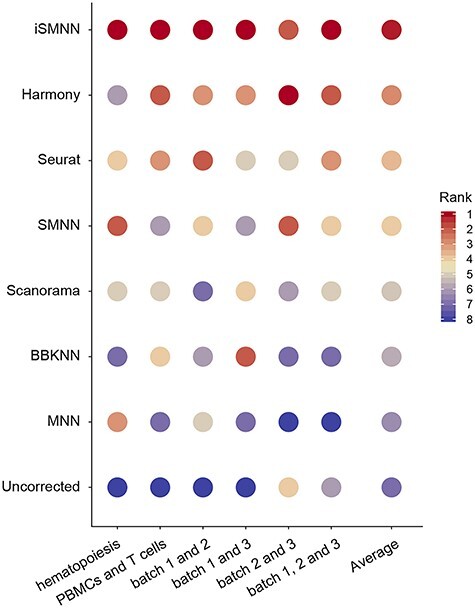
Rank of the seven batch effect correction methods based on their performance in benchmarking datasets measured by F statistic. The methods are ordered according to the average rank across all datasets.
Figure 6 .

Performance comparison between iSMNN and alternative correction methods, MNNcorrect and Seurat, in two batches of cardiac data (batches 1 and 3). (A–D) UMAP plot for the (A) uncorrected, (B) Seurat-, (C) Harmony- and (D) iSMNN-corrected results for the two batches. (E–H) UMAP plots for the (E) uncorrected, (F) Seurat-, (G) Harmony- and (H) iSMNN-corrected results for the cell types across batches. (I) Overlap of DEGs upregulated in the CM cluster over the EC cluster after iSMNN and Seurat correction. (J–L) Heatmap showing gene expression profile of the DEGs upregulated in the CM cluster over the EC cluster, identified by (J) iSMNN specifically, (K) both iSMNN and Seurat and (L) Seurat specifically in cardiac batch 1. (M, N) Feature-enriched GO terms for the overexpressed DEGs in CM cluster over EC cluster that were identified by (N) iSMNN specifically and (M) both iSMNN and Seurat. (O) Average Silhouette Index for the CM and EC clusters defined by iSMNN and Seurat, respectively. (P) IHC staining for the typical CM marker cTnT, typical EC marker Pecam1 and one DEG Cryab specifically identified by iSMNN.
For the two hematopoietic datasets, iSMNN can better merge cells across the two batches from the three shared cell types, namely, common myeloid progenitor (CMP), granulocyte-monocyte progenitor (GMP) and megakaryocyte-erythrocyte progenitor (MEP) cells, as well as better distinguish the batch-specific cell types, such as multipotent progenitor (MPP) and multipotent long-term hematopoietic stem cells (LTHSC) cells, from the three shared cell types, than the alternative methods (Figure 5A–H). Notably, the F statistic of iSMNN was 56.9–99.1% lower than that of the alternative methods (Figure 5I). For the datasets of human peripheral blood mononuclear cells (PBMCs) and T cells, iSMNN exhibited a better mixing of T cells from the two batches and a smaller number of misclassified cells across different cell types (Supplementary Figure S6, see Supplementary Data available online at http://bib.oxfordjournals.org/). These results suggest that iSMNN improves batch effect correction.
Figure 5 .

Performance comparison between iSMNN and alternative methods in the hematopoietic data. (A–D) UMAP plot for the (A) uncorrected, (B) MNNcorrect-, (C) Seurat-, (D) Harmony-, (E) Scanorama-, (F) BBKNN-, (G) SMNN- and (H) iSMNN-corrected results. (I) Logarithms of F statistic for the merged data before and after correction.
We further compared the performance between iSMNN and the alternative correction methods in three cardiac cell datasets (see MATERIALS AND METHODS for details). In the dataset we generated in this study (batch 1), we identified one group of cardiomyocytes (CMs) and five major cell types of non-myocytes (Supplementary Figure S11, see Supplementary Data available online at http://bib.oxfordjournals.org/). The five non-myocyte types were also present in the two batches from our previous study (batches 2 and 3), while the two CM groups were exclusively detected in batch 1. When we performed integrative analysis on batches 1 and 3 without batch effect correction, fibroblasts from the two batches were obviously separated in the UMAP space (Figure 6A and E). After batch effect correction, all of the correction methods successfully brought cells from the two batches together (Figure 6B–D; Supplementary Figure S8, see Supplementary Data available online at http://bib.oxfordjournals.org/). However, in the merged dataset, both Seurat and Harmony failed to distinguish CMs from the endothelial cells (ECs) (Figure 6F and G). In contrast, iSMNN correction showed clear boundaries among different cell types (Figure 6H), and compared to alternative methods, iSMNN-corrected results exhibited smaller distance between two batches (Supplementary Figure S8F, see Supplementary Data available online at http://bib.oxfordjournals.org/) and higher consistency within both CM and EC groups according to the average Silhouette Index (Figure 6O). We then compared the DEGs between the CM and EC clusters identified by iSMNN and Seurat (Figure 6I–N; Supplementary Figures S12 and S13, see Supplementary Data available online at http://bib.oxfordjournals.org/). Compared to ECs, a total of 143 and 126 DEGs were detected to be upregulated in CMs by iSMNN and Seurat, respectively, with 81 DEGs identified by both methods (Figure 6I). Expression profiling in batch 1, which was not affected by batch effect correction, showed that 51 out of 52 (98.1%) iSMNN-specific DEGs expressed in batch 1 indeed had higher expression levels in CMs than ECs, while only 77.6% (38 of 49) of the Seurat-specific DEGs were found to be upregulated in CMs (Figure 6J and L). In addition, Gene Ontology (GO) enrichment analysis revealed that the 62 iSMNN-specific DEGs are mainly involved in heart-related biological processes, such as adenosine triphosphate (ATP) biosynthesis and metabolic processes, purine ribonucleotide metabolic process, and calcium ion transmembrane transporter activity (Figure 6M). In contrast, Seurat-specific DEGs were found to be related to immune processes, which do not seem relevant to the biological function of CMs (Supplementary Figure S12, see Supplementary Data available online at http://bib.oxfordjournals.org/). To further validate DEGs specifically detected by iSMNN, we performed immunohistochemistry (IHC) for one CM-upregulated gene alpha B crystallin (Cryab) together with one CM-representative marker cardiac troponin T (cTnT) and EC-representative marker platelet endothelial cell adhesion molecule 1 (Pecam1). The staining results showed that anti-cTnT and anti-Pecam1 antibody can well demarcate CMs and ECs, respectively. Furthermore, Cryab+ cells are also positive for cTnT but are not positive for Pecam1 (Figure 6P), suggesting that Cryab is specifically expressed in CMs but not in ECs. A similar comparison between iSMNN and MNNcorrect can be found in Supplementary Section 4 and Supplementary Figure S14 (see Supplementary Data available online at http://bib.oxfordjournals.org/). Taken all together, these results indicate that iSMNN retains more cell-type-specific features that are missed by alternative methods after correction.
DISCUSSION
In this study, we present iSMNN, a supervised batch effect correction method for scRNA-seq data via multiple iterations of MNN refinement. This work builds on our previously developed SMNN method, which has showed advantages in batch effect correction via supervised MNN detection over unsupervised correction methods. Extending beyond SMNN, our iSMNN updates MNN detection iteratively and uses these MNNs for refined batch effect correction. Compared to the original data, systematic differences across batches are noticably reduced after each iteration, thus empowering the identification of more and better-matched MNNs for improved batch effect correction in later iterations (Figure 1C and D). The procedure stops when the mixing performance of single cells of the same cell type across batches starts to deteriorate. This multiple-iteration approach substantially mitigates the MNN detection biases incurred by large batch effects between the original expression matrices and improves the correction accuracy over a one-iteration approach (Figure 1E).
Our benchmarking on three real scRNA-seq datasets clearly shows that iSMNN can more effectively mitigate batch effects than alternative methods (Figures 4–6; Supplementary Figures S6–S10, see Supplementary Data available online at http://bib.oxfordjournals.org/). For example, in the two cardiac datasets (cardiac batches 1 and 3), iSMNN reduced differentiations across batches substantially more than MNNcorrect and Seurat (Figure 6A–H; Supplementary Figure S8, see Supplementary Data available online at http://bib.oxfordjournals.org/). Importantly, iSMNN also better maintains cell-type distinguishing features. For the two cardiac datasets, iSMNN identified a more homogenous cluster for CMs than Seurat (Figure 6H and O) and appears to more accurately recover features specific to each cell type in terms of both gene expression profile and functional relevance. In particular, 98.1% of the CM-upregulated DEGs exclusively identified by iSMNN were observed to be more highly expressed in CMs than ECs, a 26.4% improvement when compared to Seurat (Figure 6J and L). In addition, the CM-overexpressed DEGs specifically identified by iSMNN demonstrate biological function more relevant to CMs compared to those specifically identified by Seurat (Figure 6M). IHC staining further validates that iSMNN-detected CM DEG Cryab was indeed specific to CM (Figure 6P). These results suggest that iSMNN can accurately maintain the cell-type-specific features after batch effect correction, which empowers valid downstream analysis and eliminates spurious findings. Furthermore, although iSMNN performs supervised MNN detection, we show that it is robust to the incompleteness of cell type annotation. In principle, a comprehensive annotation of cell types is desired for MNN search and refinement. However, our results show that iSMNN is able to effectively mitigate batch effects with the harmonized cluster labels for only a subset of cells from the major cell types/clusters. When only partial cell type information is available, iSMNN still better mixes cells of the same cell type across batches than most of the alternative methods (Supplementary Figure S15; detailed in Supplementary Section 4, see Supplementary Data available online at http://bib.oxfordjournals.org/).
As a multi-iteration procedure, iSMNN can potentially result in over-correction, with the performance deteriorating instead of improving in later iterations. One plausible reason is that as the iteration increases, the cells contributing to MNNs tend to concentrate disproportionately at certain areas (darker spots in Supplementary Figure S16B and C, see Supplementary Data available online at http://bib.oxfordjournals.org/). Such disproportionate concentrations are undesirable because they may render the cells contributing to MNNs better mixed after correction. However, the other cells not represented by MNNs will be ‘corrected’ farther away from the MNNs selected, which will lead to an increased F statistic and worse correction performance. Therefore, we select, as default, the first local minimum of F statistic as the final corrected results of iSMNN. This default option is reasonable since we find that once the F statistic starts to increase, it never decreases below the first local minimum, suggesting the first local minimum is likely to well represent the global minimum. Since the computational cost of iSMNN is low (<20 min for a 10-iteration correction of two batches each containing 5000 cells; Supplementary Figure S17, see Supplementary Data available online at http://bib.oxfordjournals.org/), we provide users another two iteration options: in the first option, iSMNN runs for a fixed number of iterations (default = 10) and takes the output with the lowest F statistic as the optimal correction results; in the second option, after the first local minimum is observed, an additional number of iterations (default = 3) is run to allow leveraging possible further decrease of F statistic after the first local minimal value.
By leveraging iterative MNN refining, iSMNN demonstrates advantages in removing batch effects while maximally retaining cell-type-specific biological features. We anticipate that iSMNN will be a valuable method for integrating multiple scRNA-seq datasets, which facilitates biological and medical studies at single-cell level.
MATERIALS AND METHODS
Simulation framework
To assess the performance of iSMNN, we first performed simulation analysis following the framework described in Yang et al. [18]. Briefly, two batches  and
and  were first simulated in a three-dimensional biological space following a Gaussian mixture model, where each component represents one cell type (Equations (1) and (2)).
 |
(1) |
 |
(2) |
where  is the three-dimensional vector specifying cell-type-specific means for the i-th cell type in the first batch, reflecting the biological effect; similarly
  for the second batch;
  and
and  are the total numbers of cells in the first and second batch, respectively;
  and
and  are the different mixing coefficients for the three cell types in the two batches and
  is the three-dimensional identity matrix where diagonal entries are all ones and the rest entries are all zeros. In our simulations, we set
  ,
,  ,
,  and
and  .
.
Next, batch effects were introduced to the three-dimensional biological space, where the vector of batch effects  was added to mean vectors of the three cell types in batch 1 to obtain the mean vectors of the three cell types for batch 2 (Equation (3)).
 |
(3) |
In this study, we set  ,
,  and (
and ( . Finally, we projected the three-dimensional data with batch effects to the 2000 dimensional gene expression space by linear transformation using the same random Gaussian matrix P within each batch (Equations (4) and (5)).
 |
(4) |
 |
(5) |
Here P is a 2000 × 3 Gaussian random matrix with each entry simulated from the standard normal distribution.
The simulation procedure was repeated 30 times with different random seeds. Both iSMNN and Seurat were applied to each set of simulated data. The merged results of the two batches before and after correction were visualized by UMAP [23], and the performance of each method was quantified by F statistic.
Real data benchmarking
We also evaluated iSMNN’s performance in real datasets. iSMNN and six alternative correction methods: MNNcorrect, Seurat, Harmony, Scanorama, BBKNN and SMNN were first applied to two published scRNA-seq datasets: (1) two hematopoietic samples generated using MARS-seq and SMART-seq2, respectively [24, 25] and (2) immune cells from human PBMCs and T cells from pancreas sequenced by 10X Chromium [2] (detailed in Supplementary Table S1, see Supplementary Data available online at http://bib.oxfordjournals.org/). For both datasets, cell type labels were assigned according to the annotations described in Haghverdi et al. [11] as well as the expression profile of the canonical markers. The performance of the three methods was compared by F statistic.
We also applied iSMNN and alternative approaches to three batches of scRNA-seq data for cardiac cells from adult murine heart (Supplementary Table S1, see Supplementary Data available online at http://bib.oxfordjournals.org/). Batch 1 corresponds to the data we most recently generated [NCBI Gene Expression Omnibus (GEO) with accession number GSE161138; see Supplementary Section 5 for experimental details, see Supplementary Data available online at http://bib.oxfordjournals. org/], and batches 2 and 3 correspond to cells sequenced in our another study (submitted for publication) (GEO accession number GSE157444). Given how the data for the three batches were generated, the batch effects between batches 1 and 2/3 is more pronounced than that between batches 2 and 3. Thus, we assessed iSMNN and alternative approaches on three sets of integration under two scenarios: (1) batch 1 versus batch 2 and batch 1 versus batch 3, and (2) batch 2 versus batch 3, where the scenario (1) corresponds to setting that batch effects are larger and (2) that the batch effects are smaller. The performance of all methods was again measured by F statistic.
In addition, to measure how well the different cell types separate from each other after correction, we first performed unsupervised clustering on iSMNN, Seurat and MNNcorrect corrected datasets, respectively, using the FindClusters function of Seurat [15], and we assigned a cell type label to each cluster according to the expression profiles of canonical markers (Supplementary Table S2, see Supplementary Data available online at http://bib.oxfordjournals.org/). Then, we carried out differential expression analysis between the clusters of CMs and ECs in iSMNN-, Seurat- and MNNcorrect-corrected data (detailed in Supplementary Section 6, see Supplementary Data available online at http://bib.oxfordjournals.org/). Genes with a log(fold-change) > 0.25 and an adjusted P-value < 0.05 were considered DEGs. GO enrichment analysis was performed for three sets of DEGs: (1) those identified by both iSMNN and Seurat, (2) those identified exclusively by iSMNN and (3) those detected exclusively by Seurat, respectively, using clusterProfiler package [26].
To further validate whether the DEGs we identified in CMs are truly more highly expressed than in ECs, we implemented IHC staining for one DEG specifically identified by iSMNN, Cryab. Briefly, hearts of 3-month-old mice were sequentially perfused with 10 mM KCl, PBS and perfusion buffer (0.5% PFA/5% sucrose in PBS), then fixed in perfusion buffer overnight at 4°C. After dehydration in gradient concentration of sucrose, the heart was then embedded with OCT. The embedded blocks were subsequently sliced and cryosections were stored at −80°C. Before staining, sections (7 μm) were defrosted at room temperature for 5 min. The sections were washed twice in PBST (PBS + 0.1% Tween) and permeabilized with 0.2% Trition X-100 for 15 min at RT. After permeabilization, sections were blocked with 5% BSA in PBS for 1 h at RT and then stained with primary antibodies against Cryab (Proteintech, 15808-1-AP, 1:200), cTnT (Sigma, MS-295-P, 1:200) and Pecam1 (BD, 550274, 1:50) in 1% BSA overnight at 4°C. The next day, after washing three times with PBS, the sections were incubated with the secondary antibody for 1 h in the dark at RT followed by washing three additional times with PBS. Finally, the sections were mounted in Prolong Gold Antifade Mountant with DAPI (Invitrogen). The photos were taken using EVOS.
DATA AND SOFTWARE AVAILABILIY
iSMNN is compiled as an R package and is freely available at https://github.com/yycunc/iSMNN and https://yunliweb.its.unc.edu/iSMNN. We adopted the following data for benchmarking: (1) two mouse hematopoietic scRNA-seq datasets from Nestorowa et al. [24] (GEO accession number GSE81682) and Paul et al. [25] (GEO accession number GSE72857), (2) two 10X Genomics datasets of PBMCs and T cells from Zheng et al. [2] (https://support.10xgenomics.com/single-cell-gene-expression/datasets/) and (3) three cardia datasets of adult murine hearts, one of which was generated in this study (GEO accession number GSE161138) and the other two from Wang et al. (submitted for publication) (GEO accession number GSE157444).
Key Points
MNN detection has been recognized as a sensible approach for batch effect correction in scRNA-seq data. Among MNN based methods, the supervised version (e.g. implemented in our SMNN method) explicitly leverages cell type or state label information and demonstrates superior performance over its unsupervised counterpart.
However, SMNN searches for MNNs from the original expression matrices. The number of MNNs can be rather small in the presence of substantial batch effects, which may lead to insufficient or inaccurate correction.
To address this issue, we propose iSMNN, which performs iterative MNN refinement and batch effect correction. With the iteratively refined MNNs from batch-effect-partially corrected data, iSMNN improves the correction accuracy compared to those using a simple one-iteration correction on the original data.
Our iSMNN method shows clear advantages over two state-of-the-art batch effect correction methods and can better mix cells of the same cell type across batches and more effectively recover the cell-type-specific features in both simulations and real datasets.
Supplementary Material
Conflict of interest
The authors declare no competing interests.
Yuchen Yang is a research assistant professor in the Department of Pathology and Laboratory Medicine and McAllister Heart Institute at the University of North Carolina at Chapel Hill.
Gang Li is a PhD candidate in the Department of Statistics and Operations Research at the University of North Carolina at Chapel Hill.
Yifang Xie is a postdoctoral research fellow in the Department of Pathology and Laboratory Medicine at the University of North Carolina at Chapel Hill.
Li Wang is a research associate in the Department of Pathology and Laboratory Medicine and McAllister Heart Institute at the University of North Carolina at Chapel Hill.
Taylor M. Lagler is a PhD candidate in the Department of Biostatistics at the University of North Carolina at Chapel Hill.
Yingxi Yang is an undergraduate student in the Department of Statistics at the Sun Yat-sen University.
Jiandong Liu is an associate professor in the Department of Pathology and Laboratory Medicine and McAllister Heart Institute at the University of North Carolina at Chapel Hill.
Li Qian is an associate professor in the Department of Pathology and Laboratory Medicine and McAllister Heart Institute at the University of North Carolina at Chapel Hill.
Yun Li is a professor in the Departments of Genetics, Biostatistics and Computer Science at the University of North Carolina at Chapel Hill.
Contributor Information
Yuchen Yang, Department of Pathology and Laboratory Medicine and McAllister Heart Institute at the University of North Carolina at Chapel Hill, NC 27599, USA.
Gang Li, Department of Statistics and Operations Research at the University of North Carolina at Chapel Hill, NC 27599, USA.
Yifang Xie, Department of Pathology and Laboratory Medicine at the University of North Carolina at Chapel Hill, NC 27599, USA.
Li Wang, Department of Pathology and Laboratory Medicine and McAllister Heart Institute at the University of North Carolina at Chapel Hill, NC 27599, USA.
Taylor M Lagler, Department of Biostatistics at the University of North Carolina at Chapel Hill, NC 27599, USA.
Yingxi Yang, Department of Statistics at the Sun Yat-sen University, NC 27599, USA.
Jiandong Liu, Department of Pathology and Laboratory Medicine and McAllister Heart Institute at the University of North Carolina at Chapel Hill, NC 27599, USA.
Li Qian, Department of Pathology and Laboratory Medicine and McAllister Heart Institute at the University of North Carolina at Chapel Hill, NC 27599, USA.
Yun Li, Departments of Genetics, Biostatistics and Computer Science at the University of North Carolina at Chapel Hill, NC 27599, USA.
AUTHORS’ CONTRIBUTIONS
Y.L., L.Q. and Y.Y. initiated and designed the study. Y.Y., G.L., T.L. and Y.Y. implemented the model and performed simulation studies and benchmarking evaluation. Y.X., L.W. and J.L. performed experimental validation. Y.Y., G.L., L.Q. and Y.L. wrote the manuscript, and all authors edited and revised the manuscript.
FUNDING
National Institute of Health (grants R01 HL129132 and R01 GM105785 to Y.L., R01 HL139880 and R01 HL139976 to J.L., R01 HL128331 and R01 HL144551 to L.Q.); American Heart Association (AHA) (18CDA34110340 to L.W., 15GRNT25530005 to J.L., 18TPA34180058 to L.Q.).
References
- 1. Rozenblatt-Rosen O, Stubbington MJT, Regev A, et al. The human cell atlas: from vision to reality. Nat News 2017;550:451. [DOI] [PubMed] [Google Scholar]
- 2. Zheng GXY, Terry JM, Belgrader P, et al. Massively parallel digital transcriptional profiling of single cells. Nat Commun 2017;8:1–12. [DOI] [PMC free article] [PubMed] [Google Scholar]
- 3. Gligorijević V, Pržulj N. Methods for biological data integration: perspectives and challenges. J R Soc Interface 2015;12:20150571. [DOI] [PMC free article] [PubMed] [Google Scholar]
- 4. Bock C, Farlik M, Sheffield NC. Multi-omics of single cells: strategies and applications. Trends Biotechnol 2016;34:605–8. [DOI] [PMC free article] [PubMed] [Google Scholar]
- 5. Stuart T, Satija R. Integrative single-cell analysis. Nat Rev Genet 2019;20:257–72. [DOI] [PubMed] [Google Scholar]
- 6. Wang X, Sun Z, Zhang Y, et al. BREM-SC: a bayesian random effects mixture model for joint clustering single cell multi-omics data. Nucleic Acids Res 2020;48:5814–24. [DOI] [PMC free article] [PubMed] [Google Scholar]
- 7. Zhu L, Lei J, Devlin B, et al. A unified statistical framework for single cell and bulk RNA sequencing data. Ann Appl Stat 2018;12:609. [DOI] [PMC free article] [PubMed] [Google Scholar]
- 8. Stegle O, Teichmann SA, Marioni JC. Computational and analytical challenges in single-cell transcriptomics. Nat Rev Genet 2015;16:133–45. [DOI] [PubMed] [Google Scholar]
- 9. Hicks SC, Townes FW, Teng M, et al. Missing data and technical variability in single-cell RNA-sequencing experiments. Biostatistics 2018;19:562–78. [DOI] [PMC free article] [PubMed] [Google Scholar]
- 10. Kiselev VY, Andrews TS, Hemberg M. Challenges in unsupervised clustering of single-cell RNA-seq data. Nat Rev Genet 2019;20:273–82. [DOI] [PubMed] [Google Scholar]
- 11. Haghverdi L, Lun ATL, Morgan MD, et al. Batch effects in single-cell RNA-sequencing data are corrected by matching mutual nearest neighbors. Nat Biotechnol 2018;36:421–7. [DOI] [PMC free article] [PubMed] [Google Scholar]
- 12. Barkas N, Petukhov V, Nikolaeva D, et al. Joint analysis of heterogeneous single-cell RNA-seq dataset collections. Nat Methods 2019;16:695–8. [DOI] [PMC free article] [PubMed] [Google Scholar]
- 13. Hie B, Bryson B, Berger B. Efficient integration of heterogeneous single-cell transcriptomes using Scanorama. Nat Biotechnol 2019;37:685–91. [DOI] [PMC free article] [PubMed] [Google Scholar]
- 14. Johansen N, Quon G. scAlign: a tool for alignment, integration, and rare cell identification from scRNA-seq data. Genome Biol 2019;20:1–21. [DOI] [PMC free article] [PubMed] [Google Scholar]
- 15. Stuart T, Butler A, Hoffman P, et al. Comprehensive integration of single-cell data. Cell 2019;177:1888–902. [DOI] [PMC free article] [PubMed] [Google Scholar]
- 16. Welch JD, Kozareva V, Ferreira A, et al. Single-cell multi-omic integration compares and contrasts features of brain cell identity. Cell 2019;177:1873–87. [DOI] [PMC free article] [PubMed] [Google Scholar]
- 17. Forcato M, Romano O, Bicciato S. Computational methods for the integrative analysis of single-cell data. Brief Bioinform 2020;22:20–9. [DOI] [PMC free article] [PubMed] [Google Scholar]
- 18. Yang Y, Li G, Qian H, et al. SMNN: batch effect correction for single-cell RNA-seq data via supervised mutual nearest neighbor detection. Brief Bioinform 2020;bbaa097, https://doi.org/10.1093/bib/bbaa097. [DOI] [PMC free article] [PubMed] [Google Scholar]
- 19. Hu J, Li X, Hu G, et al. Iterative transfer learning with neural network for clustering and cell type classification in single-cell RNA-seq analysis. Nat Mach Intell 2020;2:607–18. [DOI] [PMC free article] [PubMed] [Google Scholar]
- 20. Chen M, Zhan Q, Mu Z, et al. Alignment of single-cell RNA-seq samples without over-correction using kernel density matching. Genome Res 2021;31:1–15. [DOI] [PMC free article] [PubMed] [Google Scholar]
- 21. Korsunsky I, Millard N, Fan J, et al. Fast, sensitive and accurate integration of single-cell data with harmony. Nat Methods 2019;16:1289–96. [DOI] [PMC free article] [PubMed] [Google Scholar]
- 22. Polański K, Young MD, Miao Z, et al. BBKNN: fast batch alignment of single cell transcriptomes. Bioinformatics 2020;36:964–5. [DOI] [PMC free article] [PubMed] [Google Scholar]
- 23. Becht E, McInnes L, Healy J, et al. Dimensionality reduction for visualizing single-cell data using UMAP. Nat Biotechnol 2019;37:38–44. [DOI] [PubMed] [Google Scholar]
- 24. Nestorowa S, Hamey FK, Pijuan Sala B, et al. A single-cell resolution map of mouse hematopoietic stem and progenitor cell differentiation. Blood, J Am Soc Hematol 2016;128:e20–31. [DOI] [PMC free article] [PubMed] [Google Scholar]
- 25. Paul F, Arkin Y, Giladi A, et al. Transcriptional heterogeneity and lineage commitment in myeloid progenitors. Cell 2015;163:1663–77. [DOI] [PubMed] [Google Scholar]
- 26. Yu G, Wang L-G, Han Y, et al. clusterProfiler: an R package for comparing biological themes among gene clusters. Omi a J Integr Biol 2012;16:284–7. [DOI] [PMC free article] [PubMed] [Google Scholar]
Associated Data
This section collects any data citations, data availability statements, or supplementary materials included in this article.