Summary
Granulomas are complex cellular structures comprised predominantly of macrophages and lymphocytes that function to contain and kill invading pathogens. Here, we investigated single cell phenotypes associated with antimicrobial responses in human leprosy granulomas by applying single cell and spatial sequencing to leprosy biopsy specimens. We focused on reversal reactions (RR), a dynamic process in which some patients with disseminated lepromatous leprosy (L-lep) transition towards self-limiting tuberculoid leprosy (T-lep), mounting effective antimicrobial responses. We identified a set of genes encoding proteins involved in antimicrobial responses that are differentially expressed in RR versus L-lep lesions, and regulated by IFN-γ and IL-1β. By integrating the spatial coordinates of the key cell types and antimicrobial gene expression in RR and T-lep lesions, we constructed a map revealing the organized architecture of granulomas depicting compositional and functional layers by which macrophages, T cells, keratinocytes and fibroblasts can each contribute to the antimicrobial response.
Introduction
The hallmark of the chronic inflammatory response to a foreign substance that has resisted destruction by an acute inflammatory response is the granuloma. Granulomas have been defined as structures “which are formed by the immune-mediated recruitment of white blood cells, and particularly rich in macrophages”1. In the context of infectious diseases, the function of the granuloma is to sequester and degrade microbial pathogens that have evaded the early immune response.
Leprosy offers an attractive model to investigate the mechanisms by which the human immune system combats intracellular bacteria as the disease presents as a clinical/immunologic spectrum2. The histologic characteristic of leprosy is the granuloma, containing macrophages that have been infected by the pathogen, Mycobacterium leprae, and lymphocytes. Because leprosy manifests as a spectrum of disease in skin, the dynamics are accessible to study, in contrast to tuberculosis granulomas. At one end of the disease spectrum, tuberculoid leprosy (T-lep) typifies the host’s antimicrobial response, which controls the pathogen: there are few lesions, Mycobacterium leprae bacilli are rare, and patients eliminate the infection. At the opposite end, lepromatous leprosy (L-lep) represents susceptibility to disseminated infection, with numerous skin lesions and abundant bacilli. This disease spectrum is dynamic, as patients may undergo a reversal reaction (RR), in which patients generally upgrade, either spontaneously or during chemotherapy, from the lepromatous to the tuberculoid pole.
The structure of granulomas is distinct across the spectrum of leprosy. The granulomas in T-lep contain a core of mature macrophages with occasional multinucleated giant cells. These granulomas are organized with a mantle zone at the periphery of the granuloma containing lymphocytes and characterized by fibrosis. Granulomas in RR lesions are histologically similar to those in T-lep with the presence of intercellular edema. In L-lep, the granulomas are disorganized, and immature lipid-laden foamy macrophages are prominent with lymphocytes scattered throughout.
The study of leprosy lesions has provided insight regarding the host immune response to intracellular bacteria and the architecture of granulomas. Through various approaches, it has been possible to define functional subpopulations of human T cells3, 4, 5, 6 and macrophages7, and their microanatomic distribution, as well as the patterns of cytokine secretion that influence the outcome of infections caused by pathogenic mycobacteria8, 9, 10, 11. The antimicrobial mechanisms that result in the death of the pathogen are central to understanding how granulomas contribute to host defense. Through activation via TLRs and secretion of IFN-γ, the innate and adaptive immune systems trigger the vitamin D-dependent induction of the antimicrobial proteins encoded by CAMP and DEFB4A7, 12, 13. T cells release antimicrobial proteins encoded by GNLY and IL26, which can enter infected macrophages and exert a direct antimicrobial activity4, 5, 14, 15. These human pathways are not present in mice, which utilize other mechanisms such as the release of nitric oxide to kill mycobacteria. Here we integrated single cell RNA-sequencing (scRNA-seq) with spatial sequencing (spatial-seq) to determine the structure of the organized granuloma in leprosy including the potential contribution of specific cell types to the antimicrobial response.
Results
scRNA-seq identifies 12 cell types in leprosy lesions
To study the cellular composition and cell-state differences between RR and L-lep, we performed single cell RNA-sequencing by Seq-Well16 on skin biopsy specimens from five RR and five L-lep patients (Supplementary Table 1). We obtained 21,318 cells from 10 biopsy specimens, detecting an average of 741 genes and 3,556 transcripts per cell (Supplementary Table 1). To study the heterogeneity of these cells, we selected variable genes and performed UMAP dimensionality reduction and cell clustering using the R package Seurat17. We then performed differential expression analysis to find the cluster markers and overlapped the cluster markers to canonical cell type defining signature genes. Ultimately, we recovered 12 primary cell types across all 10 samples (Fig. 1a, b, Supplementary Table 1). These annotated cell types include: T cells (TC), B cells (BC), plasma cells (PLC), myeloid cells (ML), Langerhans cells (LC), mast cells (Mast), keratinocytes (KC), fibroblasts (FB), smooth muscle cells (SMC), endothelial cells (EC), eccrine gland cells (ECG) and melanocytes (MLNC) (Fig. 1c, Supplementary Table 2).
Fig. 1. Cell types observed in leprosy lesions.
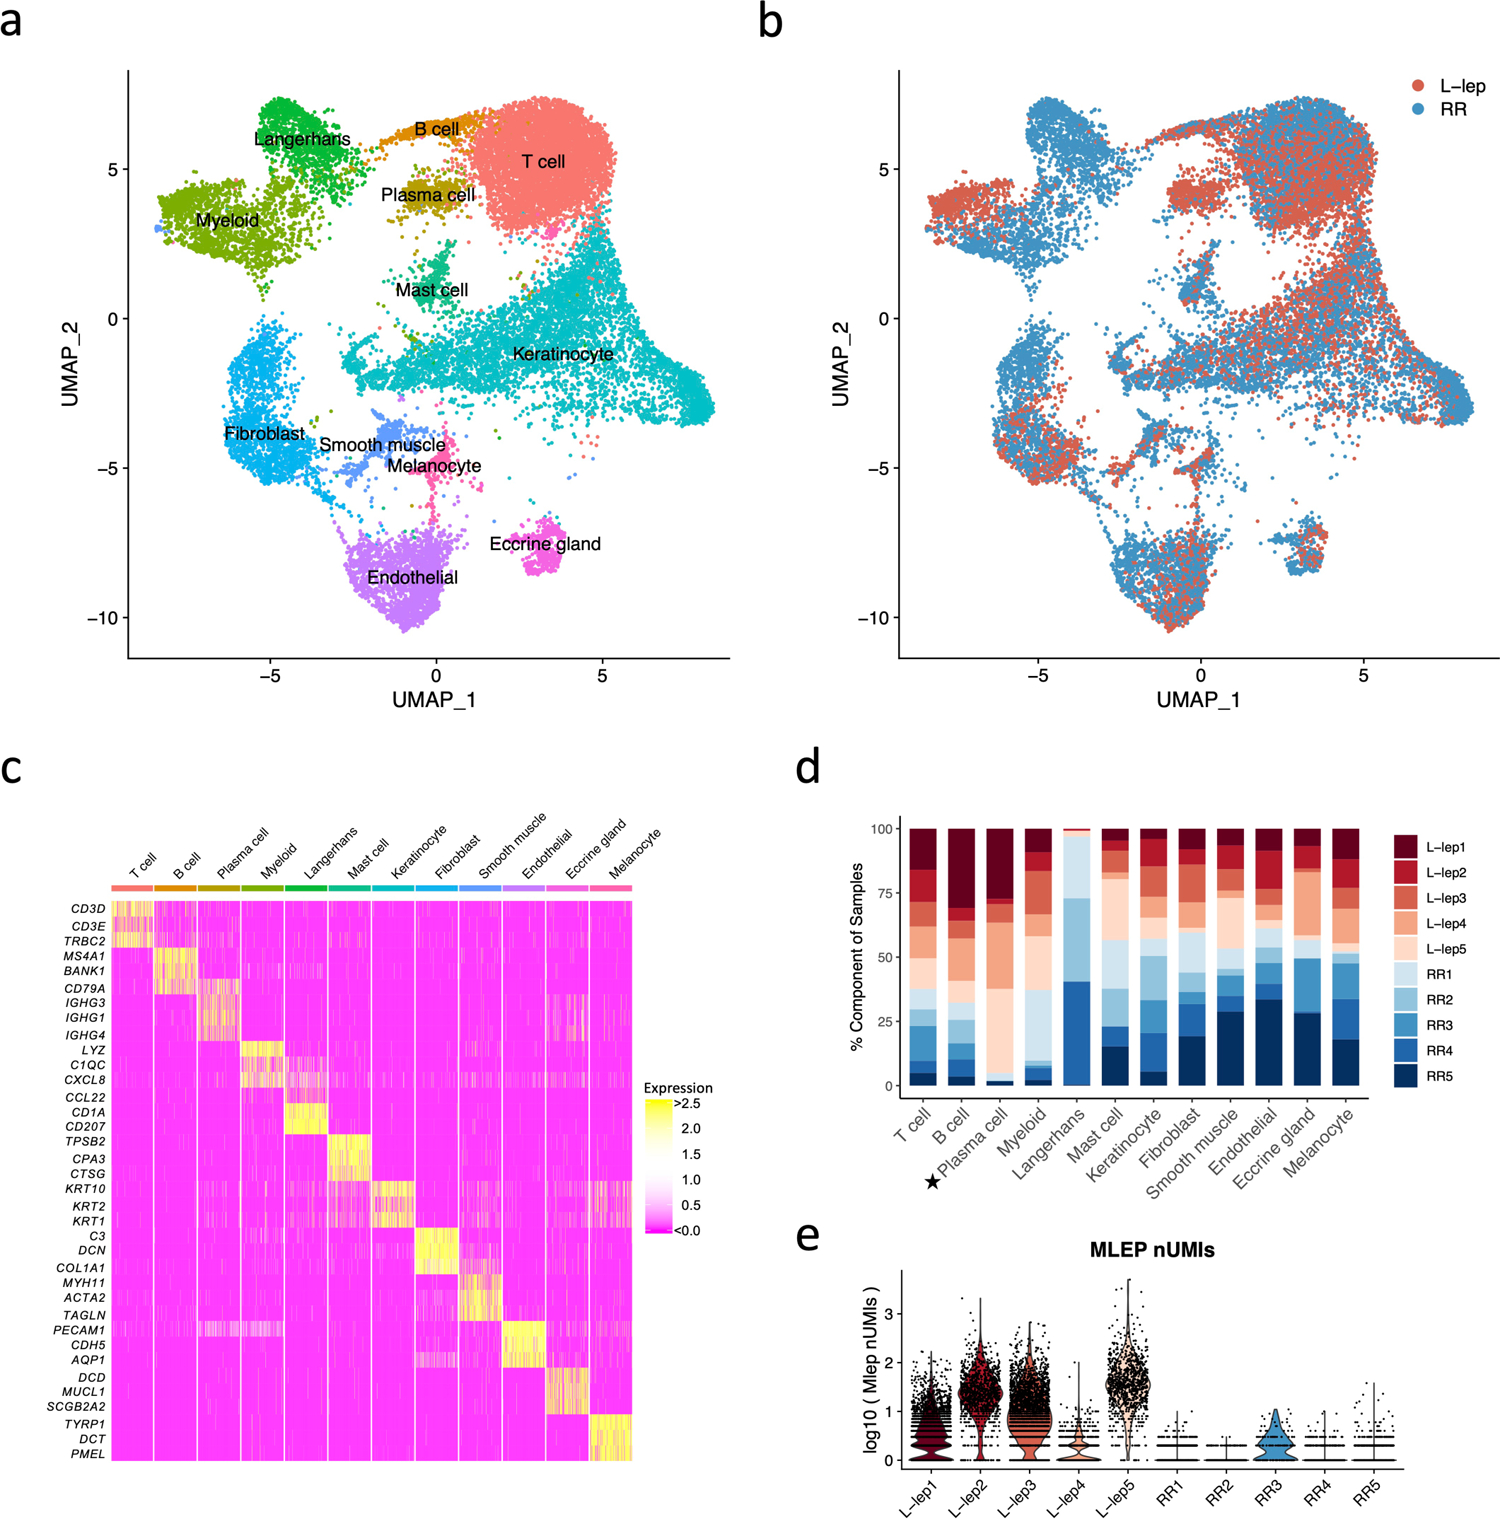
a. UMAP plot for 21,318 cells colored by cell types.
b. UMAP plot colored by clinical forms.
c. Heatmap showing three representative marker genes for each cell type.
d. Abundance composition across all samples for each cell type. T tests were conducted between the L-lep and RR samples for each cell type (excluding the Langerhans cells), only plasma cells had a p value <0.05.
e. Violin plot showing the number of M. leprae transcripts detected in individual cells from each patient.
The major cell types, including T cells, myeloid cells, keratinocytes, endothelial cells and fibroblasts, were found in both RR and L-lep lesions (Fig. 1d). Although B cells were found in both RR and L-lep lesions, plasma cells were derived predominantly from L-lep lesions (p <0.05). Given that LC are more frequent in RR than L-lep lesions3, we isolated CD1a+ cells from the epidermis of three RR patients (RR1, RR2 and RR4) by immunoselection, adding these to the epidermal and dermal cells, accounting for the high frequency of LC from these RR lesions. M. leprae reads were most prevalent in the multibacillary L-lep lesions, but were also detected at a lower level in one RR lesion (Fig. 1e).
Distinct cell subtypes differentiate the immune response
We defined seven T cell sub-clusters, two predominantly derived from RR lesions and one from L-lep lesions, which we annotated using previously defined cluster specific genes (Fig. 2a, Extended Data Fig. 1a, b)18. T cell sub-cluster 0 (TC0), composed of >90% cells from RR samples, expresses the classic Th17 cell markers RORC, RORA, RBPJ and IL23R as signature genes (Fig. 2b, c), but not the major Th17 cytokine genes. TC1 and TC2 are designated as cytolytic T lymphocytes (CTL) as they both contain CD8A, GZMB and PRF1. Because TC1 was derived mainly from the RR lesions and TC2 was mainly derived from the L-lep lesions, they were labelled as RR CTL and L-lep CTL respectively (Fig. 2d). We noted several type I IFN downstream genes in L-lep CTL including IFI44L, MX1, IRF1 and OAS3. Genes up-regulated in L-lep CTL were significantly enriched in type I IFN downstream signatures11 (Extended Data Fig. 1c, Supplementary Table 3). The remaining sub-clusters contained a mixture of cells from RR and L-lep including TC3 (TCM, T-central memory), TC4 (naïve), TC5 (Treg) and TC6 (amCTL; antimicrobial CTL expressing GZMB, PRF1 and GNLY) containing a mixture of tri-cytotoxic T cells (T-CTL)19 and γδ T cells (Fig. 2c).
Fig. 2. Identification of T cell subtypes.
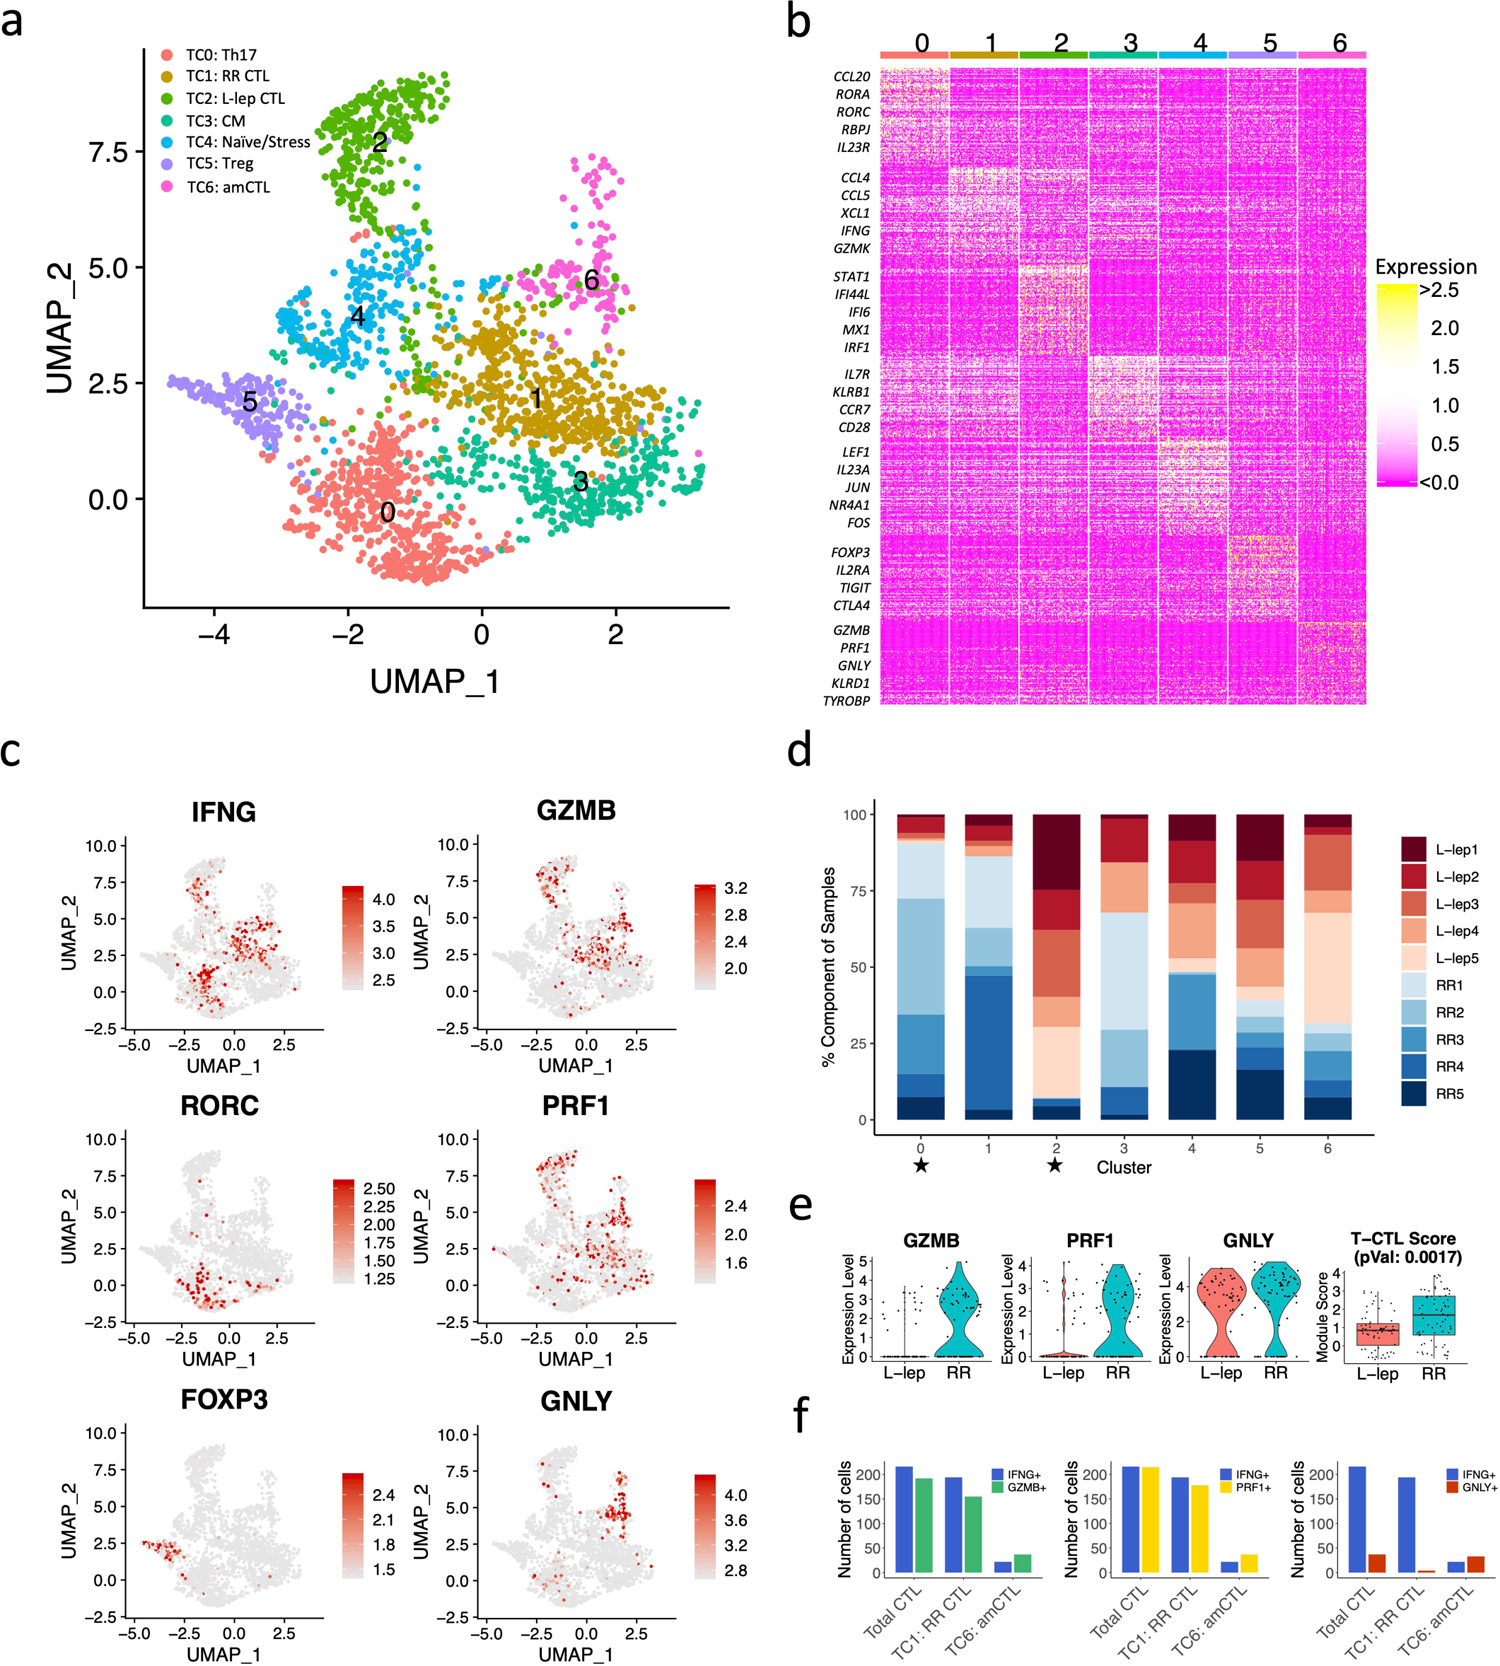
a. UMAP plot for 2,290 T cells colored by subtypes.
b. Heatmap showing marker genes for each subtype. The representative genes are labelled.
c. UMAP plots showing six marker genes. The color scale represents normalized expression level of the gene.
d. Abundance composition across all samples for each T cell subtype. Two sided T tests were conducted between the L-lep and RR samples (5 vs 5) for each subtype, TC0 and TC2 had p values <0.05.
e. (Left) Violin plots showing the expression for GZMB, PRF1 and GNLY in T cell sub-cluster 6 grouped by L-lep and RR. (Right) Boxplot showing the T-CTL score in T cell sub-cluster 6 grouped by L-lep and RR, the p value (0.0017) was calculated from a two-sided Wilcoxon rank sum test (64 L-lep cells vs 70 RR cells). The bounds of the box represent the first and third quartile, the middle bar represents the median.
f. Number of RR cells expressing IFNG, GMZB, PRF1 and GNLY in RR CTL and amCTL.
We previously described a functional CTL subset, amCTL, expressing GZMB, PRF1 and GNLY, that exert antimicrobial activity against intracellular M. leprae and correlate with protective immunity to tuberculosis and leprosy19, 20. In TC6, the expression of GZMB, PRF1 and GNLY was greater in cells from RR vs. L-lep lesions. The module score aggregating the expression of these three antimicrobial CTL genes was significantly greater in RR lesions (Fig. 2e). IFNG was most strongly expressed by Th17 cells and RR CTL but was also present in amCTL and L-lep CTL (Fig. 2c). The frequency of IFNG expressing cells was similar to the frequency of GZMB and PRF1 expressing cells in RR CTL and amCTL, but was far greater than the frequency of GNLY expressing cells in RR lesions (Fig. 2f, Extended Data Fig. 1d). These data indicate that IFNG is a marker for all CTL, but is not a useful marker for estimating amCTL, the small subset of CTL that express GNLY, and shown to kill the bacteria within infected cells.
We identified five myeloid sub-clusters, three predominantly derived from the RR lesions and two from the L-lep lesions (Fig. 3, Extended Data Fig. 2a, b). ML0 (dendritic cells), containing cells from approximately 75% of RR lesions, is comprised of a mixture of dendritic cells with distinct subpopulations expressing CD1C and LAMP3 (Fig. 3a–d, Extended Data Fig. 2c). ML1 (Type I IFN macrophages), containing >90% cells from L-lep lesions, are macrophages that express type I IFN downstream genes including IFI44L, MX2 and IFIT3, hence categorized as Type I IFN macrophages (Fig. 3c). ML2 (TREM2 macrophages), containing >90% of cells from L-lep lesions, was characterized by high expression of TREM2 and APOE, resembling the TREM2 macrophages reported in seven diseases characterized by altered lipid metabolism but not previously in human infectious disease21, 22, 23, 24, 25, 26, 27. ML4, containing approximately 85% of cells from RR lesions, are M1-like macrophages. ML3 was derived from three RR lesions and two L-lep lesions, connecting TREM2 macrophages and M1-like macrophages (Fig. 3b, d), expressing genes from both sub-clusters (Extended Data Fig. 2d). TREM2 and APOE expression, as well as a TREM2 score comprised of nine conserved genes from the datasets from the seven studies of lipid metabolism diseases, were highest in TREM2 macrophages from L-lep lesions, declining in transitional macrophages and M1-like macrophages in RR lesions (Fig. 3e, Extended Data Fig. 2e). The leprosy myeloid subtypes, dendritic cells, type I IFN macrophages, TREM2 macrophages and transitional macrophages all had corresponding cell subpopulations in the scRNA-seq analysis of lung specimens from a non-human primate model of tuberculosis28. However, we could not detect an analogous M1-like macrophage population as the one found in RR lesions in the non-human primate tuberculosis lung data (Extended Data Fig. 2f).
Fig. 3. Identification of myeloid cell subtypes.
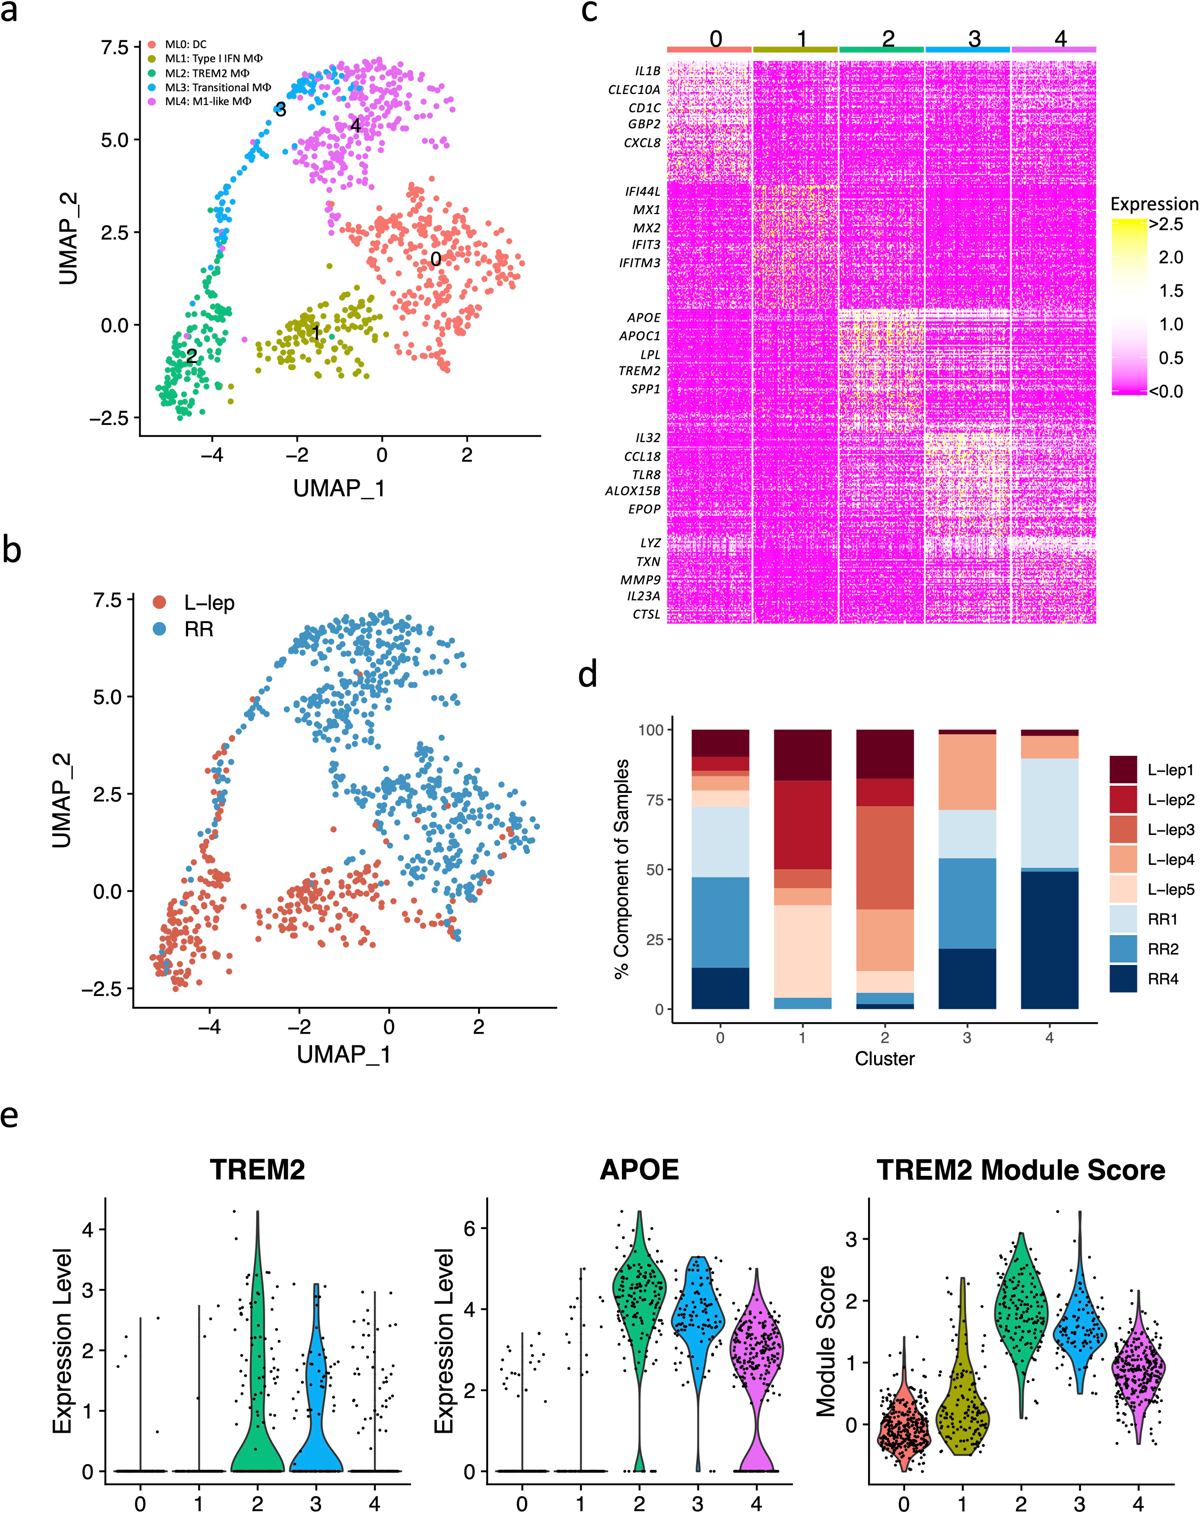
a. UMAP plot for 991 myeloid cells colored by subtypes.
b. UMAP plot colored by clinical forms.
c. Heatmap showing marker genes for each subtype. The representative genes are labelled.
d. Abundance composition across all samples for each myeloid cell subtype.
e. (Left) Violin plots showing the expression for TREM2 and APOE in myeloid subtypes. (Right) Violin plot showing the TREM2 Module score in myeloid subtypes.
Of seven keratinocyte sub-clusters, two were enriched in RR patients, KC3 (FLG+ granular layer keratinocytes) and KC4 (KRT14/15+ basal layer keratinocytes), and two enriched in L-lep patients, KC1 and KC5, both derived from spinous layer keratinocytes (Extended Data Fig. 3a–d). The RR enriched KC3 and KC4 clusters had increased expression of genes that contribute to antimicrobial responses (Extended Data Fig. 3c). By contrast, no increase was observed for either inflammatory or antimicrobial gene expression in the two L-lep keratinocyte clusters (KC1 and KC5). KC0 (spinous-1 keratinocytes), KC2 (supraspinous keratinocytes) and KC6 (hair follicle keratinocytes) were derived from both RR and L-lep samples.
SFRP2+ fibroblasts (FB0) and CXCL2+ fibroblasts (FB2) were enriched in RR lesions (Extended Data Fig. 3e–g). The SFRP2+ fibroblast sub-cluster is similar to a counterpart in normal skin, sharing expression of COL3A1, COL18A1 and COMP29. SFRP2+ fibroblasts from skin have been shown to have the capacity to release extracellular matrix proteins29. The SFRP2+ fibroblasts more strongly express genes that encode proteins involved in the deposition and modeling of the extracellular matrix including VIM (vimentin), SPARC (osteonectin), FBN1 (fibrillin-1), TNC (tenascin), FBLN2 (fibulin-2), LOXL1 (lysyl oxidase homolog 1), as well as various collagens. By contrast, the CXCL2+ fibroblasts express a number of inflammatory genes as specific marker genes including IL6, CCL2, CXCL3, CXCL8 and IL32, which displays a similar expression profile to the inflammatory fibroblasts detected in atopic dermatitis skin lesions30. Two fibroblast sub-clusters were predominantly derived from L-lep lesions: MGP+ fibroblasts (FB1) and COL11A1+ fibroblasts (FB3)29.
Two endothelial cell sub-clusters, LYVE1+ lymphatic EC (EC4) and HEY2+ EC (EC5) were mainly derived from RR lesions. MEOX2+ EC (EC3) were primarily found in L-lep lesions (Extended Data Fig. 3h–j); MEOX2 is an inhibitor of NF-κB activation in endothelial cells31.
Antimicrobial genes were highly expressed in RR cell types
Given that leprosy RRs are associated with a reduction in viable M. leprae bacilli in lesions, we sought to determine the array of antimicrobial genes that were present in defined cell populations. To do so, we first integrated a list of 1,404 “antimicrobial genes” curated by Genecards known to encode proteins that contribute to antimicrobial responses with the scRNA-seq data. We then separated each cell type (including subtype) into RR versus L-lep cells and calculated the gene expression z scores for each cell type (Methods). We found that RR cell types have a higher expression pattern for the antimicrobial genes (Fig. 4a). We obtained 1,124 antimicrobial genes with a z score ≥3 in at least one RR cell type, indicating that these cells, in aggregate, produce relatively more of the specific transcript than other cell types. We identified the upstream regulators of the 1,124 antimicrobial genes using Ingenuity Pathways Analysis (Methods), with IFNG, TNF and IL1B having the highest enrichment scores (Fig. 4b). The sum of the z scores for the top 20 upstream regulators of the antimicrobial genes was greater in the RR as compared to the L-lep cell types (Fig. 4c).
Fig. 4. Antimicrobial gene analysis and pseudotime construction.
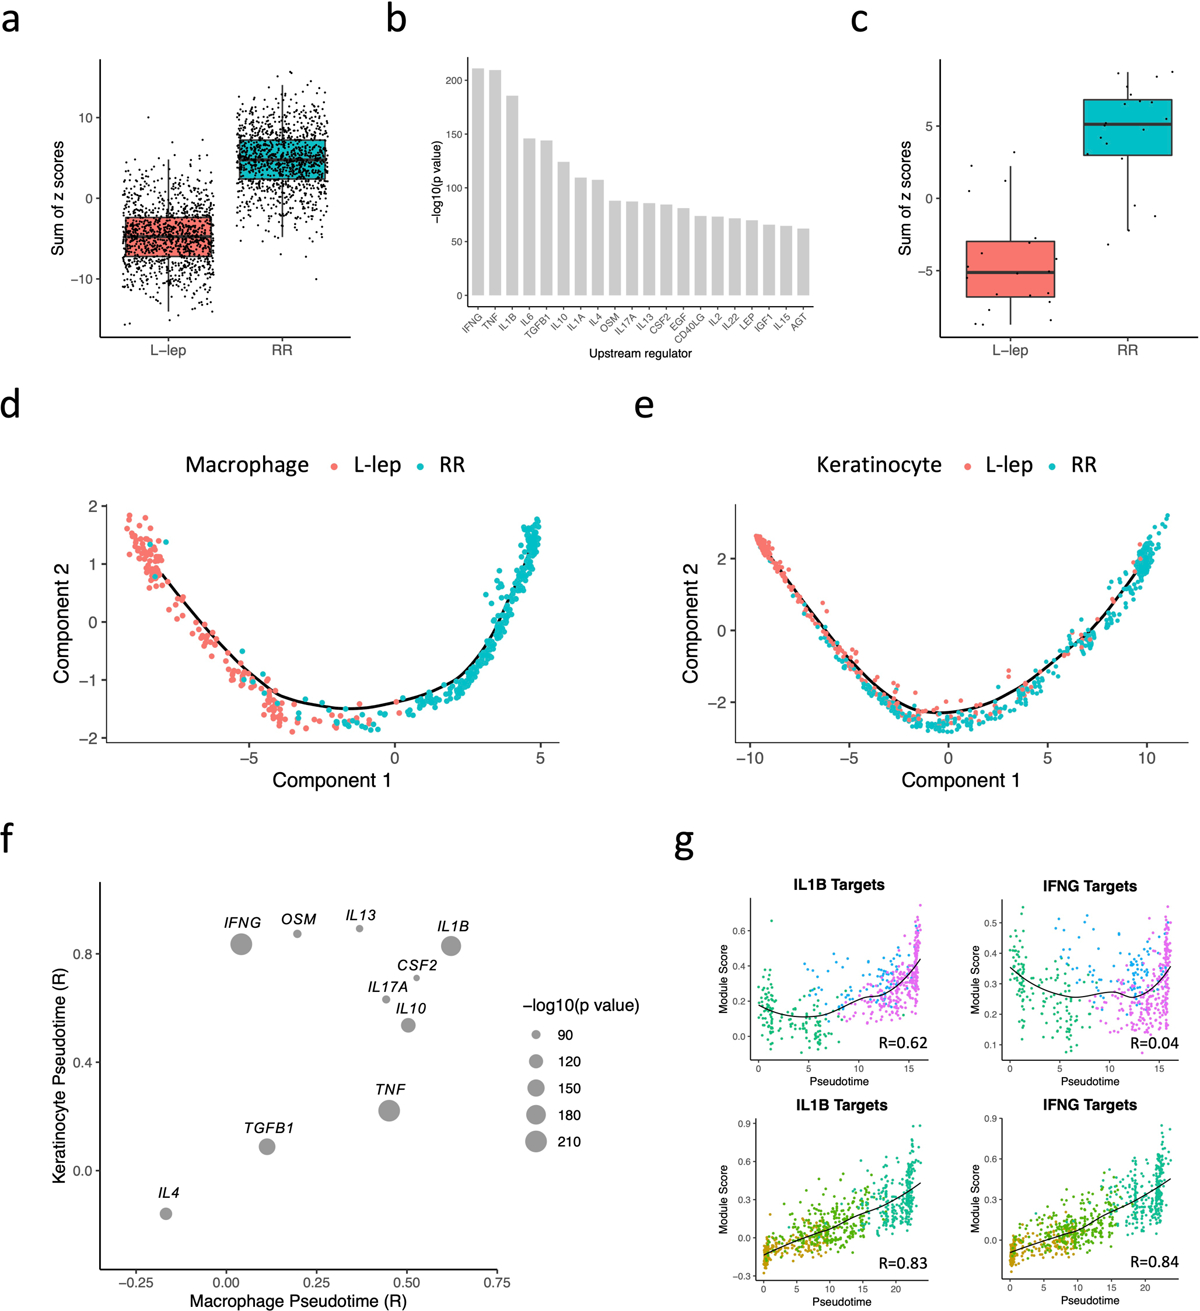
a. Boxplot showing the sum of 1,124 antimicrobial gene z scores in L-lep and RR cell types. The p value (< 2.2e-16) was calculated from a two-sided T test (n = 1,124). The bounds of the box represent the first and third quartile, the middle bar represents the median.
b. Bar graph showing the top 20 upstream regulators ranked by p value from the enrichment analysis using the 1,124 antimicrobial genes.
c. Boxplot showing the sum of the z scores for the top 20 upstream regulators in L-lep and RR cell types. The p value (3.5e-09) was calculated from a two-sided T test (n = 1,124). The bounds of the box represent the first and third quartile, the middle bar represents the median.
d. Pseudotime trajectory colored by clinical form in myeloid sub-cluster 2, 3 and 4.
e. Pseudotime trajectory colored by clinical form in keratinocyte sub-cluster 1, 2 and 3.
f. Dot plot showing the correlation between the module scores of the top 10 upstream regulators and macrophage/keratinocyte pseudotimes. The size of the dots represents the −log10(p value) from the enrichment analysis.
g. Scatter plot showing the correlation between macrophage (top) or keratinocyte (bottom) pseudotimes and module scores calculated using IL1B target genes or IFNG target genes from the six expression patterns. Color of the dots represents the sub-cluster identity of the cells.
Pseudotime analysis in macrophages and keratinocytes
The continuum from ML2 to ML4 observed on the UMAP suggests a continuous progression between cellular states. To better characterize the progressive differences, we used Monocle, a pseudotime analysis program32, to create a continuous trajectory in which cells were ordered from TREM2 macrophages (ML2), to transitional macrophages (ML3), terminating with M1-like macrophages (ML4) (Extended Data Fig. 4a, b). This trajectory starts from L-lep cells and ends with RR-derived cells, which mirrors the clinical progression in patients (Fig. 4d). Using a similar analysis on spinous-2 KC (KC1), supraspinous KC (KC2) and granular KC (KC3), we identified a pseudotime continuum of the cells from these clusters (Extended Data Fig. 4c, d) that also progresses from L-lep to RR derived cells (Fig. 4e).
To identify the upstream regulators which trigger the antimicrobial response, we analyzed the variable genes from the six progressive gene programs that defined the pseudotime trajectories (Extended Data Fig. 4b, d, Supplementary Table 4). We calculated a module score for each upstream regulator using the targets found in all six patterns and calculated the correlation coefficient between the module score and the pseudotime (Methods). Of the top upstream regulators for the antimicrobial genes, only the target scores for IL1B were highly correlated with both the macrophage and keratinocyte pseudotime (R=0.63 and 0.83, respectively) (Fig. 4f, g). The target scores for IFNG correlated with keratinocyte (R=0.84) but not macrophage pseudotime (R=0.04). To this end, we selected for further study the IFNG and IL1B target genes, as IFNG had the highest enrichment score for the antimicrobial genes, and IL1B was not only a top upstream regulator of the antimicrobial genes but the expression of the IL1B target genes was highly correlated with both macrophage and keratinocyte pseudotimes.
Cell networks reveal an antimicrobial ecosystem in RR
To construct a gene network depicting the antimicrobial response in RR, we first determined the source of the two key upstream regulators. IFNG was detected (z score ≥3) in RR cells from Th17 cells and RR CTL, and IL1B was detected in RR cells from Langerhans cells and dendritic cells (Fig. 5a).
Fig. 5. Antimicrobial network induced by IL1B and IFNG.
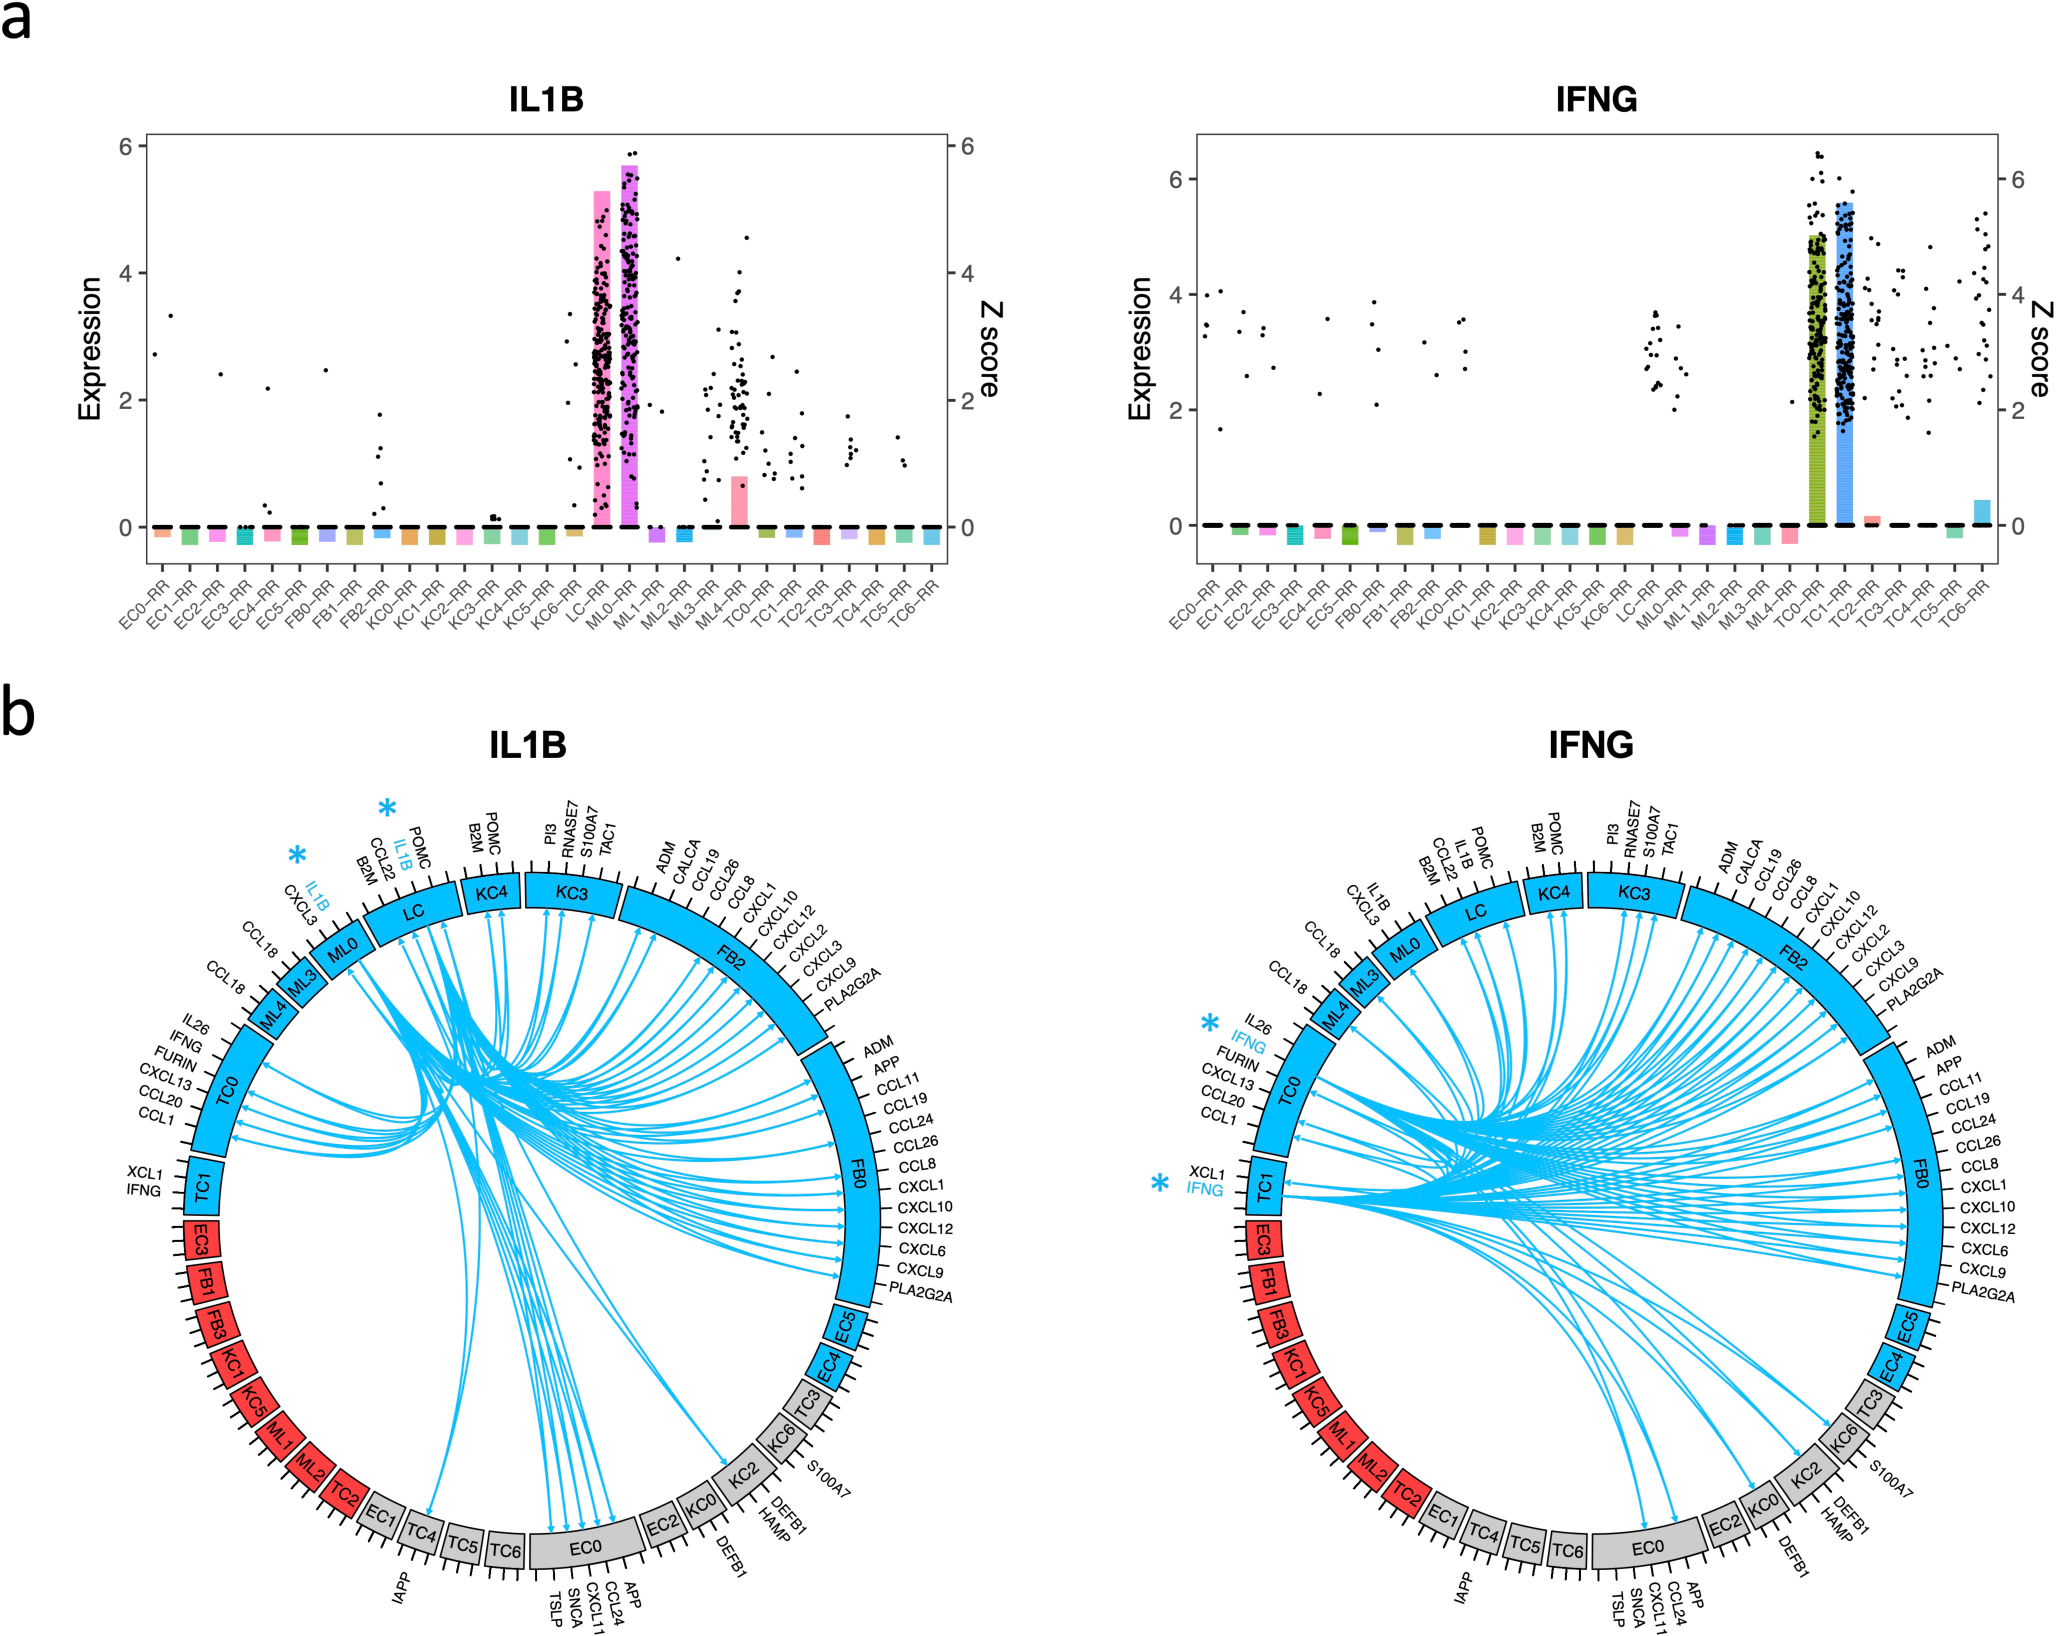
a. Bar plot showing the z scores of IL1B (left) or IFNG (right) expression levels in each cell type from RR lesions. The dots represent IL1B or IFNG expression level in individual cells.
b. Circos plot showing the connection between IL1B (left) or IFNG (right) and the direct antimicrobial gene targets in the cell types with z score >3. The color represents patient composition of the cell type. Red: L-lep specific; Blue: RR specific; Grey: mix of L-lep and RR.
We constructed circos plots to depict the interactions of the IL1B and IFNG expressing cells with the target antimicrobial gene expressing cells (Fig. 5b). For clarity, we limited the number of interactions to the 61 antimicrobial genes that encode proteins with direct antimicrobial activity and with a z score ≥3 in at least one of the major RR cell types (Extended Data Fig. 5a). In view of the variable expression of the genes encoding the receptors for IL-1β and IFN-γ, we inferred connections between the upstream regulators and these antimicrobial genes as identified using Ingenuity Pathway Analysis. IL1B and IFNG both regulated 22 antimicrobial gene targets and individually regulated 14 additional antimicrobial genes, for a total of 36 unique genes. For both IL1B and IFNG, the majority of connections were to cell types that were predominantly derived from RR lesions, and strikingly there were no connections to a cell type that was predominantly derived from L-lep lesions. Both CXCL2+ fibroblasts and SFRP2+ fibroblasts expressed several chemokine genes that encode for proteins with antimicrobial activity.
In an effort to validate the relevance of antimicrobial genes upregulated in RR lesions, we identified 59 genes that have been reported to be contribute to host defense against leprosy and other mycobacteria (Supplementary Table 5, 6). Of the 59, 34 genes encode for proteins with direct antimicrobial activity33. There were an additional seven genes reported as directly antimicrobial that had not previously been reported to be involved in the immune response to mycobacteria. We plotted the z scores for these 66 antimicrobial genes in a heat map arranged according to the specific cell type in which the antimicrobial gene was most strongly expressed (Extended Data Fig. 5b). Strikingly, we found that each major cell type highly expressed a distinct set of antimicrobial genes. For example, CYBB was predominantly expressed in M1-like macrophages (ML4) and LCs, CCL5 was predominantly expressed by RR CTL (TC1), MMP2 was predominantly expressed by SFRP2+ fibroblasts (FB0) and CXCL2+ fibroblasts (FB2), and KLK5 was predominantly expressed by granular keratinocytes (KC3).
Spatial-seq identifies the coordinates of the cell types
To localize the various cell types and antimicrobial responses within the granuloma architecture, we performed spatial-seq on leprosy skin biopsy specimens (Fig. 6a). We detected 708 spatially-defined spots with an average of 2,984 genes and 10,007 transcripts per 55μm spot. We annotated the cell-type composition for each spot by decomposing the spatial gene expression using the scRNA-seq gene expression of the major cell-types, displayed as a scatter-pie plot, which contains a pie chart for each spot scattered across the spatial array (Extended Data Fig. 6a). Thus, we identified the distribution of the five major cell type clusters revealing distinct small aggregates of myeloid cells, T cells and fibroblasts in the dermis (Fig. 6b, Supplementary Table 7), and calculated the cell type composition scores for each cluster (Extended Data Fig. 6b). We also performed spatial-seq on a skin biopsy specimen from a T-lep patient (Extended Data Fig. 6c–f), as RRs represent a transition from the lepromatous to the tuberculoid pole, and two additional RR samples (Extended Data Fig. 7a–b). The cell-type composition in the T-lep sample was similar to the RR samples.
Fig. 6. Spatial sequencing recapitulates the same set of antimicrobial genes in the corresponding cell types.
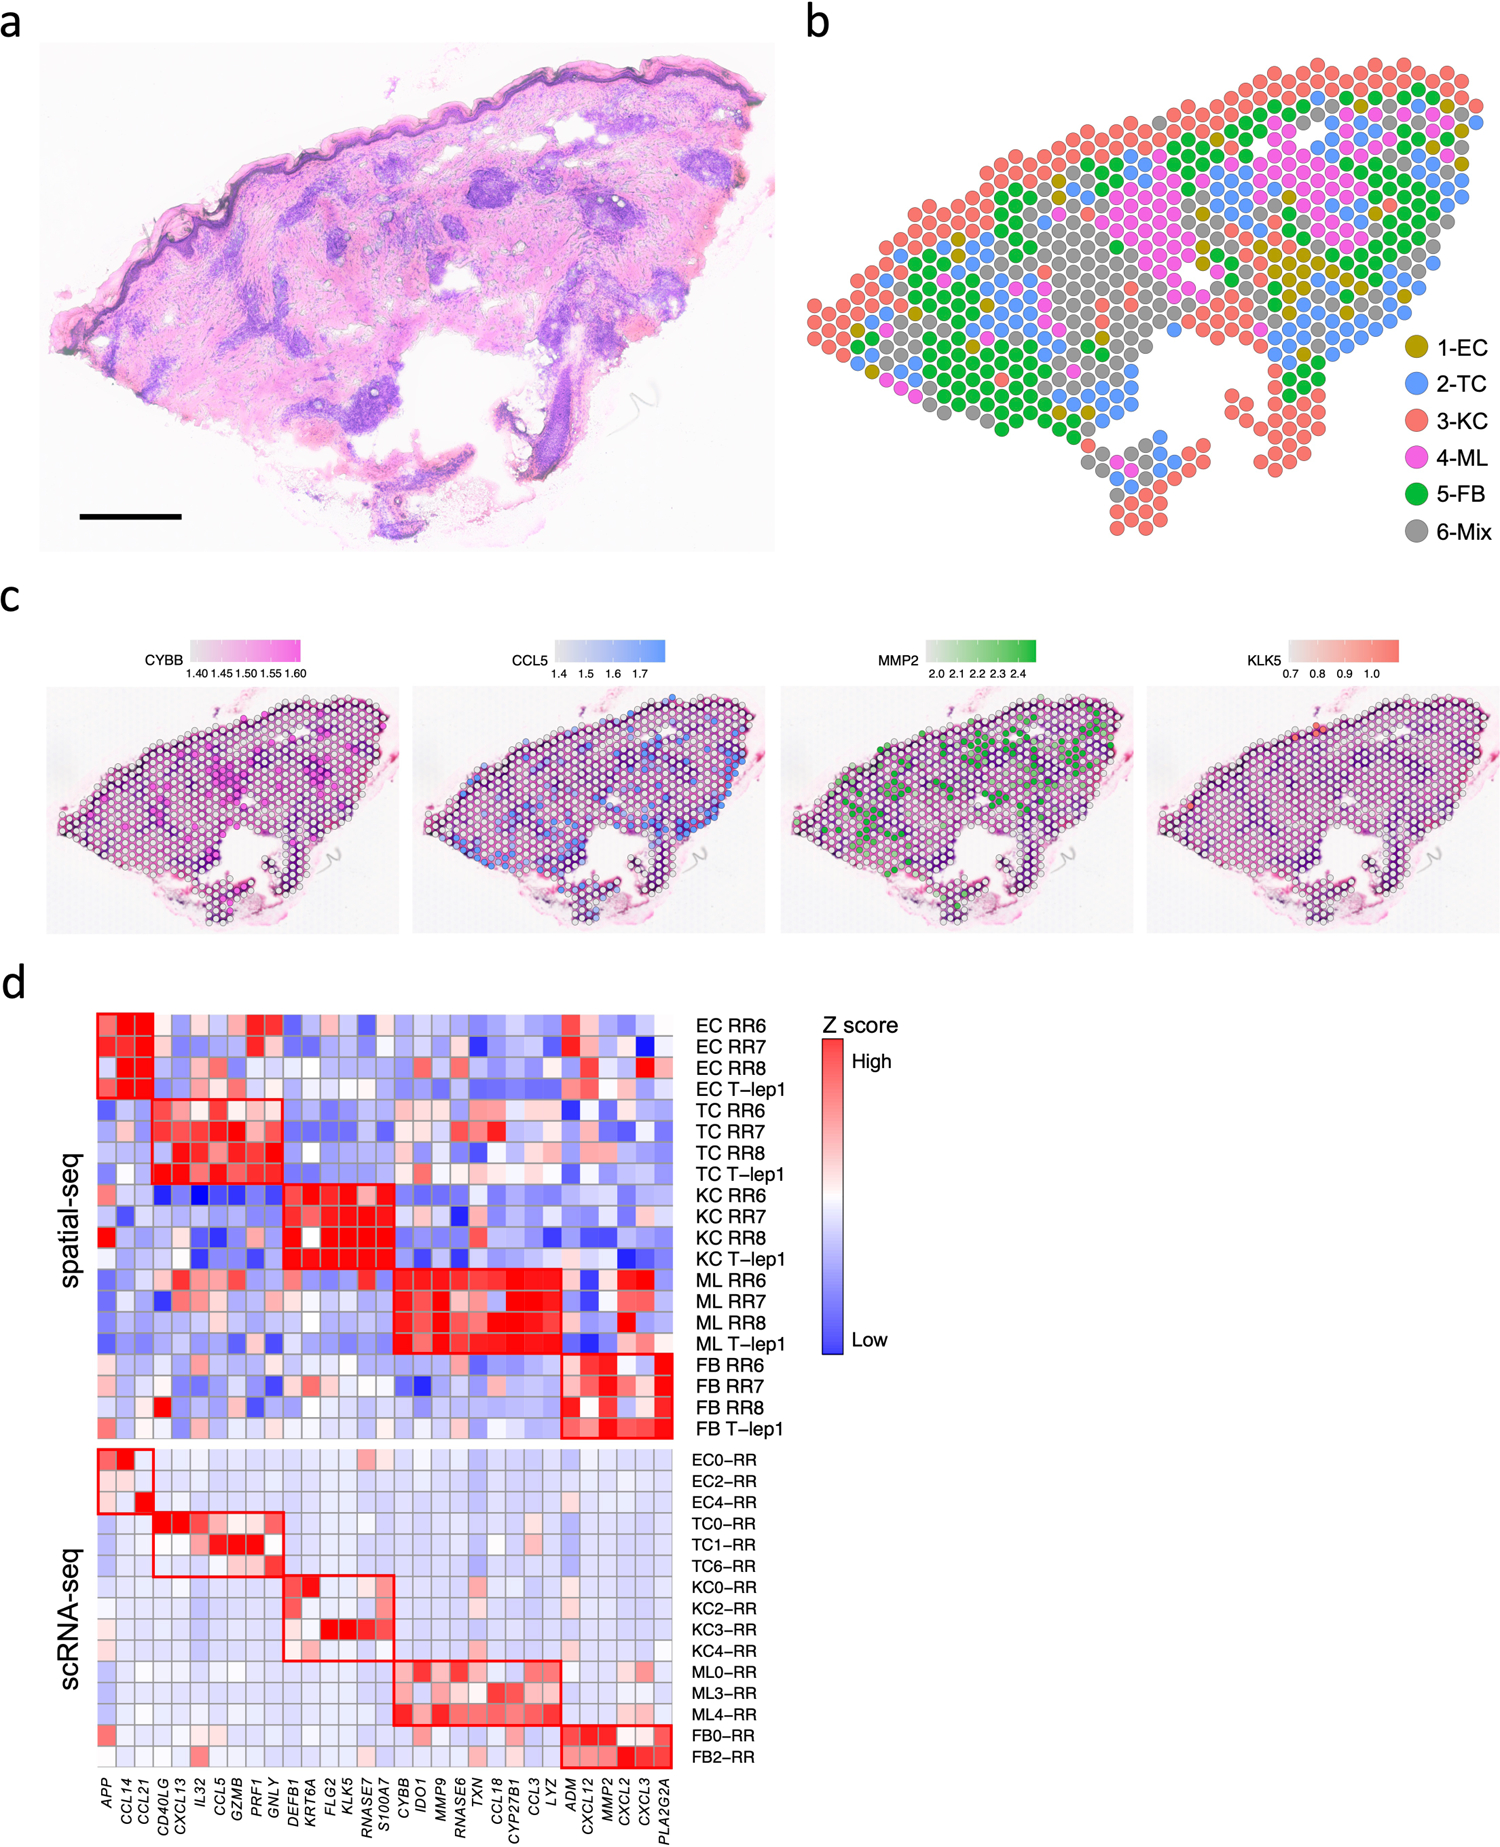
a. H & E staining of the RR6 biopsy used for spatial sequencing. Scale bar: 0.5 mm.
b. Spatial plot for 708 spots colored by clusters, the coordinates of the spot correspond to the location in the tissue.
c. Spatial plots showing expression level of four antimicrobial genes. The colors correspond to the cluster colors in B. CYBB was highly expressed in myeloid cells, CCL5 in T cells, MMP2 in fibroblasts and KLK5 in keratinocytes.
d. Heatmaps showing 31 antimicrobial genes expressed in the same cell types in both spatial-seq and scRNA-seq. All the RR and T-lep spatial-seq samples were plotted. The red boxes indicate distinct sets of antimicrobial genes highly expressed in a certain cell-type. RR: reversal reaction; T-lep: borderline tuberculoid.
We also sought to localize the RR cell subtypes in the morphologic context of the granuloma within the leprosy skin lesion. Strikingly, SFRP2+ fibroblasts (FB0) were located in the superficial “papillary” dermis near the dermal-epidermal junction, whereas CXCL2+ fibroblasts (FB2) were located deeper in the “reticular” dermis around the granulomas (Extended Data Fig. 7c). The gene signatures of the leprosy fibroblasts were distinct from the signatures that defined the spatial location of fibroblast subtypes in healthy skin34. We quantified the distinct locations of the fibroblast subtypes by measuring the distance between KRT1+ and KRT10+ keratinocytes and each fibroblast subtype in the RR and T-lep spatial-seq samples. In three of the four samples, SFRP2+ fibroblasts (FB0) were half the distance to the epidermis than CXCL2+ fibroblasts (Extended Data Fig. 8a–d). Over the four specimens, SFRP2+ fibroblasts (FB0) were approximately half the distance to the epidermis than CXCL2+ fibroblasts (FB2) (p<1.4×10⁻¹⁴, Extended Data Fig. 8e). The spatial-seq data validates the predictions of the epidermal layers from the scRNA-seq data for granular keratinocytes (KC3), spinous keratinocytes (KC0) and basal keratinocytes (KC4). The transitional macrophages (ML3) and M1-like macrophages (ML4) localized to the large myeloid aggregates with rare dendritic cells (ML0) occasionally at the periphery. In contrast, Th17 cells (TC0), RR CTL (TC1) and amCTL (TC6) were present in the mantle zone.
Spatial mapping of four representative antimicrobial genes with defined distributions among the major cell-type sub-clusters in the scRNA-seq data (Fig. 6c), confirmed that the spatial localization of each gene mapped to the location of the corresponding cell type in the RR spatial-seq data, including CYBB in the two aggregates of spots that were identified as myeloid cells, CCL5 in T cell spots, MMP2 in fibroblast spots and KLK5 in regions corresponding to granular keratinocytes (KC3), particularly in the T-lep sample.
We validated the location of three antimicrobial genes expressed by keratinocytes by immunohistochemistry (Extended Data Fig. 9a–c). DEFB1 protein was detected in the cytoplasm throughout the epidermis in all three RR specimens, and in one of three L-lep specimens, consistent with the gene expression in both the supraspinous (KC2) and spinous (KC0) keratinocytes by scRNA-seq. The more prominent expression of CXCL14 protein in the basal layer in two of three RR lesions corroborated the CXCL14 mRNA detection in the basal (KC4) keratinocytesCXCL14 protein was absent in the L-lep epidermis. TAC1 was expressed in granular (KC3) keratinocytes, with TAC1 protein present, albeit subtly, in the granular layer of the RR but not the L-lep samples. We also found that KC secretion of the DEFB1, CXCL14 and TAC1 antimicrobial peptides exerted an antimicrobial activity, ranging from 50–100%, against M. leprae in infected macrophages (Extended Data Fig. 9d).
We also investigated the expression of the 66 genes encoding proteins contributing to the antimicrobial response identified in the scRNA-seq data (Extended Data Fig. 5b), finding that 52 of these genes were detected by spatial-seq of the RR and T-lep lesions. Of the 52 antimicrobial genes, 31 had high expression in the corresponding cell types in both the scRNA-seq and the spatial-seq data (Fig. 6d, Supplementary Table 6), with the remaining 21 genes having low or moderate expression in the corresponding spatial-seq cell type. Thus, the spatial-seq data validated the antimicrobial gene expression identified in the scRNA-seq data.
The spatial-seq analysis of two L-lep skin biopsy specimens, representing the multibacillary form of the disease, revealed that the inflammatory infiltrate was composed of large aggregates of myeloid cells juxtaposed with smaller aggregates of plasma cells, along with several other cell types (Extended Data Fig. 10a–b). We validated the distribution of TREM2 macrophages in leprosy by interrogating the spatial-seq data with the nine gene TREM2 macrophage consensus score in all the spatial-seq specimens (Extended Data Fig. 10c). The TREM2 module score was robustly expressed in both L-lep lesions as compared to the T-lep/RR specimens (L-lep vs. T-lep/RR, p value <2.2×10⁻¹⁶), although the range of the TREM2 macrophage score in the T-lep lesion overlapped with the RR and L-lep lesions (Extended Data Fig. 10d).
We reasoned that adjacency in spatial location would facilitate cell-cell interactions. By quantifying the neighboring spots, as shown in the scatter-pie plot (Fig. 7a), we found that in T-lep/RR samples, myeloid cells were most adjacent to T cells, the keratinocytes were adjacent to the fibroblasts, and the fibroblasts were equidistant from all the cell types (Extended Data Fig. 10e). The results from the two L-lep samples indicate that the immune cells, myeloid cells, plasma cells and T cells, were close to each other, with the fibroblasts were close to the myeloid cells (Extended Data Fig. 10f).
Fig. 7. Granuloma architecture and antimicrobial ecosystem obtained by scRNA-seq and spatial-seq.
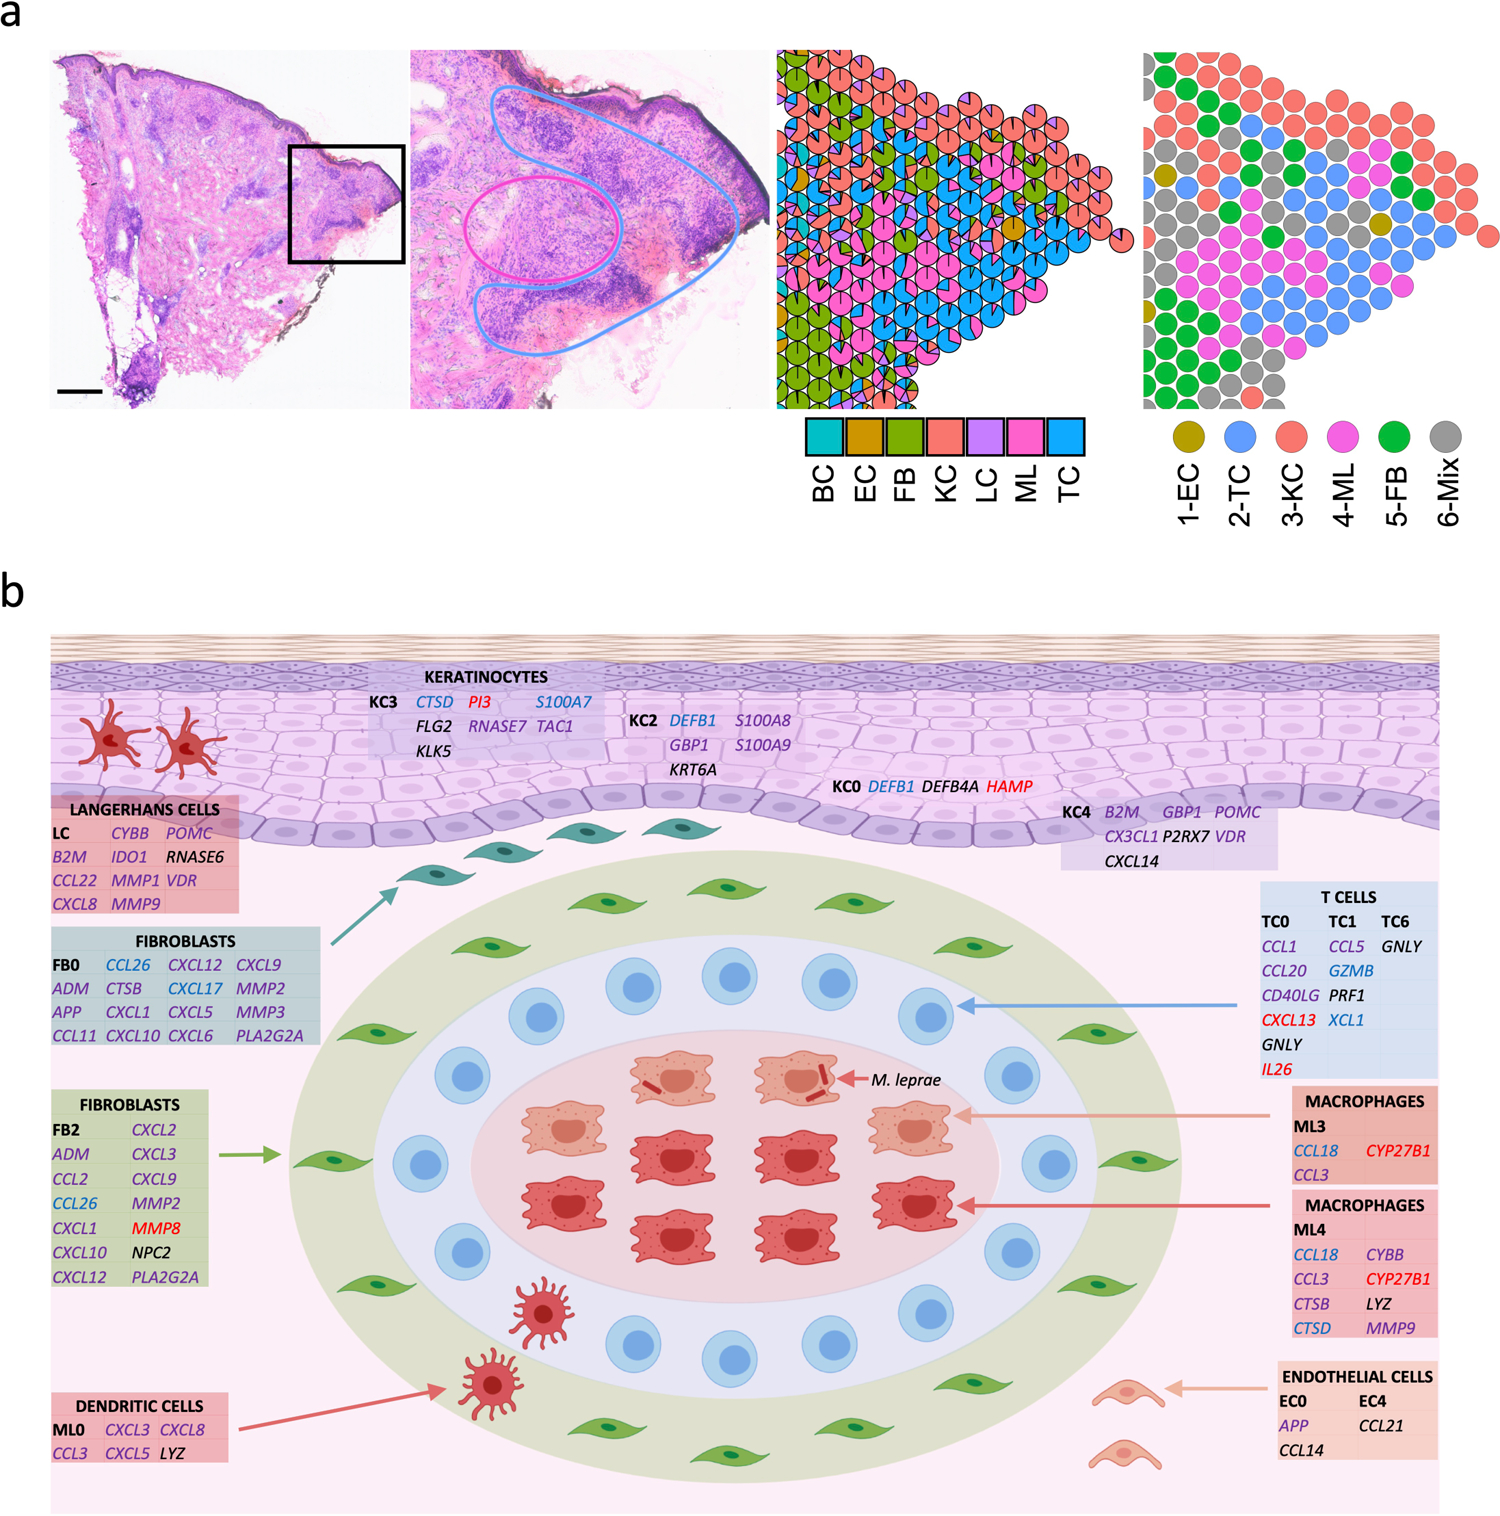
a. H & E staining of the T-lep biopsy and the cell type composition highlighting the myeloid cells in the center of the granuloma and the T cells and fibroblasts at the periphery. Scale bar: 0.5 mm.
b. Granuloma architecture and antimicrobial ecosystem. Gene names in red represent targets of IL1B. Gene names in blue represent targets of IFNG. Gene names in purple represent targets of both IL1B and IFNG. Gene names in black were curated from known antimicrobial pathways.
Spatial-seq maps the architecture of organized granulomas
The T-lep lesion contained a classic organized granuloma in the dermis of the biopsy specimen, composed of a core of macrophages surrounded by a mantle of aggregated lymphocytes (Fig. 7a). The spatial-seq data validated the histology for this region, showing the myeloid aggregates surrounded by T cells as well as regions of fibroblasts in the superficial dermis and around the myeloid aggregates. Close examination of the scatter-pie representation of this region identified some heterogeneity in the composition of the spots.
Thus, by integrating the scRNA-seq and spatial-seq data, we were able to create a model of the organized granuloma structure defined by cell subtypes and antimicrobial pathways (Fig. 7b). The model of the organized granuloma is composed of a core of macrophages, both transitional macrophages (ML3) and M1-like macrophages (ML4). The adaptive T cell response was localized predominantly in the mantle zone, contributing to the antimicrobial response against intracellular bacteria in. Also, surrounding the granuloma are dendritic cells (ML0) and CXCL2+ fibroblasts (FB2), which expressed genes that encode proteins with direct antimicrobial activity. Throughout the specimen were SFRP2+ fibroblasts (FB0) in the superficial dermis, various keratinocyte subtypes and endothelial cells, all expressing genes encoding antimicrobial proteins as well as chemokines known to have a direct antimicrobial response. The antimicrobial response in the granuloma and the surrounding microenvironment was largely regulated by IL1B and IFNG. Together, this suggests that the granuloma is a structured cellular ecosystem comprised of defined strata of distinct cell types that have the capacity to act to contain infection by an intracellular bacterium through the engagement of cells, both within and outside the granuloma, resulting in an integrated antimicrobial network.
Discussion
The organized granulomatous response allows the immune system to wall off and control intracellular bacteria that have initially evaded destruction. In leprosy and tuberculosis there is a spectrum, from spatially organized granulomas which can sterilize or contain the pathogen, as in T-lep and healed tuberculosis lesions, to disorganized granulomas in which the pathogen flourishes and produces tissue damage, as in L-lep and miliary or progressive tuberculosis. By scRNA-seq, in organized granulomas, we identified 66 key antimicrobial genes expressed by a variety of cell types: T cells, macrophages, keratinocytes and fibroblasts, that had been previously reported to contribute to host defense in leprosy and other mycobacterial infections, and/or encode proteins with direct antimicrobial activity. By integrating scRNA-seq with spatial-seq, it was possible to delineate the cellular and molecular structure of the organized granuloma in leprosy that contributes to protective immunity. At the other end of the spectrum, we found that TREM2 macrophages, characterized by lipid metabolism genes, were a prominent cell type in the progressive form of leprosy with disorganized granulomas.
At the core of the organized granuloma in the RR and T-lep lesions, is an aggregate of mature macrophages, which we found were a mixture of M1-like macrophages (ML4) and transitional macrophages (ML3). The pseudotime trajectory analysis of the leprosy scRNA-seq data suggest that TREM2 macrophages (ML2), predominantly found in L-lep lesions, differentiate to transitional macrophages (ML3), found in both RR and L-lep lesions, and further mature to M1-like macrophages (ML4), found predominantly in RR lesions. We identified IL1B and IFNG as key upstream regulators of this pseudotime trajectory as well activation of macrophages in granulomas to express genes known to contribute to antimicrobial responses.
The organized granuloma in T-lep patients was noted by Ridley and Jopling in their classification of the spectrum of leprosy to exhibit a mantle zone of lymphocytes around the macrophage core2. By spatial-seq analysis we detected dendritic cells (ML0) and Langerhans cells3 in the mantle zone, along with various T cell subtypes, including RR CTL and amCTL, which both expressed IFNG, also a key regulator of the antimicrobial gene response. Although amCTL were present in both RR and L-lep, there was higher expression of GZMB, PRF1 and GNLY in the RR cells; these genes encode proteins that act synergistically to kill intracellular mycobacteria4, 5, 6, 19, 20. These data suggest that measurement of IFN-γ production by CD8+ T cells, most often used to measure T cell function in vaccine trial recipients, will simply not serve as a useful measure of amCTL, which would need to be directly estimated by measurement of granulysin or its specific surface marker correlates19. We also found Th17 cells in RR lesions that expressed IL26, which encodes an antimicrobial protein shown to have direct activity against intracellular M. leprae15, 35. Therefore, the mantle zone of the granuloma contains T cells with the capacity to deliver antimicrobial effector molecules into infected cells as well as secrete cytokines that trigger a downstream antimicrobial response in macrophages.
Unexpectedly, our analysis of the major cell populations indicated that fibroblasts, keratinocytes and endothelial cells, cells not typically considered to contribute to the antimicrobial response, indeed expressed antimicrobial genes in RR granulomas. There were two distinct fibroblast subpopulations in RR: CXCL2+ fibroblasts, described as inflammatory30 and SFRP2+ fibroblasts, involved in the deposition of extracellular matrix proteins29. By spatial-seq, we identified SFRP2+ fibroblasts in the papillary dermis of RR and T-lep lesions, just beneath and proximal to the epidermis. In contrast, CXCL2+ fibroblasts were located at the periphery of the granuloma, at a greater distance from keratinocytes. We found that both fibroblast subpopulations express a number of chemokines that are also directly antimicrobial. We reason that the fibroblasts surrounding the granuloma perform a dual function in host defense: establishing a physical wall of extracellular matrix proteins, including vimentin, fibrillin, and collagens as well as by releasing antimicrobial proteins.
Several features of the subtypes that were overrepresented in L-lep lesions may contribute to disease pathogenesis in these patients. TREM2 macrophages were abundant and formed large aggregates in L-lep lesions. These macrophages have been identified in several diseases characterized by altered lipid metabolism including atherosclerosis, Alzheimer’s disease, non-alcoholic steatohepatitis and obesity21, 22, 23, 24, 25, 26, 27. The gene expression pattern in TREM2 macrophages suggests that these cells are programmed to transport and process lipids, and contain the foamy macrophages that characterize both atherosclerosis and L-lep. One myeloid subtype, Type I IFN MΦ, and one T cell subtype, L-lep CTL, both specific to L-lep lesions, are both characterized by a type I IFN gene program. Previously, we showed that IFN-β and its downstream targets were preferentially expressed in L-lep lesions and could inhibit IFN-γ induced antimicrobial activity in macrophages11. Plasma cells were numerous and formed small aggregates in L-lep lesions36, 37, with the local production of antibodies contributing to tissue injury in patients38.
It has long been thought that the nature of the immune responses in infection, cancer and autoimmune diseases is dictated by the principal cells of the immune system, lymphocytes and myeloid cells. However, a compelling aspect of our data on leprosy is that not only these immune cells, but also other cell types such as fibroblasts and keratinocytes, cells that are not thought of as the traditional immune cells, have the capability of responding to IL1B and IFNG to produce antimicrobial molecules in the granulomas. Our studies support a temporal and spatial model in which immunological activation of multiple cell types in and around the organized structure of the granuloma may be essential to controlling powerful intracellular pathogens. One could summarize our key findings simply by saying that it would appear to take a village to create effective antimicrobial granulomatous response.
Methods
IRB Statement
Informed written consent was obtained from human subjects under a protocol approved by the institutional review boards of the Oswaldo Cruz Foundation, University of Southern California and University of California Los Angeles. This study was conducted according to the Declaration of Helsinki Principles.
Processing of Human Skin
Skin biopsy specimens were obtained from patients with leprosy at University of Southern California and Oswald Cruz Foundation (Brazil). Patients were classified according to standard clinical and histologic criteria2 (Supplementary Table 1). Five patients with reversal reaction are designated here as RR1, RR2, RR3, RR4 and RR5. The other five are designated here as L-lep1, L-lep2, L-lep3, L-lep4 and L-lep5, of which four were classified as LL and one, L-lep2, as BL.
For each sample, a 4-mm punch biopsy was obtained following local anesthesia and was placed immediately into 10 mL of RPMI on ice. Initially, skin biopsies were incubated in 5mL of a 0.4% Dispase II solution (Roche Inc.) at 37°C for 1 hour with vigorous shaking. The dermis and epidermis were then carefully separated using forceps and transferred to separate tubes for additional processing. Epidermal samples were placed in 3mL of 0.25% Trypsin and 10U/mL DNAse for 30 minutes at 37°C. Trypsin was neutralized with 3mL of fetal calf serum (FCS), and the tissue was passed through a 70-micron nylon cell strainer which was washed with 5mL of RPMI. Epidermal cells were then pelleted at 300xg for 10 minutes and counted. Dermal samples were minced with a scalpel and incubated in a solution of 0.4% collagenase type II and 10 U/mL DNAse for 2 hours at 37°C with agitation. The cell suspension was passed through a 70-micron cell strainer and washed with 5mL of RPMI. Cells were pelleted at 300xg for 10 minutes, resuspended in 1mL of RPMI and counted. MACS enrichment for CD1a+ cells was performed for epidermis from three RR patients.
Single cell library preparation
Once a single cell suspension was obtained, we utilized Seq-Well, a massively-parallel scRNA-Seq platform for clinical samples, to capture the transcriptome of single cells. Full methods on implementation of Seq-Well are available in Gierahn et al.16 or on the Shalek Lab website (www.shaleklab.com). Specifically, 10–15,000 cells were loaded onto a functionalized-polydimethylsiloxane (PDMS) array preloaded with uniquely-barcoded mRNA capture beads (Chemgenes; MACOSKO-2011-10). After cells had settled into wells, the array was then sealed with a hydroxylated polycarbonate membrane with pore sizes of 10 nm, facilitating buffer exchange while confining biological molecules within each well. Following membrane-sealing, subsequent buffer exchange permits cell lysis, mRNA transcript hybridization to beads, and bead removal before proceeding with reverse transcription. The obtained bead-bound cDNA product then underwent Exonuclease I treatment (New England Biolabs; M0293M) to remove excess primer before proceeding with second strand synthesis.
Following Exonuclease I treatment, beads were washed once with 500 μL of a TE-SDS (0.5% SDS) solution, and twice in 500 μL of a TE-Tween (0.01% Tween) solution. After the second TE-TW wash the beads were solvated with 500 μL of 0.1 M NaOH and mixed for 5 minutes at room temperature using an end-over-end rotator with intermittent agitation to denature the mRNA-cDNA hybrid product on the bead. Following denaturing, the NaOH was removed and beads were washed once with 1 M TE, and then combined with a mastermix consisting of 40 μL 5x maxima RT buffer, 80 μL 30% PEG8000 solution, 20 μL 10mM dNTPs, 2 μL 1 mM dn-SMART oligo, 5 μL Klenow Exo-, and 53 μl of DI ultrapure water. Second-strand synthesis was carried out by incubating the beads for 1 hour at 37°C with end-over-end rotation and intermittent agitation. Following incubation, beads were sequentially washed twice with 0.5 mL of TE buffer with 0.01% Tween 20, and once with 0.5 mL of TE. Immediately prior to PCR amplification, beads were washed once with 0.5 mL of water and resuspended in 0.5 mL of water.
After second-strand synthesis, PCR amplification was performed using KAPA HiFi PCR Mix (Kapa Biosystems KK2602). Specifically, a 40 μL PCR Mastermix consisting of 25 μL of KAPA 5X Mastermix, 0.4 μL of 100 μM ISPCR oligo, and 14.6 μL of nuclease-free water was combined with 2,000 beads per reaction. For each sample, the total number of PCR reactions performed varied based on the number of beads recovered following second-strand synthesis. PCR amplification was performed using the following cycling conditions: an initial denaturation at 95°C for 3 minutes, then 4 cycles of 98°C for 20 seconds, 65°C for 45 seconds, and 72°C for 3 minutes, followed by 9–12 cycles of 98°C or 20 seconds, 67°C or 20 second, and 72°C for 3 minutes, and then a final extension of 72°C for 5 minutes. Following PCR amplification, WTA products were isolated through two rounds of SPRI purification using Ampure Spri beads (Beckman Coulter, Inc.) at both 0.6x and 0.8x volumetric ratio and quantified using a Qubit.
A total of 1 ng of WTA product at a concentration of 0.2 ng/μL was combined with 10 μL of Buffer TD and 5 μL of Buffer ATM and incubated at 55°C for 5 minutes. Following tagmentation, 5 μL of Buffer NT was added and incubated at room temperature for 5 minutes to neutralize the reaction. A total of 8 μL of nuclease-free water, 15 μL of buffer NPM, 1 μL of Custom P5 hybrid Oligo, and 1 μL of N700 Index oligo were combined and PCR amplification was performed using the following cycling conditions: an initial denaturation of 95°C for 30 seconds, then 12 cycles of 95°C for 10 seconds, 55°C for 30 seconds, and 72°C for 30 seconds, followed by a final extension of 72°C for 5 minutes. PCR products were isolated through two rounds of SPRI purification (0.6x and 0.8x volumetric ratios) and quantified using a Qubit. Library size distributions were determined using an Agilent Bioanalyzer D1000 High Sensitivity Screen tape.
Sequencing and alignment
Libraries were sequenced on an Illumina Nova-Seq (Illumina) as 50bp paired end reads and were converted from bcl files to fastq files using bcl2fastq. We use Nextera N700 indices to identify individual samples. The alignment was performed using Drop-seq pipelines (version 1.12)39. Briefly, the raw reads were aligned to the concatenated human (hg38) and M. leprae genome using STAR40. Each read was tagged with a 12bp barcode and 8bp unique molecular identifier (UMI). After alignment, the reads were grouped by the barcodes and deduplicated using the UMIs. The number of UMIs was then counted for each gene in each cell to generate the digital expression matrix (DEM).
Removal of ambient RNA contamination
Ambient RNA contamination was removed using SoupX (v0.3.1)41. Specifically, we examined the distribution of UMIs for each gene and selected the genes for which the distribution most closely approximated a uniform distribution. For each sample, we calculated an array-specific “soup” profile among barcodes below the UMI threshold. To calculate estimated per-cell contamination fractions, we manually selected genes observed to be bimodally expressed across cells, which suggest that these genes are predominantly expressed in a single cell type but are observed at low levels in other cell types for which endogenous expression would not be expected. For each array, we removed individual transcripts most likely to be contamination from each single cell based on the estimated contamination fraction. Specifically, individual transcripts were sequentially removed from each single cell transcriptome until the probability of subsequent transcripts being soup-derived was less than 0.5 to generate a background-corrected UMI matrix for each Seq-Well array.
Cell clustering and cell type annotation
After removing the ambient RNAs from each library, no further batch effects were detected in the analysis among the samples. Thus, digital expression matrices for human genes from all 10 samples were merged directly, and the R package Seurat17 was used to cluster the cells in the merged matrix. Cells with less than 300 genes detected or more than 50% mitochondrial gene expression were first filtered out as low-quality cells. Genes detected in less than five cells were removed as low-abundance genes. The gene counts for each cell were divided by the total gene counts for the cell and multiplied by the scale factor 10,000, then natural-log transformation was applied to the counts. The FindVariableFeatures function was used to select 2,000 variable genes with default parameters. The ScaleData function was used to scale and center the counts in the dataset. Principal component analysis (PCA) was performed on the variable genes, and 13 PCs (based on the elbow point of variance explained by each PC) were used for cell clustering (resolution = 0.5) and Uniform Manifold Approximation and Projection (UMAP) dimensional reduction. The cluster markers were found using the FindAllMarkers function, and cell types were manually annotated based on the cluster markers. To generate the heatmap showing the cell type markers, the top 100 cells with the highest number of UMI detected were plotted for each cell type. The total number of M. leprae UMIs were calculated for each cell and plotted for each sample.
Cell type sub-clustering
We performed sub-clustering on endothelial cells, fibroblasts, keratinocytes, myeloid cells and T cells. The same functions described above were used to obtain the sub-clusters. To choose the number of PCs, the rank of PCs based on the percentage of variance explained was plotted, and the elbow point was chosen as the number of PCs to use in cell clustering (resolution = 0.6) and UMAP dimension reduction. Clusters that were defined exclusively by mitochondrial gene expression, indicating low quality, were removed from further analysis. To generate the heatmap with marker genes for each sub-cluster, the top 100 sub-cluster marker genes with the highest average log fold change were plotted, and five representative genes were labelled.
Interferon signature enrichment analysis
Supervised analyses were performed to identify Type I and Type II IFN regulated genes as described previously11, 42, 43, 44. Differentially expressed genes in TC1 (RR CTL) and TC2 (L-lep CTL) were identified using a Wilcoxon rank sum test with adjusted p value cutoff at 0.05. A list of genes specifically induced by only IFN-α/β or IFN-γ was derived from the gene expression profile data of IFN-treated human PBMC45. 148 IFN- α/β specific genes and 33 IFN-γ specific genes were identified, which were overlapped with TC1 and TC2 specific genes to determine the differential expression of IFN-regulated genes. Hypergeometric test was used to determine the enrichment level; a p value smaller than 0.05 was considered to be significantly enriched.
Pseudotime trajectory construction on macrophage and keratinocyte subtypes
Pseudo-time trajectories for macrophage and keratinocyte sub-clusters were constructed using the R package Monocle32. The raw counts for cells in the intended sub-clusters were extracted and normalized by the estimateSizeFactors and estimateDispersions functions with the default parameters. Genes with average expression larger than 0.5 and detected in more than 10 cells were retained for further analysis. Variable genes were determined by the differentialGeneTest function with a model against the sub-cluster identities. The top 500 variable genes with the lowest adjusted p value were used to order the cells. The orders were determined by the orderCells function, and the trajectory was constructed by the reduceDimension function with default parameters. Differential expression analysis was carried out using the differentialGeneTest function with a model against the pseudotime, and genes with an adjusted p value smaller than 0.05 were clustered into 6 patterns and plotted in the heatmap. Ingenuity Pathway Analysis was used to determine the upstream regulators for the genes in each expression pattern. A module score was calculated for each upstream regulator on gene targets from all six patterns. The module scores were calculated using the Seurat function AddModuleScore with default parameters, which measure the average expression levels of a set of genes, subtracted by the average expression of randomly selected control genes. Pearson correlation was then performed between the upstream regulator module scores and the pseudotimes.
Antimicrobial gene analysis
A list of 1,404 genes were curated by searching for genes with “antimicrobial” as a keyword in GeneCards (https://www.genecards.org/). To study the difference of antimicrobial response in L-lep and RR, the cell types were split into L-lep and RR groups. To measure the relative abundance of that encode proteins involved in antimicrobial responses (“antimicrobial genes”), the total expression of each antimicrobial gene was calculated for each L-lep and RR cell type. The sum of antimicrobial gene expression across the total number of L-lep cells was computed, as was the sum of antimicrobial gene expression across the total number of RR cells. These sums were then normalized by the total number of L-lep or RR cells, respectively. The z scores of these sums were calculated across all cell types for each antimicrobial gene. A cutoff of z score > 3 was applied to obtain the specific antimicrobial genes for each cell type. A list of 1,124 antimicrobial genes was obtained as specific to at least one RR cell type. Ingenuity Pathway Analysis was used to perform enrichment analysis and determine the upstream regulators of the 1,124 antimicrobial genes. To generate the circos plots, a list of direct antimicrobial genes was obtained from The Antimicrobial Peptide Database33, and those regulated by IL1B or IFNG were included.
Cell type composition analysis
To calculate the sample composition based on cell type, the number of cells for each cell type from each sample were counted. The counts were then divided by the total number of cells for each sample and scaled to 100 percent for each cell type. The same procedures were applied to calculate the sample composition for each subtype in endothelial cells, fibroblasts, keratinocytes, myeloid cells and T cells. The cell type (including the subtype) with more than 70% L-lep (or RR) composition was named L-lep (or RR) specific.
Spatial sequencing library preparation
Skin samples were frozen in OCT medium and stored at −80°C until sectioning. Optimization of tissue permeabilization was performed on 20-μm-thick sections using Visium Spatial Tissue Optimization Reagents Kit (10X Genomics), which established an optimal permeabilization time to be 6 minutes. Samples were mounted onto a Gene Expression slide (10X Genomics) and stored at −80°C until H & E staining. To prepare for staining, the slide was placed on a thermocycler adaptor set at 37°C for 5 min and then immediately fixed in ice-cold methanol for 20 min. Methanol was displaced with isopropanol, and the samples were air dried for 10 min before sequential staining with Mayer’s Hematoxylin Solution (Millipore Sigma), Bluing Buffer (Dako, Agilent), and 1:10 dilution of Eosin Y-solution (Millipore Sigma) in 0.45M Tris-Acetic Acid buffer, pH6.0, with thorough washing in ultrapure water between each step. Stained slides were scanned under a microscope (Keyence). Tissue permeabilization was performed to release the poly-A mRNA for capture by the poly(dT) primers that are precoated on the slide and include an Illumina TruSeq Read, spatial barcode, and unique molecular identifier (UMI). Visium Spatial Gene Expression Reagent Kit (10X Genomics) was used for reverse transcription to produce spatially barcoded full-length cDNA and for second strand synthesis followed by denaturation to allow a transfer of the cDNA from the slide into a tube for amplification and library construction. Visium Spatial Single Cell 3ʹ Gene Expression libraries consisting of Illumina paired-end sequences flanked with P5/P7 were constructed after enzymatic fragmentation, size selection, end repair, A-tailing, adaptor ligation, and PCR. Dual Index Kit TT Set A (10X Genomics) was used to add unique i7 and i5 sample indexes and generate TruSeq Read 1 for sequencing the spatial barcode and UMI and TruSeq Read 2 for sequencing the cDNA insert, respectively.
Spatial sequencing analysis
After sequencing, the reads were aligned to the human genome (hg38), and the expression matrix was extracted using the spaceranger pipeline. Seurat was then used to analyze the expression matrix. Specifically, the SCTransform function was used to scale the data and find variable genes with default parameters. PCA was applied for dimensional reduction. The FindTransferAnchors function was used to Find a set of anchors between the spatial-seq data and scRNA-seq data, which were then transferred from the scRNA-seq to the spatial-seq data using the TransferData function. These two functions construct a weights matrix that defines the association between each query cell and each anchor. These weights sum to 1 and were used as the percentage of the cell type in the spots. The RR specific cell type / subtypes from the scRNA-seq data were used to annotate the RR and T-lep spatial-seq samples. The L-lep specific cell type / subtypes from the scRNA-seq data were used to annotate the L-lep spatial-seq samples. The predicted cell type composition for each spot was then used to cluster the spots by the k-means algorithm. The clusters were annotated based on the average cell type prediction score across all the spots in the cluster.
Spatial distance calculation
To measure the distance from fibroblast subtypes to the epidermis, the FB0, FB2 and epidermis spots were first defined. Epidermis spots were defined based on the expression of KRT1 and KRT10. Spots with higher expression than the 90% quantile of the sum of these two genes were considered epidermis spots. FB0 and FB2 spots were defined using the subtype prediction scores. Spots that had FB0 prediction scores higher than the 90% quantile were considered FB0 spots, and spots that had FB2 prediction scores higher than the 90% quantile were considered FB2 spots. The locations of the spots were extracted from the “tissue_positions_list.csv” file from the spaceranger output. The Euclidean distance from the FB0 and FB2 spots to all the epidermis spots were calculated, and the shortest distance was used as the distance from the spot to the epidermis. All three RR samples and the T-lep samples were combined, and the Wilcoxon rank sum test was performed between the FB0-epidermis and FB2-epidermis distances.
Spatial nearest neighbor measurement
For each spot, the closed six spots surrounding it were considered nearest neighbors. The number of neighboring spots for each pair of cell types were counted in each of the spatial-seq samples to generate a nearest-neighbor matrix. Each row of the matrix was divided by the row sum. The RR average was calculated using the RR and T-lep samples, and the L-lep average was calculated using the two L-lep samples.
Immunohistochemistry
Frozen tissue sections from three RR and three L-lep specimens were blocked with normal horse serum before incubation with DEFB1 (clone M11–14b-D10, Abcam), CXCL14 (clone EPR22807–28, Abcam) and TAC1 (clone NC1/34HL, Santa Cruz) monoclonal antibodies, and respective isotype controls (Sigma-Aldrich) for 60 minutes, followed by incubation with biotinylated secondary antibodies (Vector Laboratories) for 30 minutes. Slides were counterstained with hematoxylin and mounted VectaMount (Vector Laboratories) and were visualized using the ABC Elite system (Vector Laboratories). Skin sections were examined using a Leica microscope (Leica 2500)46.
Antimicrobial activity assay
Live M. leprae was provided by Dr. Ramanuj Lahiri of the National Hansen’s Disease Program, Health Resources Service Administration, Baton Rouge, Louisiana. Peripheral blood mononuclear cells (PBMCs) from healthy donors were isolated from peripheral blood using a Ficoll-hypaque (GE Healthcare) density gradient. Monocyte-derived macrophages (MDMs) were generated15. To evaluate antimicrobial activity, 5×10⁵ MDMs were pretreated with 1μM of recombinant human CXCL14 (R&D Systems), DEFB1 (LSBio) and TAC1 (Substance P) (R&D Systems) for 30 minutes and infected with live M. leprae at a multiplicity of infection (MOI) of 5 at 35 °C with 4% CO2. Rifampicin (10μg/ml) was used as a positive control. After 4 days TRIzol reagent (Invitrogen, Life Technologies, Thermo Fisher Scientific) was added to the cells and RNA and DNA were extracted according to the manufacturer’s instructions. M. leprae viability was determined by qPCR and quantified15, 47.
Code availability
Codes used to analyze the data in this study are available in GitHub page: https://github.com/mafeiyang/leprosy_amg_network
Statistics and Reproducibility
Statistical differences were evaluated using two-sided T tests or Wilcoxon rank sum test. The Benjamini-Hochberg procedure was used to correct for false discovery rate in multiple comparisons. For scRNA-seq, the statistics were conducted between RR samples and L-lep samples. For spatial-seq, the statistics were conducted between the RR/T-lep and L-lep samples. scRNA-seq or spatial-seq samples in the same disease category can be considered biological replicates. No technical replication was performed. P value <0.05 or adjusted p value <0.05 (in multiple comparisons) was considered significant. No statistical method was used to predetermine sample size. No samples were excluded from the analyses. The experiments were not randomized.
Extended Data
Extended Data Fig. 1. IFN-α/β and IFN-γ signature on CTL subtypes and co-expression of IFNG, GZMB, PRF1 and GNLY.
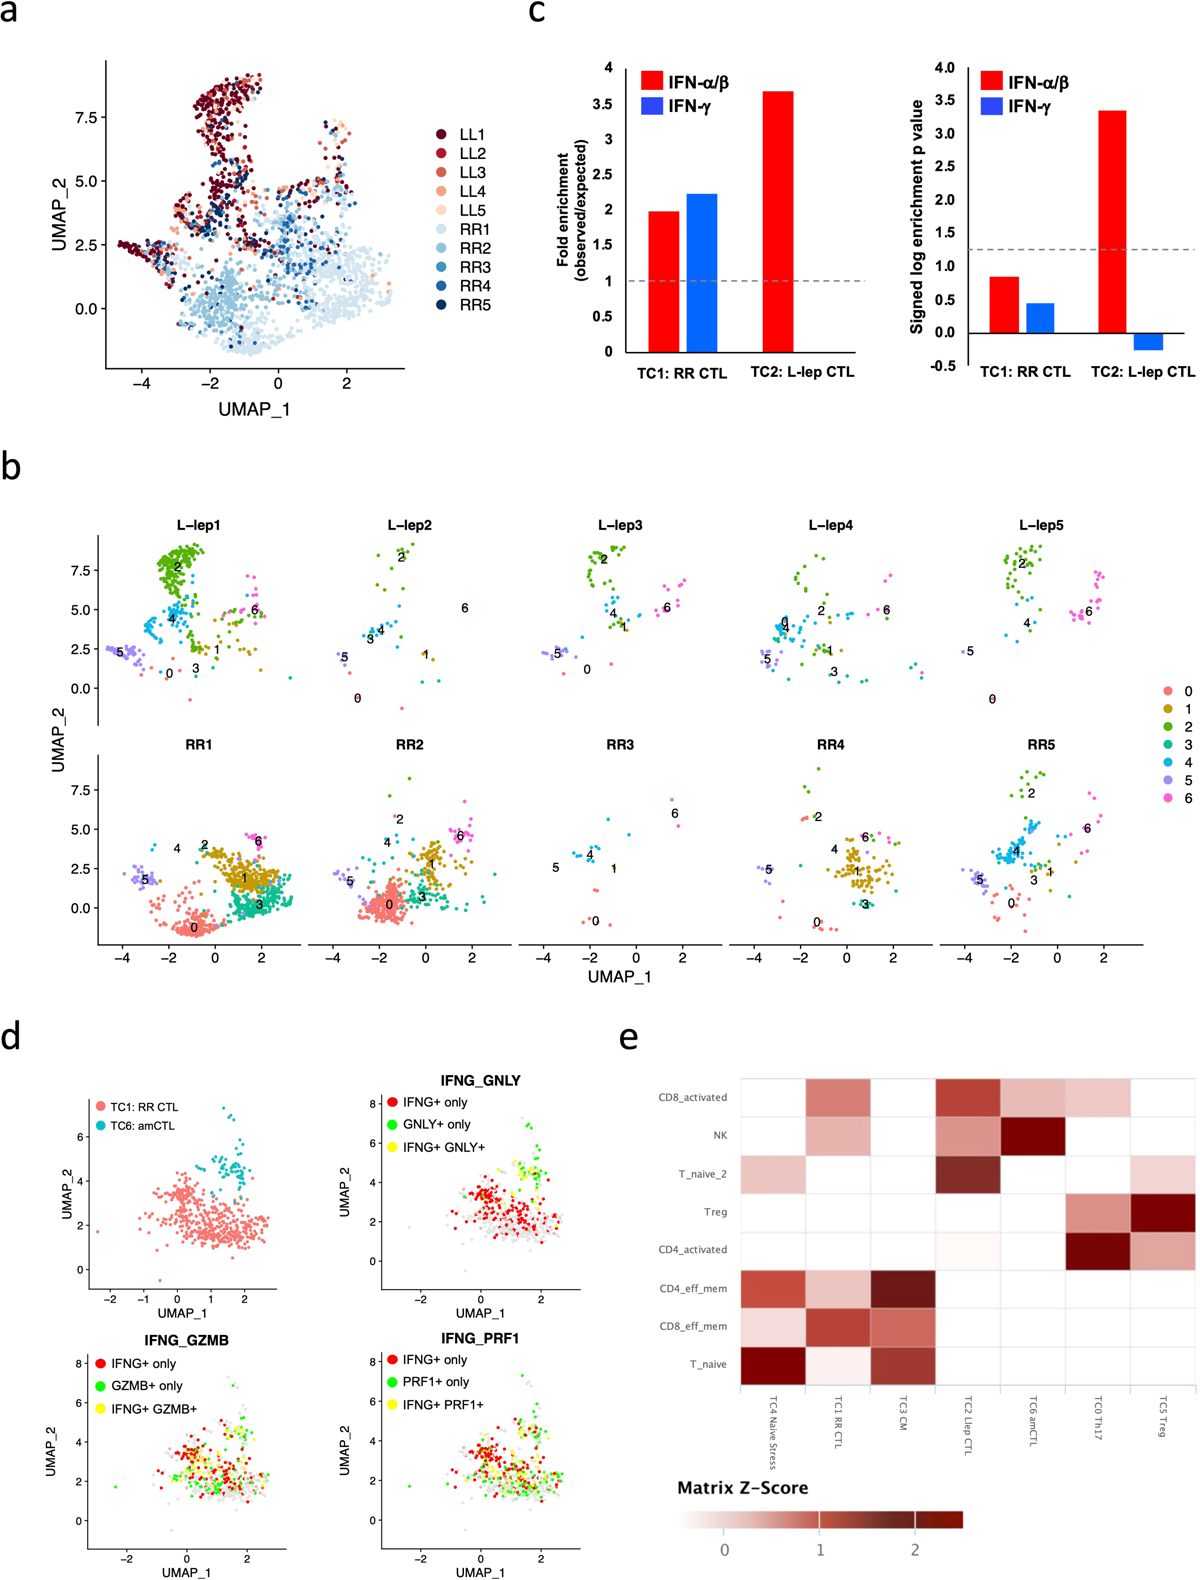
a. UMAP plot for 2,290 T cells colored by patient identities.
b. Individual UMAP for the T cells from each patient.
c. Enrichment analysis on differentially expressed genes (adjusted p value < 0.05) between TC1 (RR CTL) and TC2 (L-lep CTL) using IFN-α/β and IFN-γ specific genes identified in human PBMC. Dotted lines indicate (left) no enrichment or (right) the hypergeometric test p value of 0.05 (log p value = 1.3).
d. UMAP plots showing co-expression of IFNG, GMZB, PRF1 and GNLY in RR CTL and amCTL.
e. T cell subtype comparisons between scRNA-seq datasets from human leprosy skin biopsy specimens and from lung samples of a non-human primate model of tuberculosis. The color scale represents the z scores of the gene expression signature scores.
Extended Data Fig. 2. Dendritic cell subpopulations and comparison of macrophage sub-clusters.
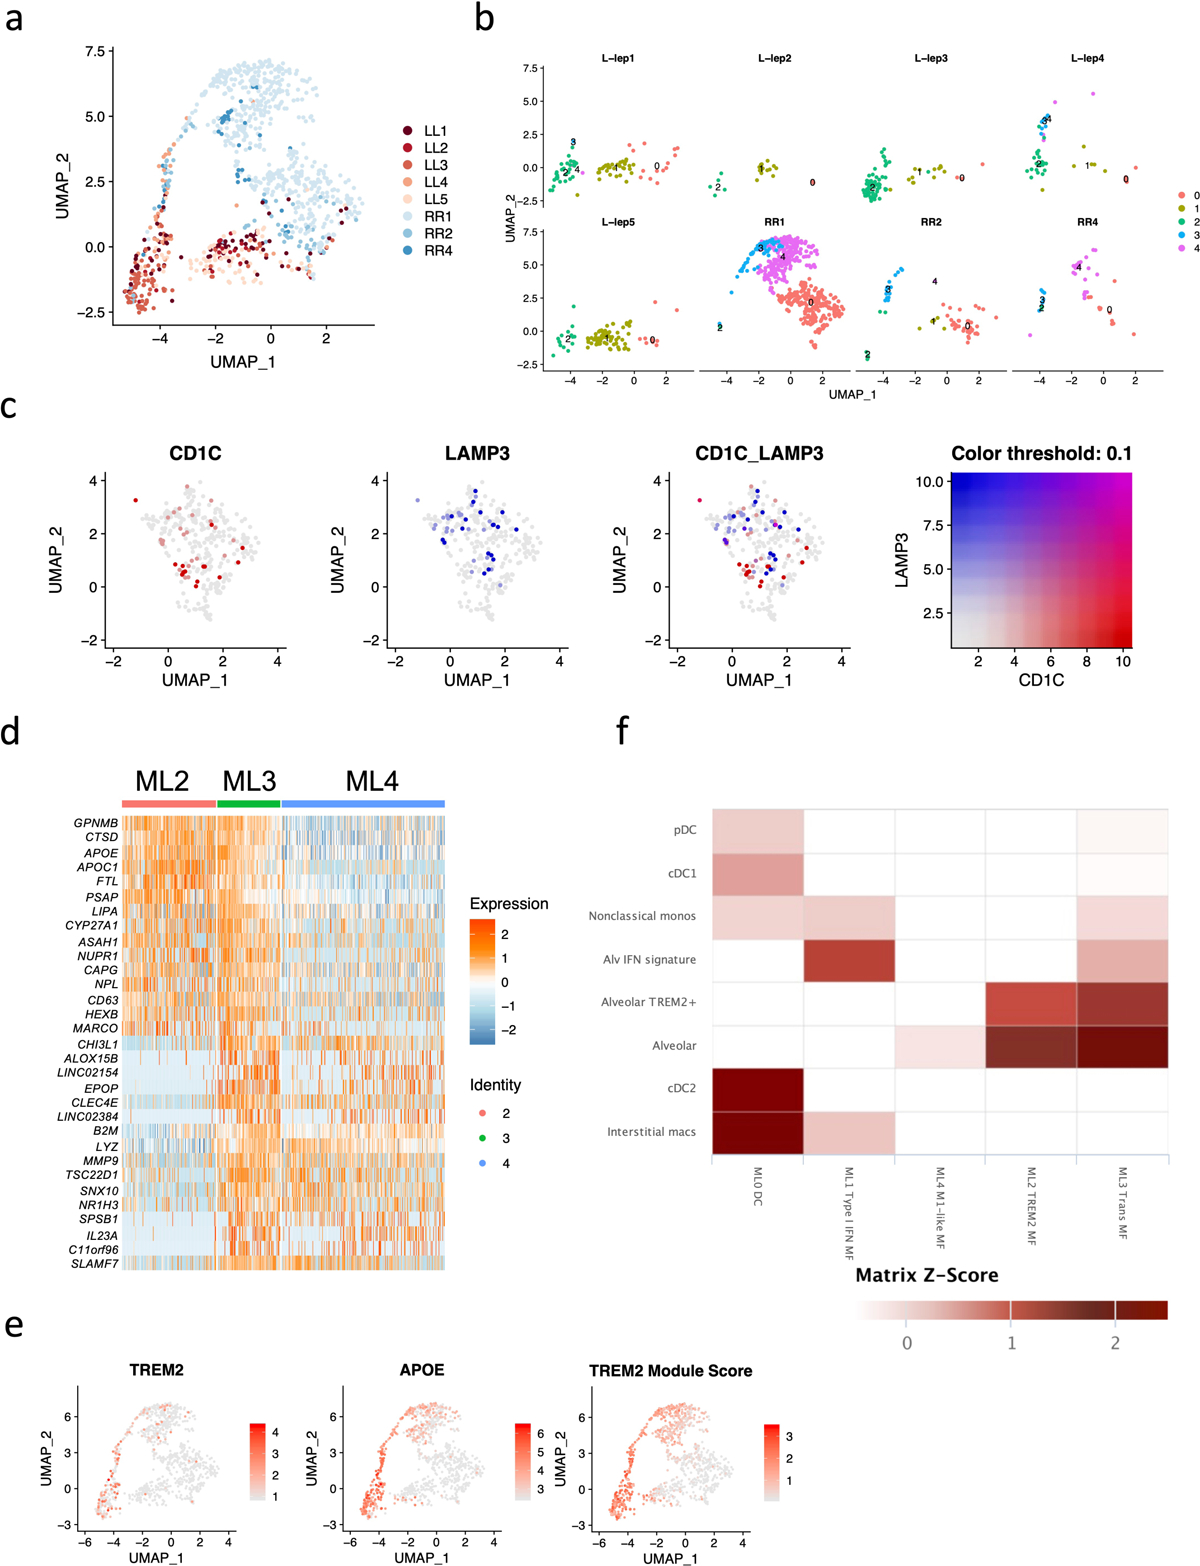
a. UMAP plot for 991 myeloid cells colored by patient identities.
b. Individual UMAP for the myeloid cells from each patient.
c. UMAP plots showing CD1C and LAMP3 expression in ML0. Only few co-expression events were observed, indicating distinct dendritic cell subpopulations.
d. Heatmap showing top differentially expressed genes between ML2 and ML4. ML3 expressed both ML2 and ML4 specific genes.
e. UMAP plots showing TREM2 expression, APOE expression and TREM2 module score. The color scale represents the expression level of the genes or the level of the module score.
f. Myeloid cell subtype comparisons between scRNA-seq data sets from human leprosy skin biopsy specimens and from lung samples of a non-human primate model of tuberculosis. The color scale represents the z scores of the gene expression signature scores.
Extended Data Fig. 3. Identification of keratinocyte subtypes.
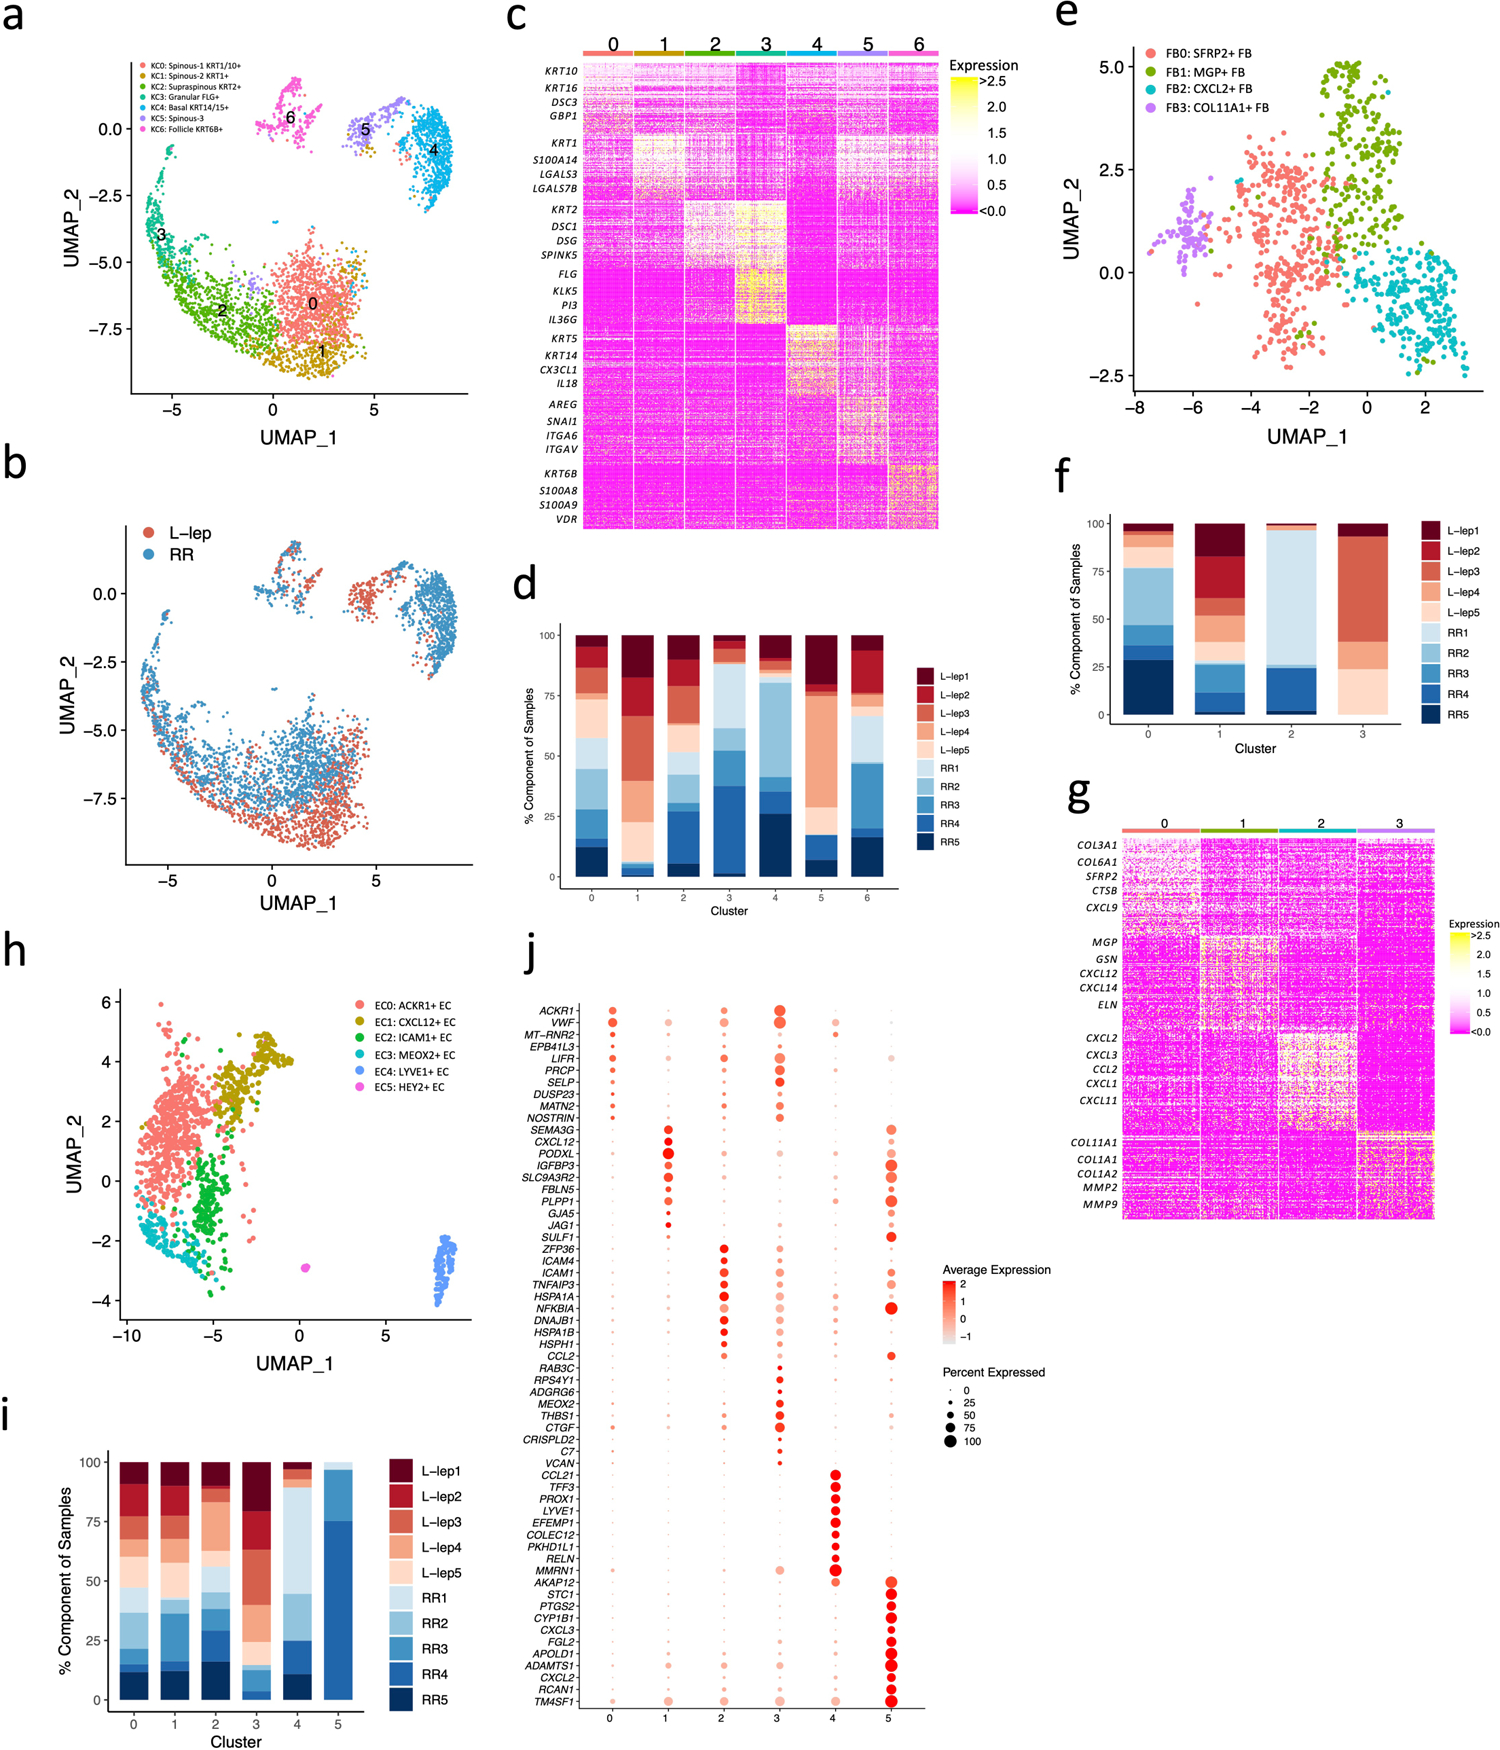
a. UMAP plot for 3,748 keratinocytes colored by subtypes.
b. UMAP plot for 3,748 keratinocytes colored by clinical forms.
c. Heatmap showing marker genes for each keratinocyte subtype. The representative genes are labelled.
d. Abundance composition across all samples for each keratinocyte subtype.
e. UMAP plot for 1,010 fibroblasts colored by subtypes.
f. Abundance composition across all samples for each fibroblast subtype.
g. Heatmap showing marker genes for each fibroblast subtype. The representative genes are labelled.
h. UMAP plot for 1,219 endothelial cells colored by subtypes.
i. Abundance composition across all samples for each endothelial cell subtype.
j. Dot plot showing 10 marker genes for each endothelial subtype. The color scale represents the scaled expression of the gene. The size of the dot represents the percentage of cells expressing the gene.
Extended Data Fig. 4. Pseudotime construction in macrophages and keratinocytes.
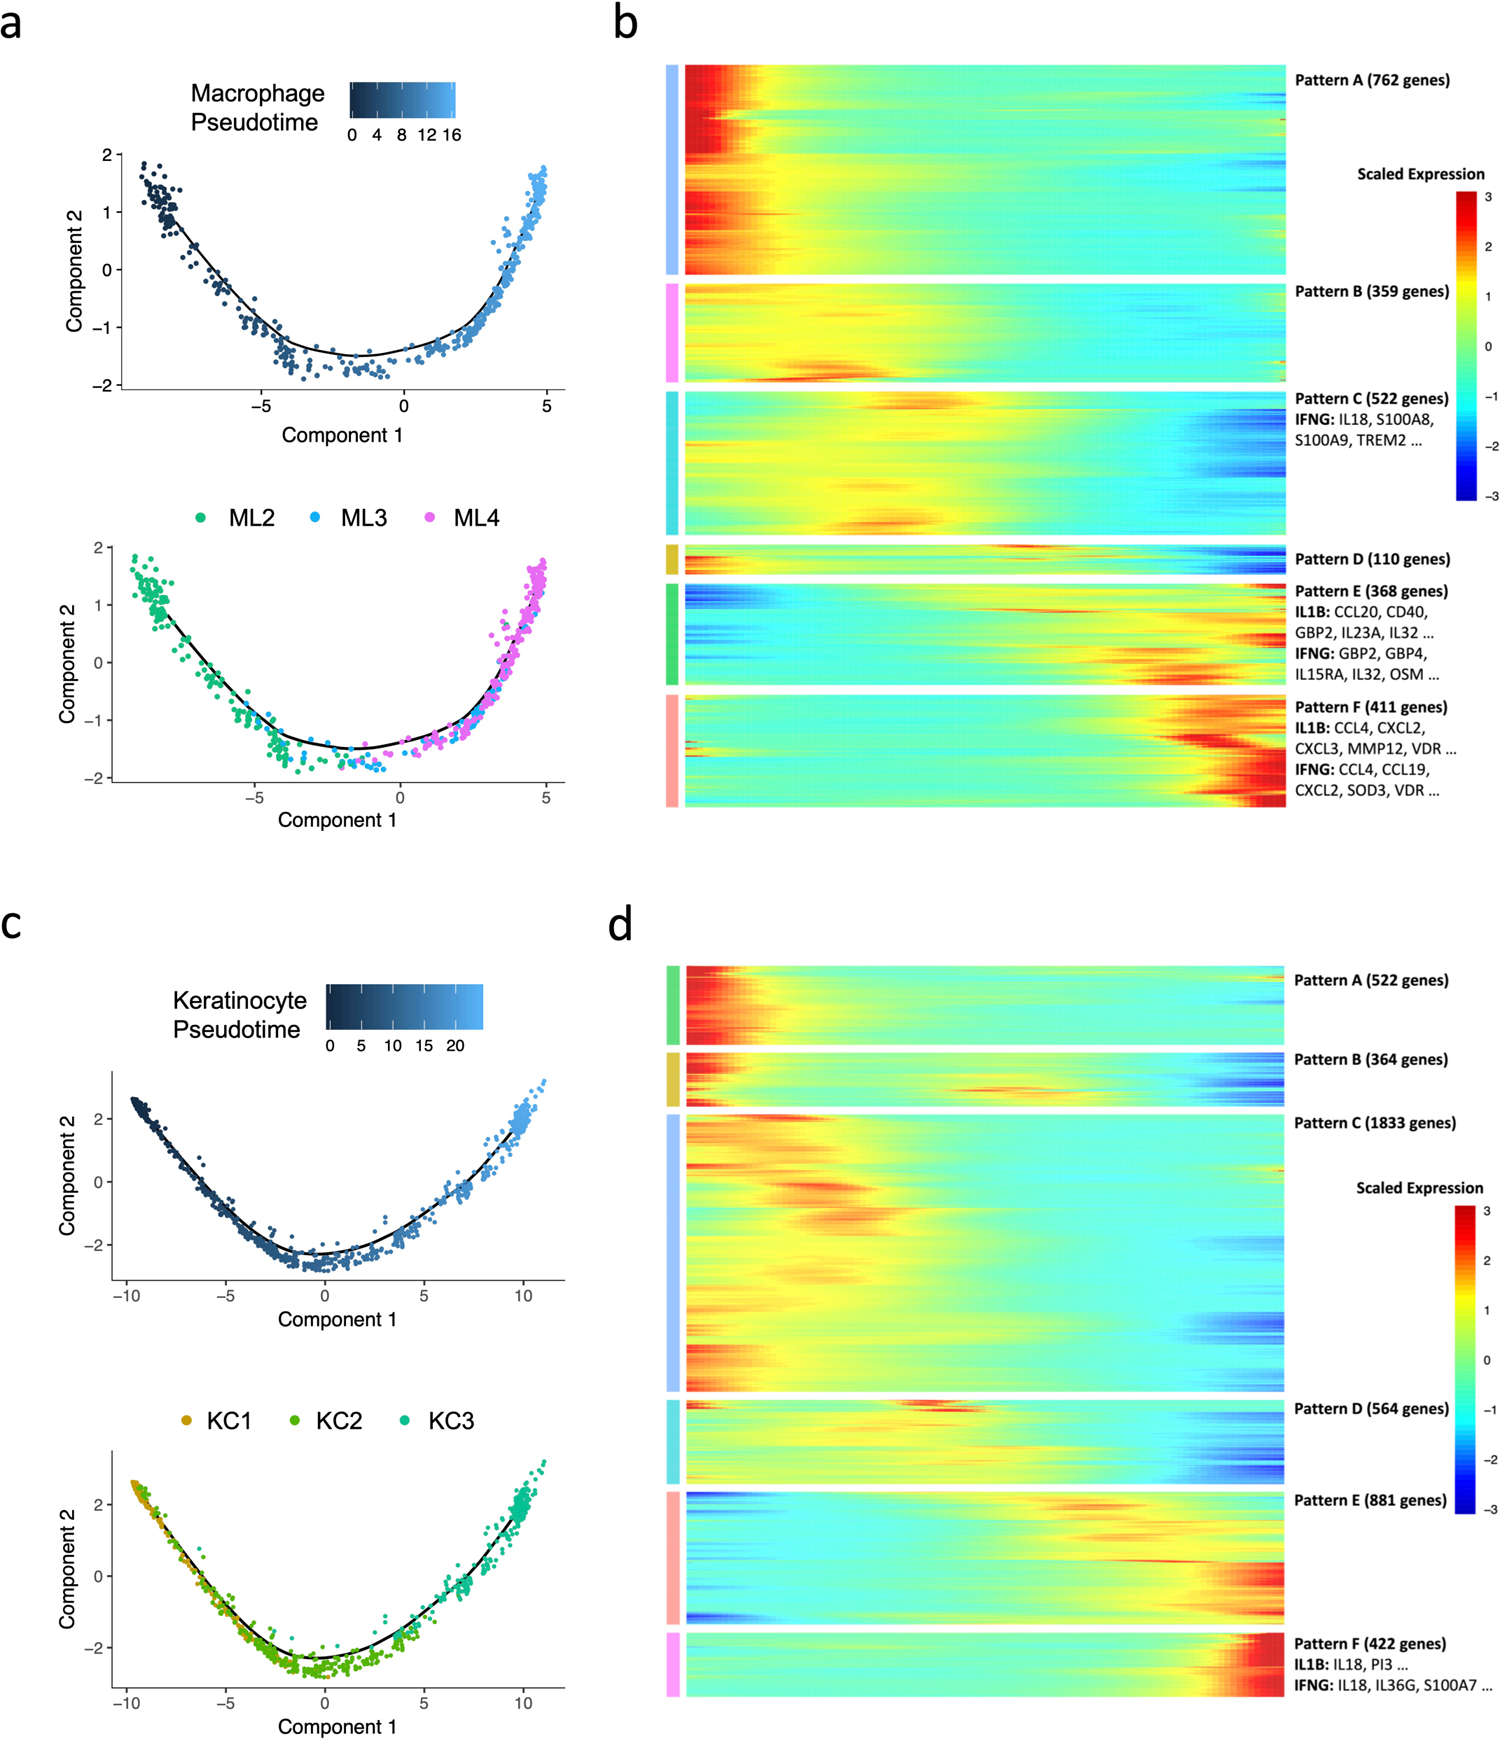
a. Pseudo-temporal trajectory colored by pseudotime (top) and by sub-cluster identity (bottom) for macrophage sub-cluster 2, 3 and 4.
b. Heatmap showing six expression patterns along the macrophage pseudotime trajectory as depicted on the x axis. Representative genes regulated by IL1B and IFNG are labelled.
c. Pseudo-temporal trajectory colored by pseudotime (top) and by sub-cluster identity (bottom) for keratinocyte sub-cluster 1, 2 and 3.
d. Heatmap showing six expression patterns along the keratinocyte pseudotime trajectory as depicted on the x axis. Representative genes regulated by IL1B and IFNG are labelled.
Extended Data Fig. 5. Representative antimicrobial genes expressed by the major cell types.
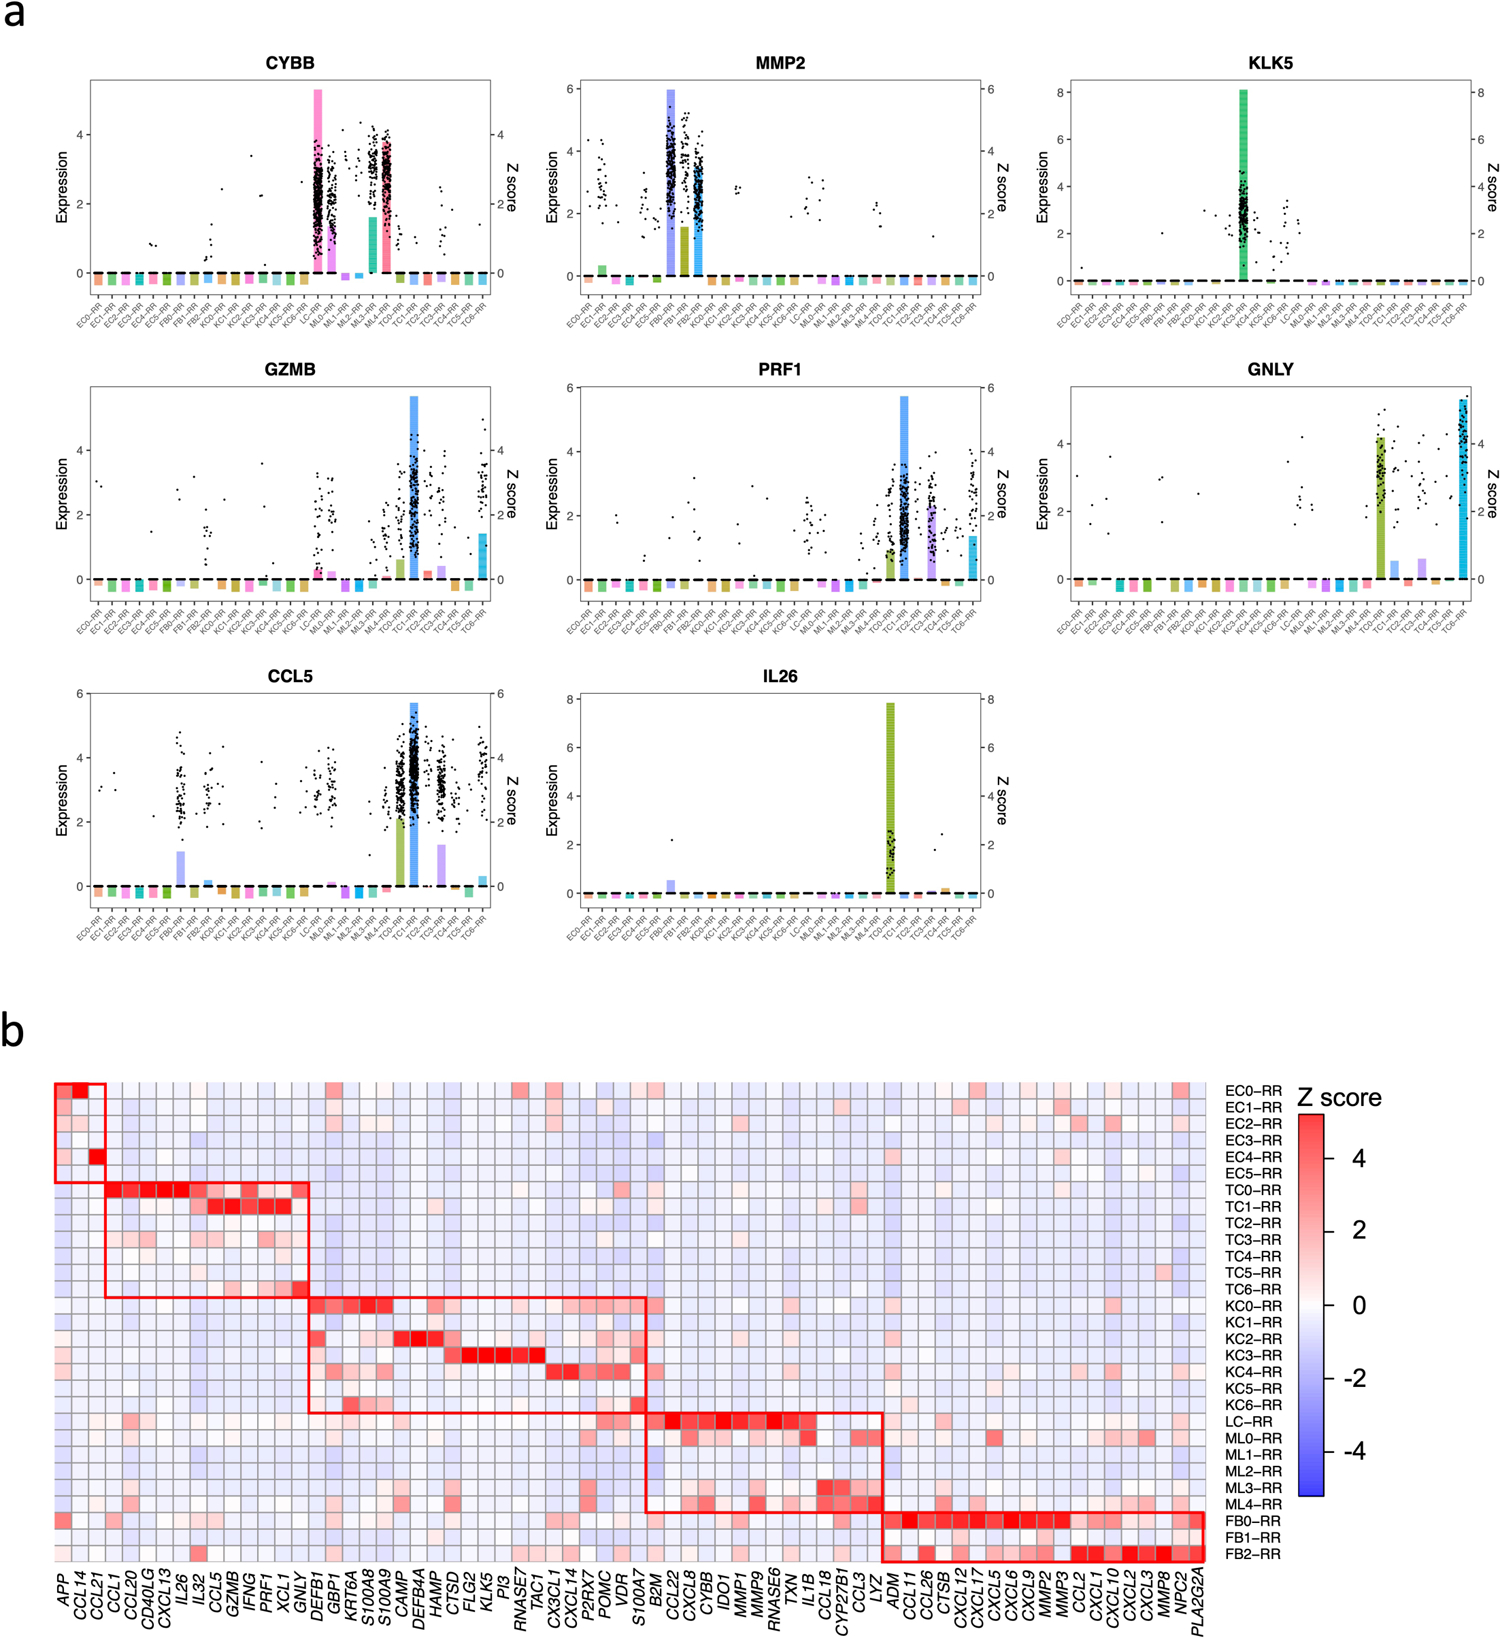
a. Bar plot showing the expression of the antimicrobial genes in each RR subtype. The height of the bar represents the z score of the gene in each subtype. The dots represent the gene’s expression level in individual cells.
b. Heat map showing z scores of antimicrobial genes in RR cell types. The red boxes indicate distinct sets of antimicrobial genes highly expressed in endothelial cells, fibroblasts, keratinocytes, myeloid cells and T cells.
Extended Data Fig. 6. Cell type composition and clustering of the RR6 and T-lep1 spatial-seq sample.
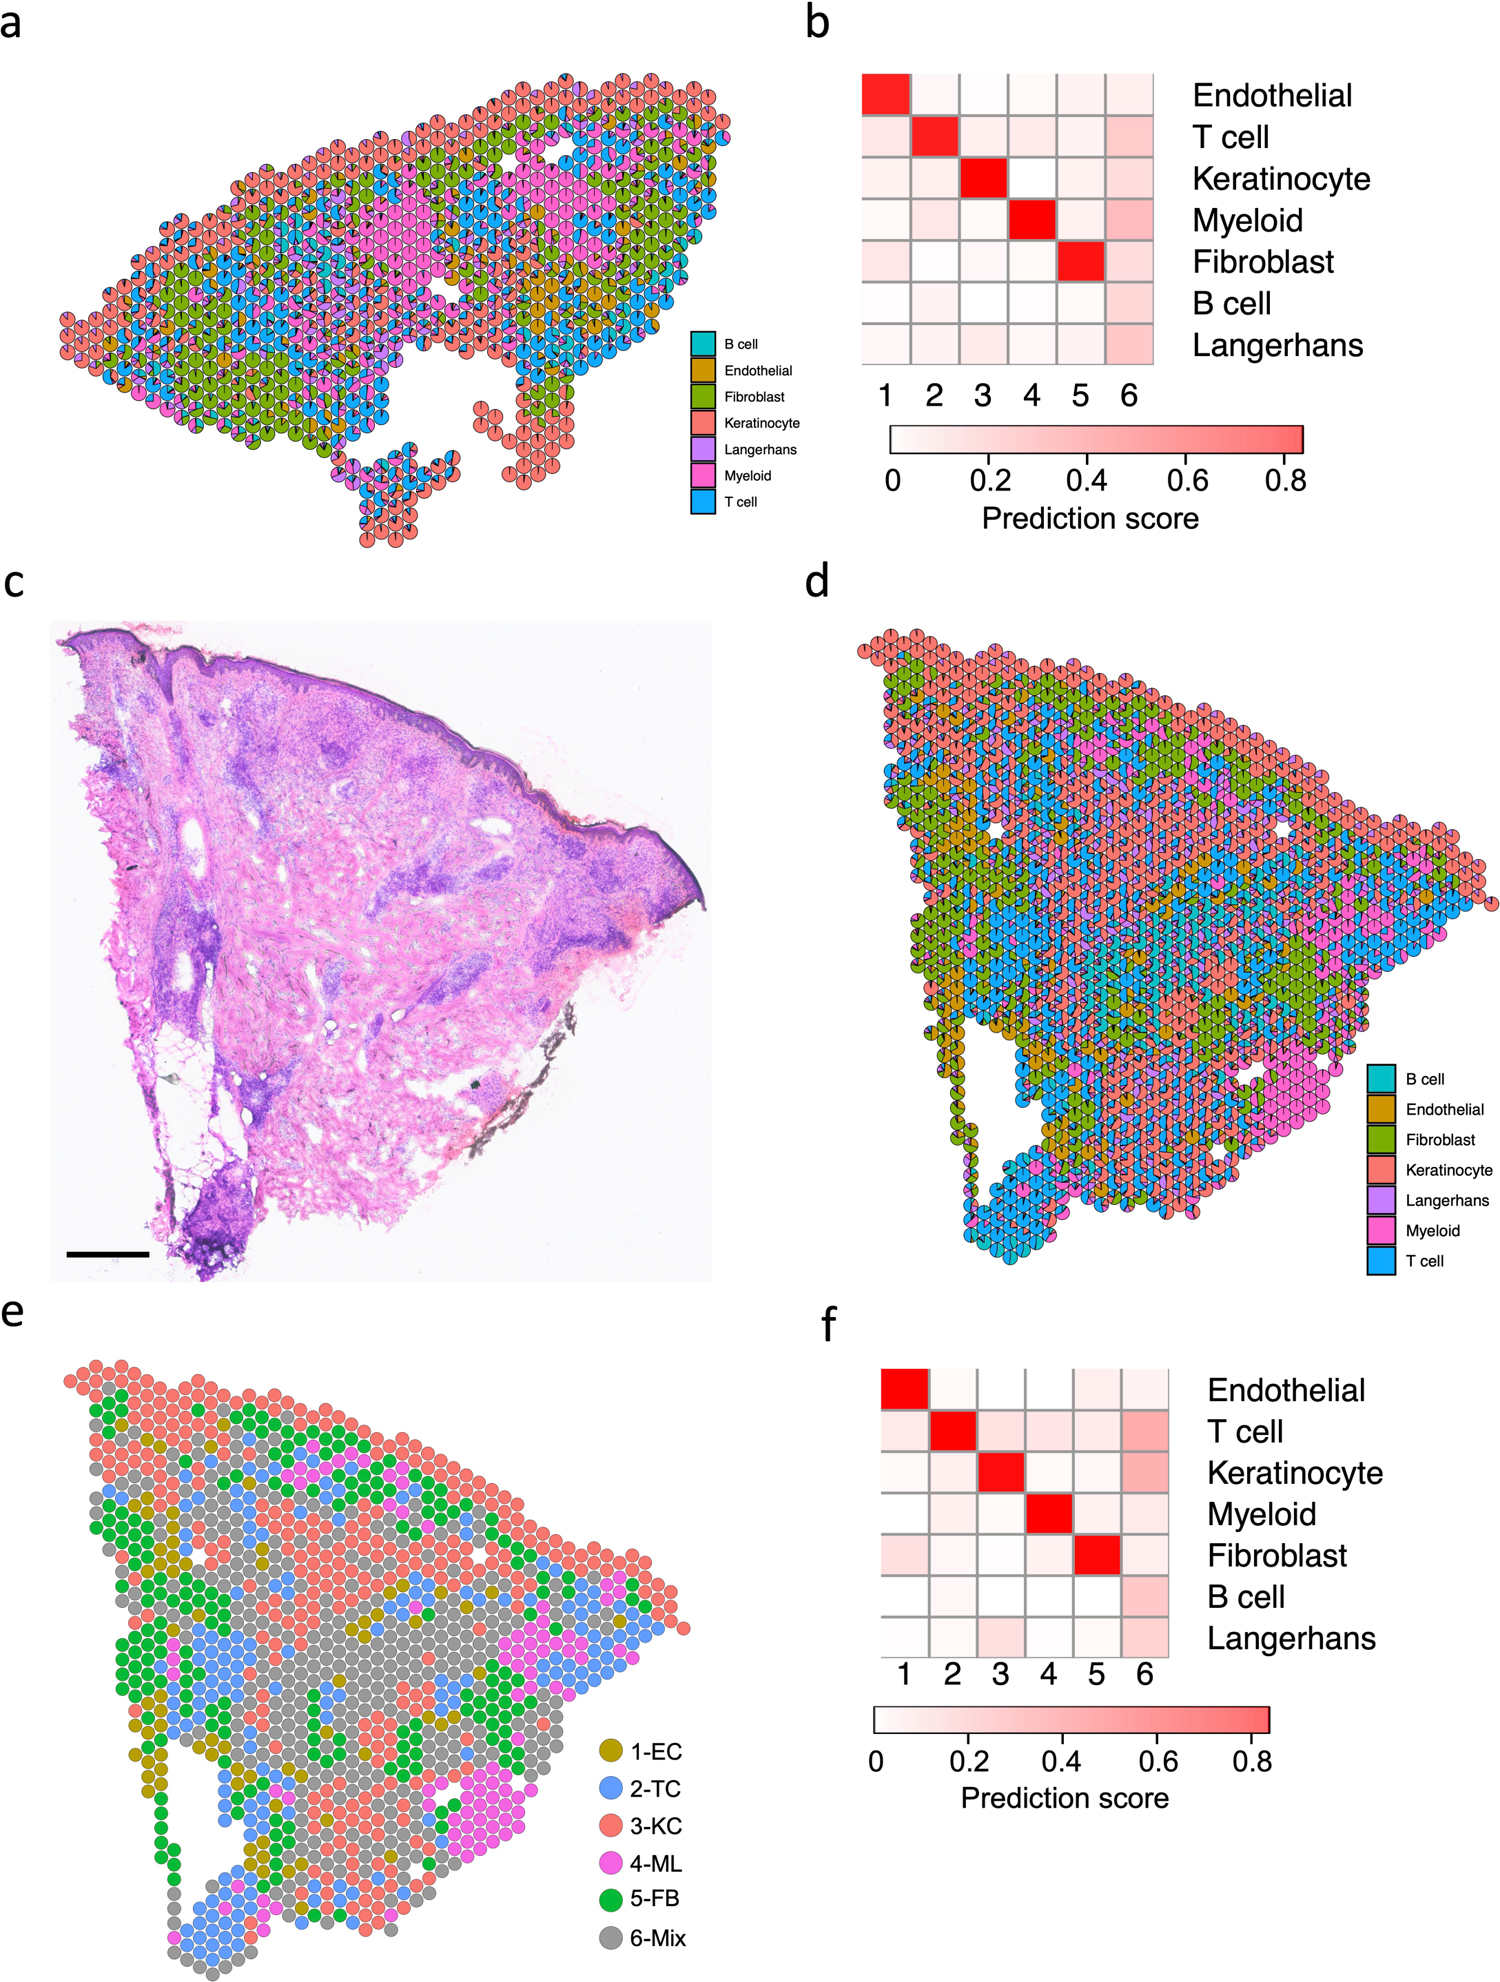
a. Scatter pie plot showing the cell type composition of the RR6 spatial-seq sample. Each spot is represented as a pie chart showing the relative proportion of the cell types.
b. Heatmap showing the average cell type prediction score for each cluster of the RR6 spatial-seq sample.
c. H & E staining of the T-lep1 biopsy used for spatial sequencing. Scale bar: 0.5 mm.
d. Scatter pie plot showing the cell type composition of the T-lep1 spatial-seq sample. Each spot is represented as a pie chart showing the relative proportion of the cell types.
e. Spatial plot for 1,154 spots colored by clusters, the coordinates of the spot correspond to the location in the T-lep1 sample tissue.
f. Heatmap showing the average cell type prediction score for each cluster of the T-lep1 spatial-seq sample.
Extended Data Fig. 7. Spatial sequencing for two additional RR samples and subtypes location for the RR6 sample.
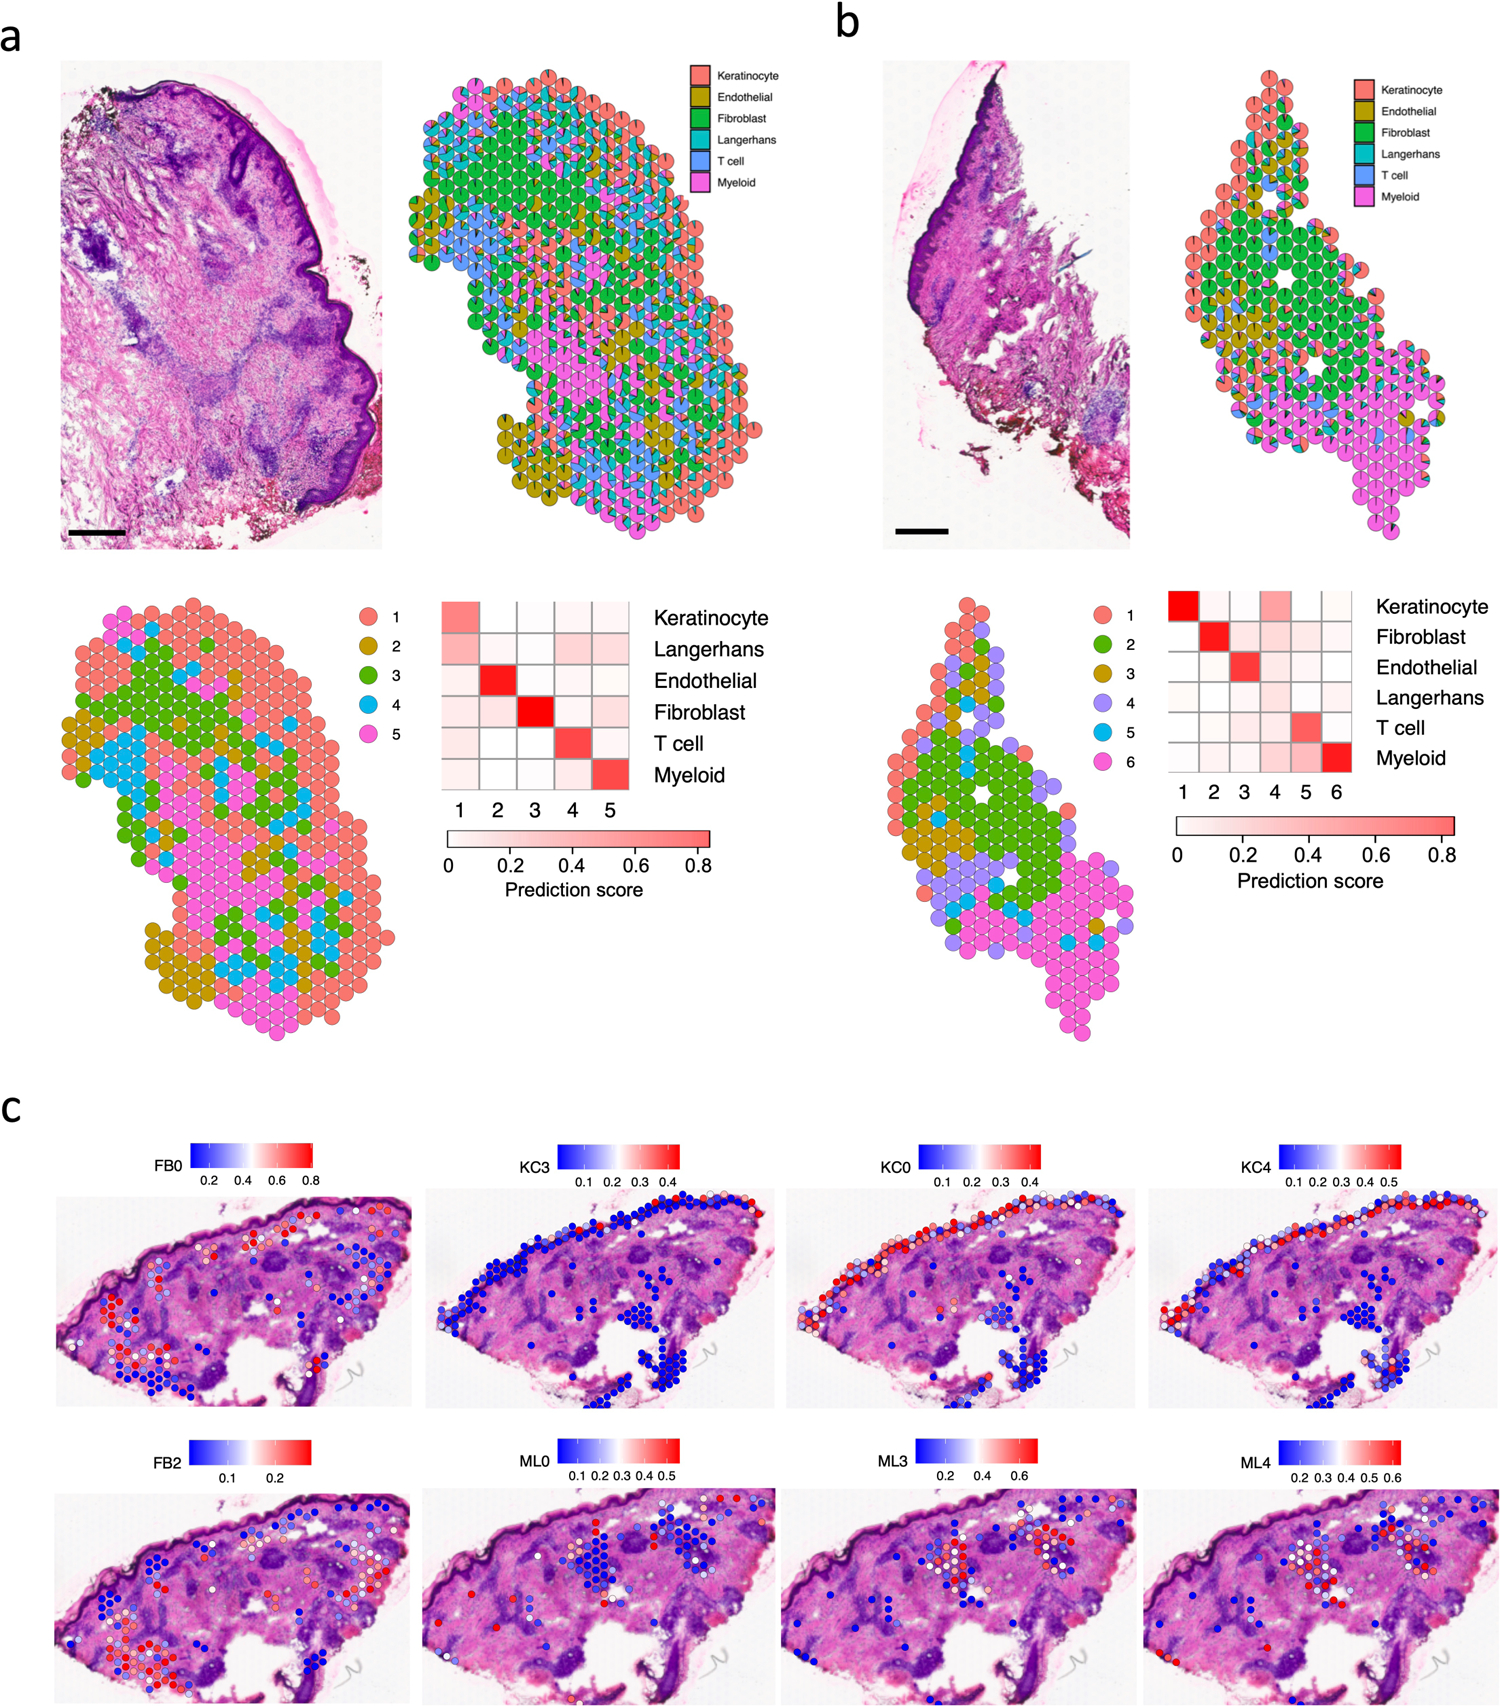
a. H & E staining of the RR7 biopsy used for spatial sequencing (top left), scale bar: 0.5 mm. Scatter pie plot showing the cell type composition of the RR7 spatial-seq sample. Each spot is represented as a pie chart showing the relative proportion of the cell types (top right). Spatial plot for 418 spots colored by clusters, the coordinates of the spot correspond to the location in the tissue (bottom left). Heatmap showing the average cell type prediction score for each cluster (bottom right).
b. H & E staining of the RR8 biopsy used for spatial sequencing (top left), scale bar: 0.5 mm. Scatter pie plot showing the cell type composition of the RR8 spatial-seq sample. Each spot is represented as a pie chart showing the relative proportion of the cell types (top right). Spatial plot for 214 spots colored by clusters, the coordinates of the spot correspond to the location in the tissue (bottom left). Heatmap showing the average cell type prediction score for each cluster (bottom right).
c. Subtype prediction scores for the RR6 spatial-seq sample. The spots in the corresponding cluster were used to plot the subtype scores. For example, the FB0 prediction score was plotted in the spots from cluster 5, which was annotated as fibroblasts.
Extended Data Fig. 8. Spatial distance between the FB0 and FB2 sub-clusters and the epidermis in the RR and T-lep samples.
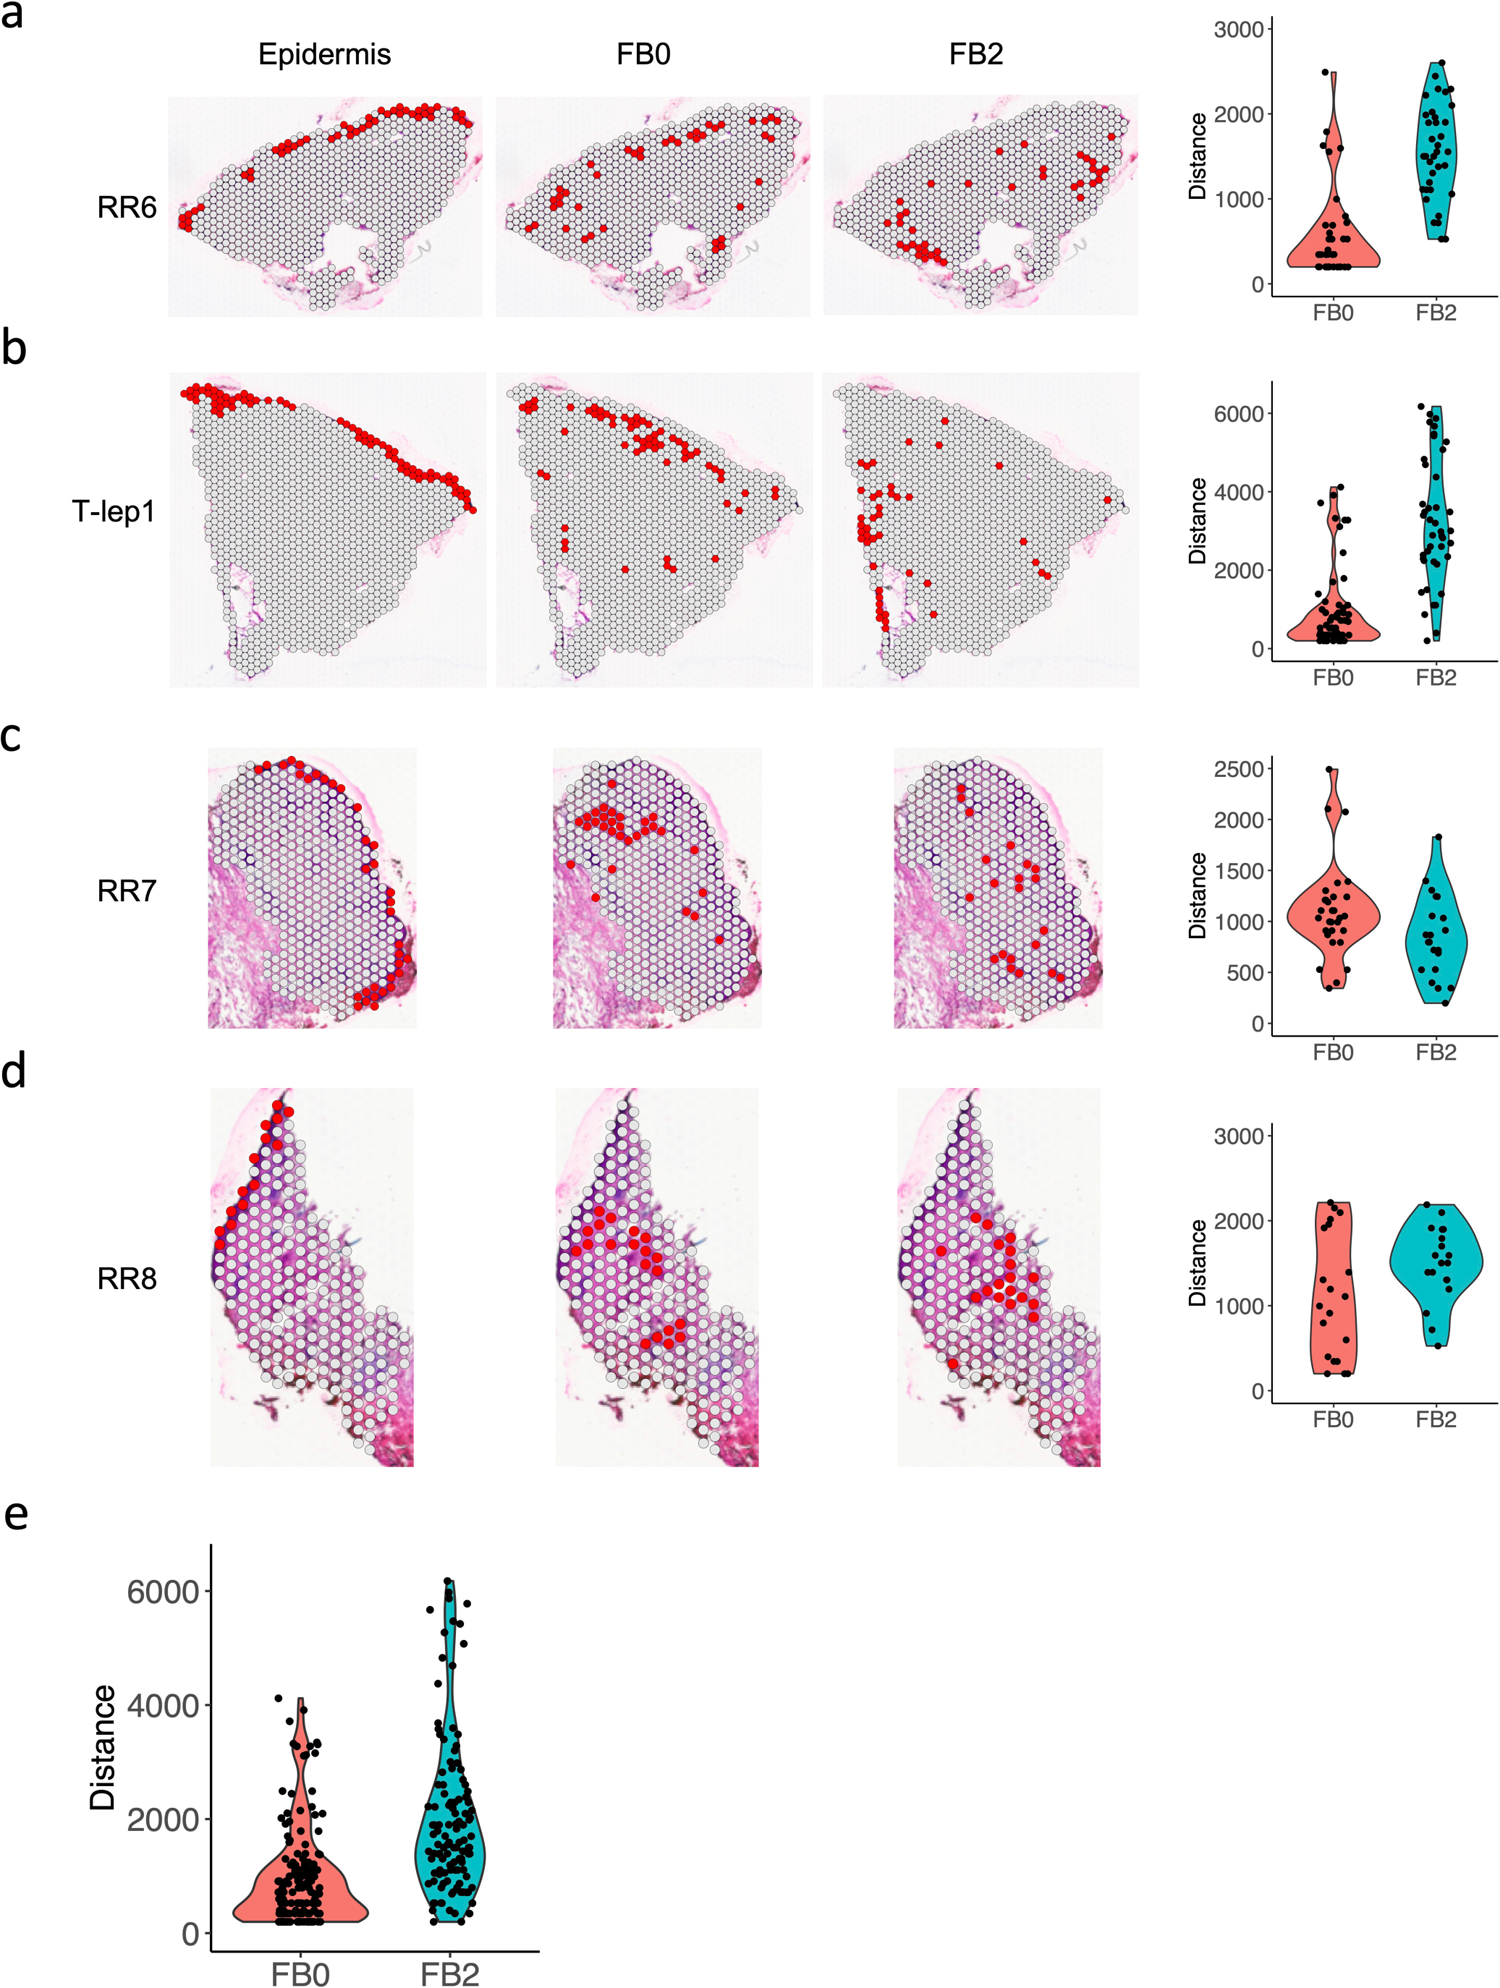
a. Spatial plots showing the identified epidermis, FB0 and FB2 spots in the RR6 sample (left). Violin plot showing the distance of each FB0 and FB2 spot to the nearest epidermis spot.
b. Spatial plots showing the identified epidermis, FB0 and FB2 spots in the T-lep1 sample (left). Violin plot showing the distance of each FB0 and FB2 spot to the nearest epidermis spot.
c. Spatial plots showing the identified epidermis, FB0 and FB2 spots in the RR7 sample (left). Violin plot showing the distance of each FB0 and FB2 spot to the nearest epidermis spot.
d. Spatial plots showing the identified epidermis, FB0 and FB2 spots in the RR8 sample (left). Violin plot showing the distance of each FB0 and FB2 spot to the nearest epidermis spot.
e. Violin plot showing the distance of each FB0 and FB2 spot to the nearest epidermis spot in all three RR and the T-lep spatial-seq samples. The p value (1.32e-14) was calculated from a two-sided Wilcoxon rank sum test (152 FB0 spots vs 120 FB2 spots).
Extended Data Fig. 9. Immunohistochemistry validation of DEFB1, CXCL14 and TAC1 protein expression in the epidermis of three RR and three L-lep biopsy specimens.
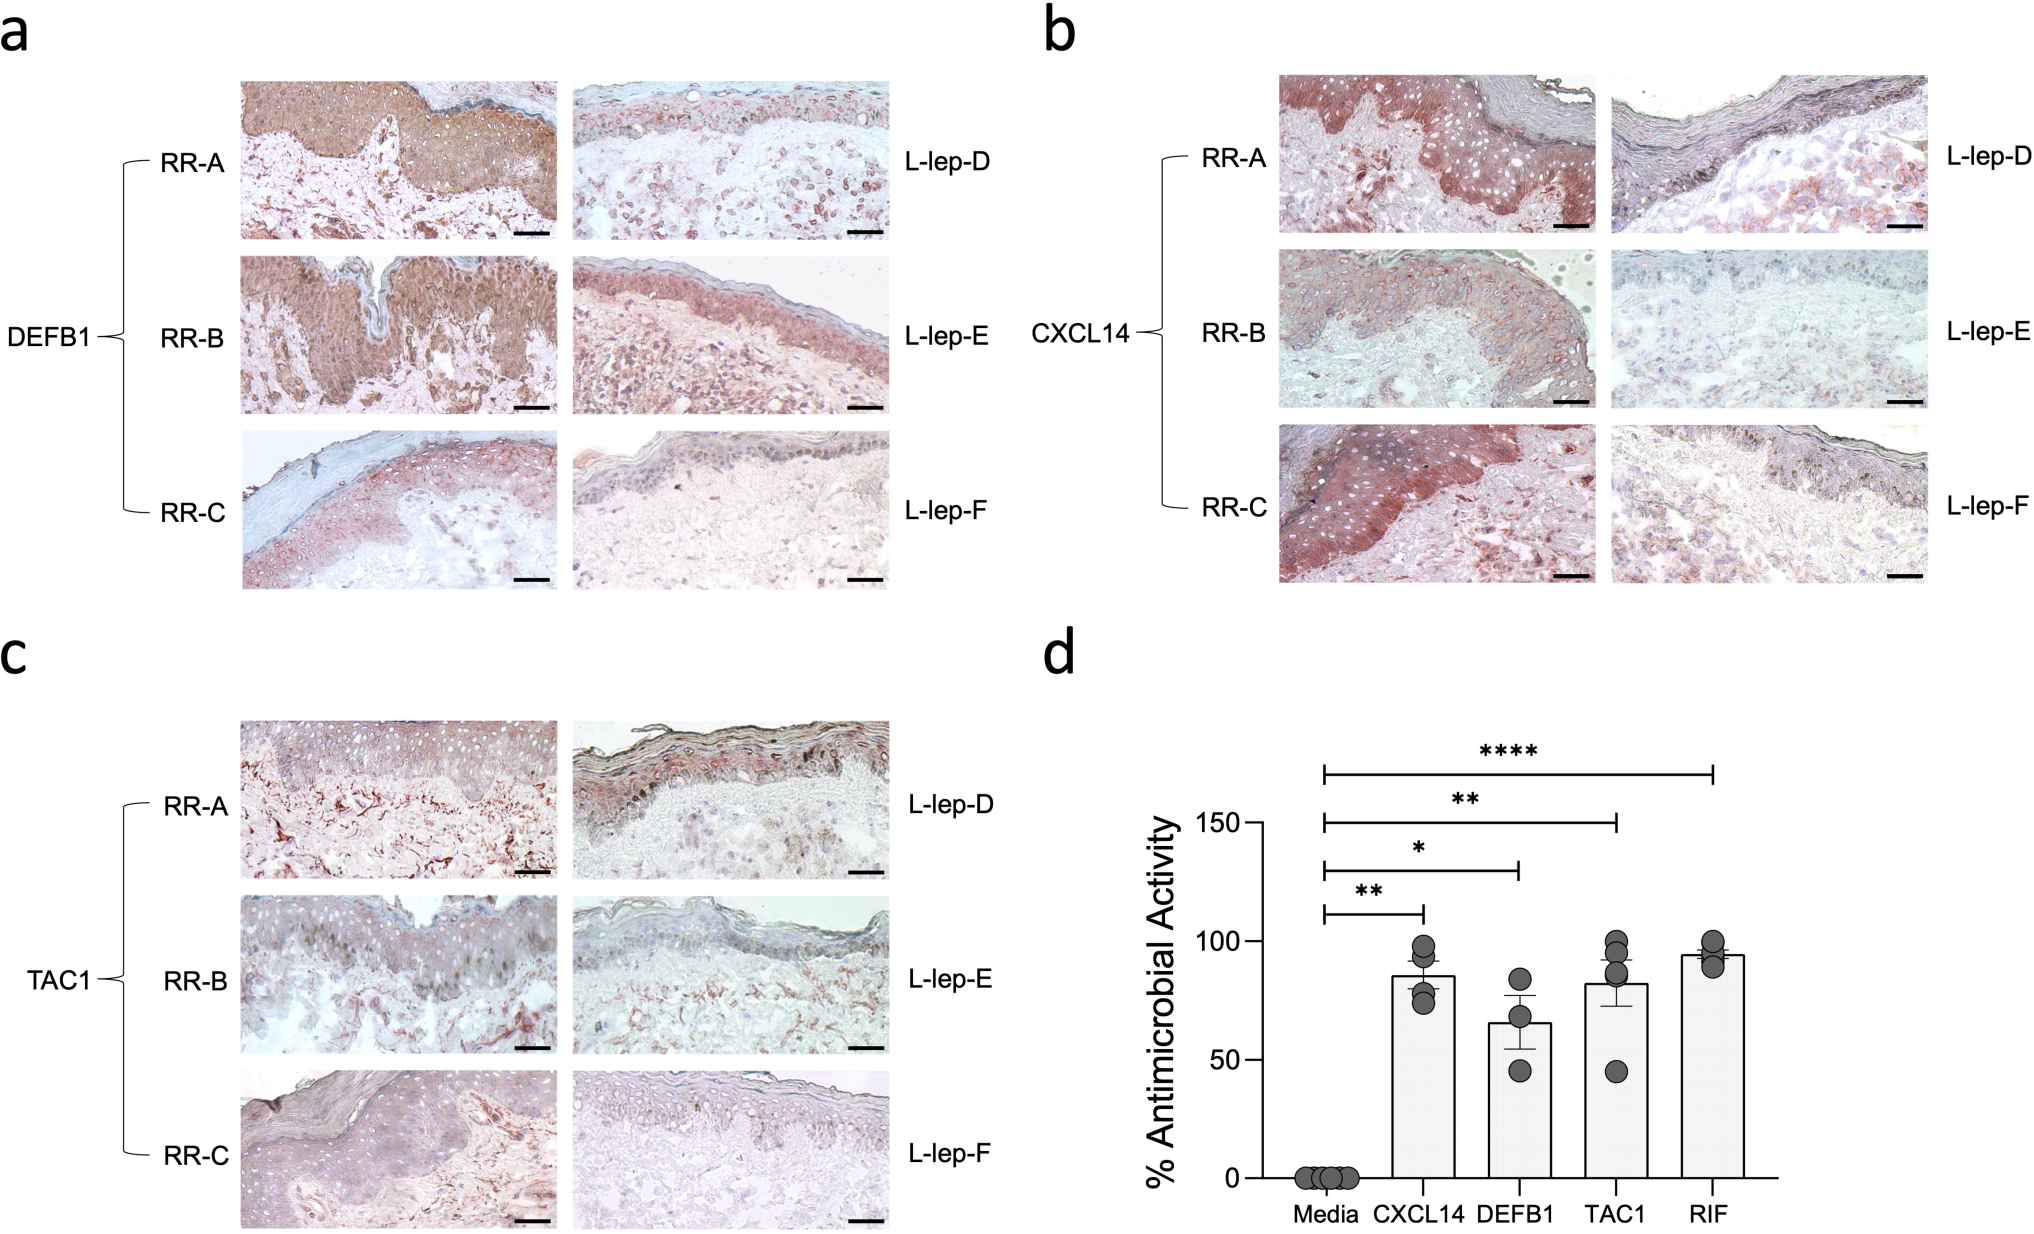
a. Immunohistochemistry using monoclonal antibodies to DEFB1. The corresponding isotype controls were negative. Scale bar: 20 μm. Original magnification: x200.
b. Immunohistochemistry using monoclonal antibodies to CXCL14. The corresponding isotype controls were negative. Scale bar: 20 μm. Original magnification: x200.
c. Immunohistochemistry using monoclonal antibodies to TAC1. The corresponding isotype controls were negative. Scale bar: 20 μm. Original magnification: x200.
d. Antimicrobial activity was determined by pretreatment of MDMs from healthy donors with 1μM of DEFB1 (n=3), CXCL14 (n=4) and TAC1 (n=5) for 30 minutes followed by M. leprae infection (MOI 5:1). Rifampicin (RIF, 10ug/ml) was used as positive control. M. leprae viability was determined by qPCR after 4 days and % antimicrobial activity was calculated by assigning 100% viability to the media control. All data represent the mean ± SEM. Statistical analyses were performed using mixed effects analysis with Dunnet’s multiple comparisons test in the GraphPad Prism 8 software. *p<0.05, **p<0.01, ****p<0.0001.
Extended Data Fig. 10. TREM2 module score comparison in the RR, T-lep and L-lep spatial-seq samples.
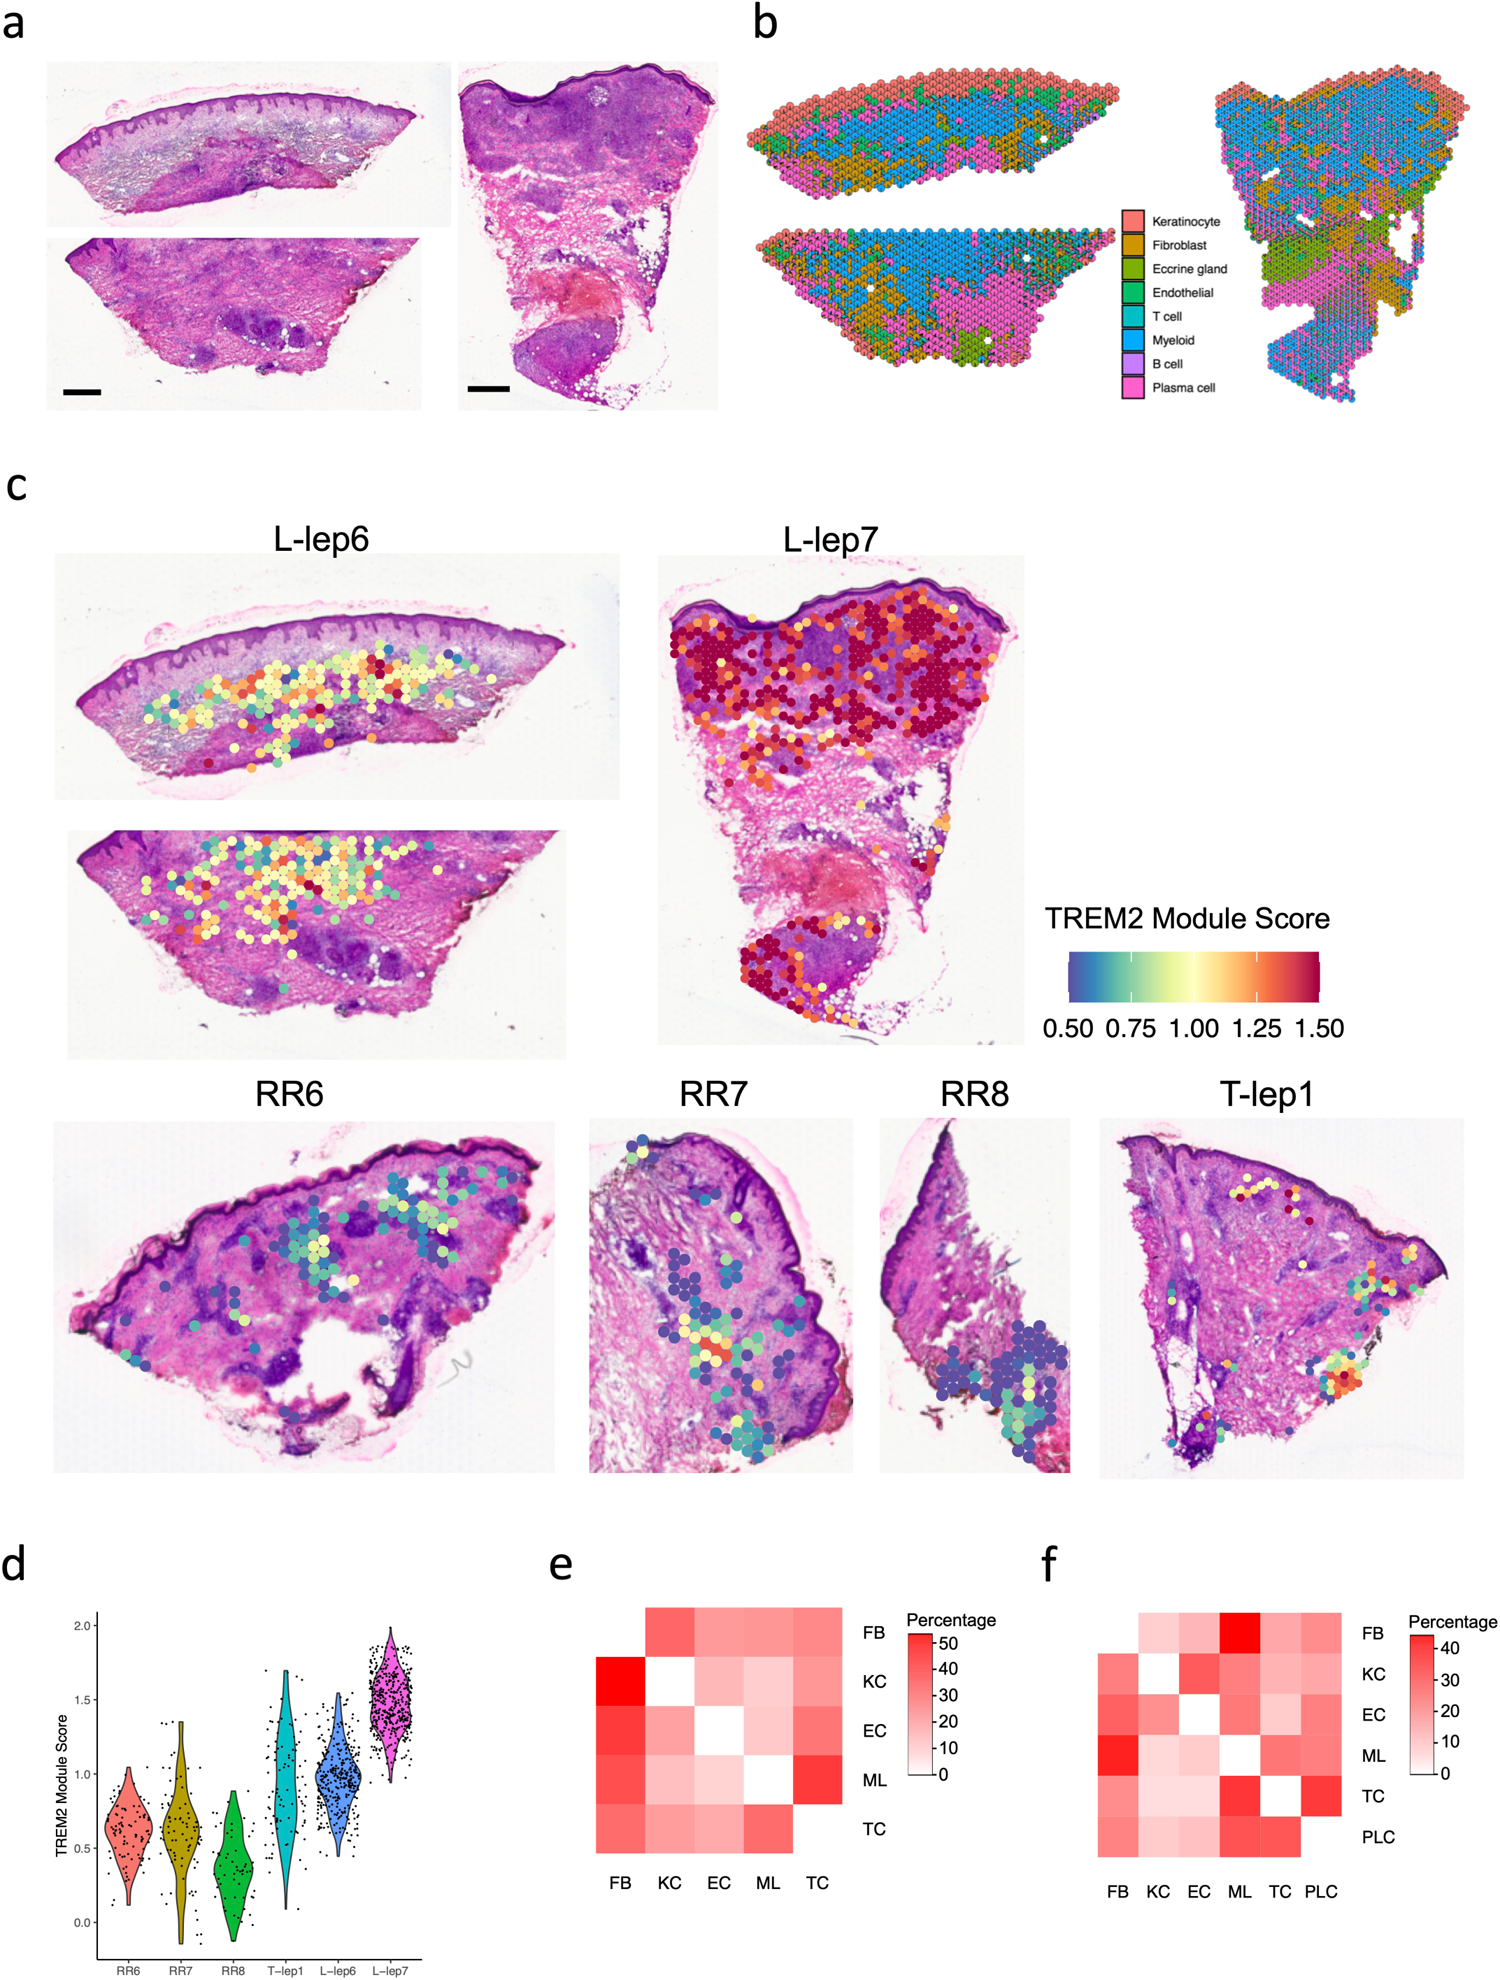
a. H & E staining of the two L-lep biopsies used for spatial sequencing. The first tissue slide was folded in the dermis region, thus a replicate slide from the same tissue covering the dermis region was processed in the same spatial-seq run. Scale bar: 0.5 mm.
b. Scatter pie plot showing the cell type composition of the two L-lep spatial-seq samples. Each spot is represented as a pie chart showing the relative proportion of the cell types.
c. Spatial plots showing the TREM2 module score in the myeloid spots from all spatial-seq samples. The same color scale was applied across the samples.
d. Violin plot showing the TREM2 module score in the myeloid spots for individual samples. The p value (<2.2e-16) was calculated from a two-sided Wilcoxon rank sum test (329 RR and T-lep spots vs 760 L-lep spots).
e. Heatmap showing the number of neighbors for each pair of cell types in the RR and T-lep spatial-seq samples. The percentage of the numbers were calculated for each row, thus each row sum to 1.
f. Heatmap showing the number of neighbors for each pair of cell types in the L-lep spatial-seq samples. The percentage of the numbers were calculated for each row, thus each row sum to 1.
Supplementary Material
Supplementary Table 1. Clinical forms of each patient and quality for each scRNA-seq library.
Supplementary Table 2. Marker genes for each cell type from single cell RNA sequencing, and marker genes for the subtypes including T cellsz myeloid cells, keratinocytes, fibroblasts and endothelial cells.
Supplementary Table 3. Type I and Type II Interferon signature genes derived from activated human PBMC.
Supplementary Table 4. Genes in six patterns along macrophage and keratinocyte pseudotime.
Supplementary Table 5. Antimicrobial genes curated from GeneCards and direct antimicrobial genes obtained from The Antimicrobial Peptide Database.
Supplementary Table 6. Validation of antimicrobial genes in leprosy and other mycobacterial infections as previously reported.
Supplementary Table 7. Clinical forms of each patient and quality for each spatial-seq library.
Supplementary Table 8. Marker genes for each cluster from spatial sequencing for the RR and T-lep samples.
Acknowledgements
This work was supported in part by NIH grants AI-22553 and AR-40312 to R.L. M., NIH-P30 AR075043 (J.E.G), the Searle Scholars Program, the Beckman Young Investigator Program, a Sloan Fellowship in Chemistry, the NIH (5U24AI118672), and the Bill and Melinda Gates Foundation to A.K.S.
Footnotes
Declaration of Interests
A.K.S. reports compensation for consulting and/or SAB membership from Merck, Honeycomb Biotechnologies, Cellarity, Cogen Therapeutics, Orche Bio, and Dahlia Biosciences. The remaining authors declare no competing interests.
Data availability
The scRNA-seq data are available in GEO under accession number GSE151528. The spatial-seq data are available in GEO under accession number GSE167889.
References
- 1.Gordon S Alternative activation of macrophages. Nat. Rev. Immunol 3, 23–35 (2003). [DOI] [PubMed] [Google Scholar]
- 2.Ridley DS & Jopling WH Classification of leprosy according to immunity. A five-group system. Int J Lepr 34, 255–273 (1966). [PubMed] [Google Scholar]
- 3.Modlin RL, Hofman FM, Taylor CR & Rea TH T lymphocyte subsets in the skin lesions of patients with leprosy. J. Am. Acad. Dermatol 8, 182–189 (1983). [DOI] [PubMed] [Google Scholar]
- 4.Stenger S et al. Differential effects of cytolytic T cell subsets on intracellular infection. Science 276, 1684–1687 (1997). [DOI] [PubMed] [Google Scholar]
- 5.Stenger S et al. An antimicrobial activity of cytolytic T cells mediated by granulysin. Science 282, 121–125 (1998). [DOI] [PubMed] [Google Scholar]
- 6.Ochoa MT et al. T-cell release of granulysin contributes to host defense in leprosy. Nat. Med 7, 174–179 (2001). [DOI] [PubMed] [Google Scholar]
- 7.Montoya D et al. Divergence of macrophage phagocytic and antimicrobial programs in leprosy. Cell Host Microbe 6, 343–353 (2009). [DOI] [PMC free article] [PubMed] [Google Scholar]
- 8.Cooper CL et al. Analysis of naturally occurring delayed-type hypersensitivity reactions in leprosy by in situ hybridization. J. Exp. Med 169, 1565–1581 (1989). [DOI] [PMC free article] [PubMed] [Google Scholar]
- 9.Yamamura M et al. Defining protective responses to pathogens: cytokine profiles in leprosy lesions. Science 254, 277–279 (1991). [DOI] [PubMed] [Google Scholar]
- 10.Yamamura M et al. Cytokine patterns of immunologically mediated tissue damage. J. Immunol 149, 1470–1475 (1992). [PubMed] [Google Scholar]
- 11.Teles RM et al. Type I interferon suppresses type II interferon-triggered human anti-mycobacterial responses. Science 339, 1448–1453 (2013). [DOI] [PMC free article] [PubMed] [Google Scholar]
- 12.Liu PT et al. Toll-like receptor triggering of a vitamin D-mediated human antimicrobial response. Science 311, 1770–1773 (2006). [DOI] [PubMed] [Google Scholar]
- 13.Fabri M et al. Vitamin D is required for IFN-gamma-mediated antimicrobial activity of human macrophages. Sci. Transl. Med 3, 104ra102 (2011). [DOI] [PMC free article] [PubMed] [Google Scholar]
- 14.Ochoa MT et al. Role of granulysin in immunity to leprosy. Lepr. Rev 71 Suppl, S115; discussion S115–116 (2000). [DOI] [PubMed] [Google Scholar]
- 15.Dang AT et al. IL-26 contributes to host defense against intracellular bacteria. J. Clin. Invest 129, 1926–1939 (2019). [DOI] [PMC free article] [PubMed] [Google Scholar]
- 16.Gierahn TM et al. Seq-Well: portable, low-cost RNA sequencing of single cells at high throughput. Nat Methods 14, 395–398 (2017). [DOI] [PMC free article] [PubMed] [Google Scholar]
- 17.Butler A, Hoffman P, Smibert P, Papalexi E & Satija R Integrating single-cell transcriptomic data across different conditions, technologies, and species. Nat. Biotechnol 36, 411–420 (2018). [DOI] [PMC free article] [PubMed] [Google Scholar]
- 18.Tirosh I et al. Dissecting the multicellular ecosystem of metastatic melanoma by single-cell RNA-seq. Science 352, 189–196 (2016). [DOI] [PMC free article] [PubMed] [Google Scholar]
- 19.Balin SJ et al. Human antimicrobial cytotoxic T lymphocytes, defined by NK receptors and antimicrobial proteins, kill intracellular bacteria. Sci Immunol 3, 10.1126/sciimmunol.aat7668 (2018). [DOI] [PMC free article] [PubMed] [Google Scholar]
- 20.Busch M et al. Lipoarabinomannan-Responsive Polycytotoxic T Cells Are Associated with Protection in Human Tuberculosis. Am. J. Respir. Crit. Care Med 194, 345–355 (2016). [DOI] [PMC free article] [PubMed] [Google Scholar]
- 21.Cochain C et al. Single-Cell RNA-Seq Reveals the Transcriptional Landscape and Heterogeneity of Aortic Macrophages in Murine Atherosclerosis. Circ. Res 122, 1661–1674 (2018). [DOI] [PubMed] [Google Scholar]
- 22.Jaitin DA et al. Lipid-Associated Macrophages Control Metabolic Homeostasis in a Trem2-Dependent Manner. Cell 178, 686–698 e614 (2019). [DOI] [PMC free article] [PubMed] [Google Scholar]
- 23.Keren-Shaul H et al. A Unique Microglia Type Associated with Restricting Development of Alzheimer’s Disease. Cell 169, 1276–1290 e1217 (2017). [DOI] [PubMed] [Google Scholar]
- 24.Lavin Y et al. Innate Immune Landscape in Early Lung Adenocarcinoma by Paired Single-Cell Analyses. Cell 169, 750–765 e717 (2017). [DOI] [PMC free article] [PubMed] [Google Scholar]
- 25.Xue D, Tabib T, Morse C & Lafyatis R Transcriptome landscape of myeloid cells in human skin reveals diversity, rare populations and putative DC progenitors. J. Dermatol. Sci 97, 41–49 (2020). [DOI] [PubMed] [Google Scholar]
- 26.Wang ECE, Dai Z, Ferrante AW, Drake CG & Christiano AM A Subset of TREM2(+) Dermal Macrophages Secretes Oncostatin M to Maintain Hair Follicle Stem Cell Quiescence and Inhibit Hair Growth. Cell Stem Cell 24, 654–669 e656 (2019). [DOI] [PubMed] [Google Scholar]
- 27.Xiong X et al. Landscape of Intercellular Crosstalk in Healthy and NASH Liver Revealed by Single-Cell Secretome Gene Analysis. Mol. Cell 75, 644–660 e645 (2019). [DOI] [PMC free article] [PubMed] [Google Scholar]
- 28.Esaulova E et al. The immune landscape in tuberculosis reveals populations linked to disease and latency. Cell Host Microbe 29, 165–178 e168 (2021). [DOI] [PMC free article] [PubMed] [Google Scholar]
- 29.Tabib T, Morse C, Wang T, Chen W & Lafyatis R SFRP2/DPP4 and FMO1/LSP1 Define Major Fibroblast Populations in Human Skin. J. Invest. Dermatol 138, 802–810 (2018). [DOI] [PMC free article] [PubMed] [Google Scholar]
- 30.He H et al. Single-cell transcriptome analysis of human skin identifies novel fibroblast subpopulation and enrichment of immune subsets in atopic dermatitis. J. Allergy Clin. Immunol 145, 1615–1628 (2020). [DOI] [PubMed] [Google Scholar]
- 31.Chen Y, Rabson AB & Gorski DH MEOX2 regulates nuclear factor-kappaB activity in vascular endothelial cells through interactions with p65 and IkappaBbeta. Cardiovasc. Res 87, 723–731 (2010). [DOI] [PMC free article] [PubMed] [Google Scholar]
- 32.Trapnell C et al. The dynamics and regulators of cell fate decisions are revealed by pseudotemporal ordering of single cells. Nat. Biotechnol 32, 381–386 (2014). [DOI] [PMC free article] [PubMed] [Google Scholar]
- 33.Wang G, Li X & Wang Z APD3: the antimicrobial peptide database as a tool for research and education. Nucleic Acids Res 44, D1087–1093 (2016). [DOI] [PMC free article] [PubMed] [Google Scholar]
- 34.Sole-Boldo L et al. Single-cell transcriptomes of the human skin reveal age-related loss of fibroblast priming. Communications biology 3, 188 (2020). [DOI] [PMC free article] [PubMed] [Google Scholar]
- 35.Meller S et al. T(H)17 cells promote microbial killing and innate immune sensing of DNA via interleukin 26. Nat. Immunol 16, 970–979 (2015). [DOI] [PMC free article] [PubMed] [Google Scholar]
- 36.Iyer AM et al. Leprosy-specific B-cells within cellular infiltrates in active leprosy lesions. Hum. Pathol 38, 1065–1073 (2007). [DOI] [PubMed] [Google Scholar]
- 37.Ochoa MT et al. A role for interleukin-5 in promoting increased immunoglobulin M at the site of disease in leprosy. Immunology 131, 405–414 (2010). [DOI] [PMC free article] [PubMed] [Google Scholar]
- 38.Montoya DJ et al. Dual RNA-Seq of Human Leprosy Lesions Identifies Bacterial Determinants Linked to Host Immune Response. Cell reports 26, 3574–3585 e3573 (2019). [DOI] [PMC free article] [PubMed] [Google Scholar]
- 39.Macosko EZ et al. Highly Parallel Genome-wide Expression Profiling of Individual Cells Using Nanoliter Droplets. Cell 161, 1202–1214 (2015). [DOI] [PMC free article] [PubMed] [Google Scholar]
- 40.Dobin A et al. STAR: ultrafast universal RNA-seq aligner. Bioinformatics 29, 15–21 (2013). [DOI] [PMC free article] [PubMed] [Google Scholar]
- 41.Young MD & Behjati S SoupX removes ambient RNA contamination from droplet-based single-cell RNA sequencing data. Gigascience 9, 303727 (2020). [DOI] [PMC free article] [PubMed] [Google Scholar]
- 42.Teles RMB et al. Identification of a systemic interferon-gamma inducible antimicrobial gene signature in leprosy patients undergoing reversal reaction. PLoS Negl. Trop. Dis 13, e0007764 (2019). [DOI] [PMC free article] [PubMed] [Google Scholar]
- 43.Andrade R, P. et al. The cell fate regulator NUPR1 is induced by Mycobacterium leprae via type I interferon in human leprosy. PLoS Negl. Trop. Dis 13, e0007589 (2019). [DOI] [PMC free article] [PubMed] [Google Scholar]
- 44.Wang H et al. Cellular, Molecular, and Immunological Characteristics of Langhans Multinucleated Giant Cells Programmed by IL-15. J. Invest. Dermatol 140, 1824–1836 e1827 (2020). [DOI] [PMC free article] [PubMed] [Google Scholar]
- 45.Waddell SJ et al. Dissecting interferon-induced transcriptional programs in human peripheral blood cells. PLoS One 5, e9753 (2010). [DOI] [PMC free article] [PubMed] [Google Scholar]
- 46.Inkeles MS et al. Cell-type deconvolution with immune pathways identifies gene networks of host defense and immunopathology in leprosy. JCI insight 1, e88843 (2016). [DOI] [PMC free article] [PubMed] [Google Scholar]
- 47.Martinez AN et al. Molecular determination of Mycobacterium leprae viability by use of real-time PCR. J. Clin. Microbiol 47, 2124–2130 (2009). [DOI] [PMC free article] [PubMed] [Google Scholar]
Associated Data
This section collects any data citations, data availability statements, or supplementary materials included in this article.
Supplementary Materials
Supplementary Table 1. Clinical forms of each patient and quality for each scRNA-seq library.
Supplementary Table 2. Marker genes for each cell type from single cell RNA sequencing, and marker genes for the subtypes including T cellsz myeloid cells, keratinocytes, fibroblasts and endothelial cells.
Supplementary Table 3. Type I and Type II Interferon signature genes derived from activated human PBMC.
Supplementary Table 4. Genes in six patterns along macrophage and keratinocyte pseudotime.
Supplementary Table 5. Antimicrobial genes curated from GeneCards and direct antimicrobial genes obtained from The Antimicrobial Peptide Database.
Supplementary Table 6. Validation of antimicrobial genes in leprosy and other mycobacterial infections as previously reported.
Supplementary Table 7. Clinical forms of each patient and quality for each spatial-seq library.
Supplementary Table 8. Marker genes for each cluster from spatial sequencing for the RR and T-lep samples.
Data Availability Statement
The scRNA-seq data are available in GEO under accession number GSE151528. The spatial-seq data are available in GEO under accession number GSE167889.


