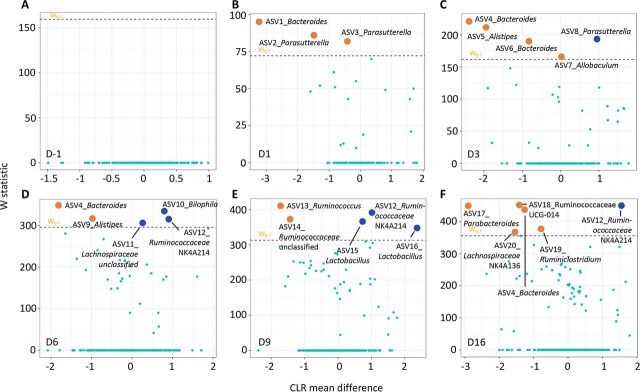
FIG 4.
Taxonomy differential analysis on ASVs between the RYGBr and SHAMr groups at D-1 (A), D1 (B), D3 (C), D6 (D), D9 (E), and D16 (F) using ANCOM analysis. The x axis shows the centered log ratio (CLR) mean difference, and the y axis shows the W statistic representing the strength of ANCOM test, where a cutoff value of 0.7 was used. Sky blue dots represent nonsignificant ASVs between the two groups, whereas orange or dark blue dots represent ASVs that are significantly higher in the RYGBr or SHAMr group compared to the other group. The dots are labeled with ASV ID_genus. The sequences and taxonomy of these ASVs are summarized in Table S3 in the supplemental material.

