

Abstract
Background
We determined the frequency of genetic polymorphisms in three anti‐TB drug metabolic proteins previously reported: N‐acetyltransferase 2 (NAT2), cytochrome P450 2E1 (CYP2E1), and arylacetamide deacetylase (AADAC) within a Peruvian population in a cohort of TB patients.
Methods
We genotyped SNPs rs1041983, rs1801280, rs1799929, rs1799930, rs1208, and rs1799931 for NAT2; rs3813867 and rs2031920 for CYP2E1; and rs1803155 for AADAC in 395 participants completed their antituberculosis treatment.
Results
Seventy‐four percent of the participants are carriers of slow metabolizer genotypes: NAT2*5, NAT2*6, and NAT2*7, which increase the sensitivity of INH at low doses and increase the risk of drug‐induced liver injuries. Sixty‐four percent are homozygous for the wild‐type CYP2E1*1A allele, which could increase the risk of hepatotoxicity. However, 16% had a NAT2 fast metabolizer phenotype which could increase the risk of acquiring resistance to INH, thereby increasing the risk of multidrug‐resistant (MDR) or treatment failure. The frequency of rs1803155 (AADAC*2 allele) was higher (99.9%) in Peruvians than in European American, African American, Japanese, and Korean populations.
Conclusions
This high prevalence of slow metabolizers for isoniazid in the Peruvian population should be further studied and considered to help individualize drug regimens, especially in countries with a great genetic diversity like Peru. These data will help the Peruvian National Tuberculosis Control Program develop new strategies for therapies.
Keywords: AADAC, CYP2E1, NAT2, tuberculosis
High prevalence of slow metabolizers for isoniazid in the Peruvian population should be further studied and considered to help individualize drug regimens, especially in countries with a great genetic diversity like Peru.

1. BACKGROUND
Tuberculosis (TB) continues to be a leading cause of global morbidity and mortality, with about 10 million cases and a total of 1.2 million deaths reported in 2019 (“WHO | Global Tuberculosis Report 2019,” 2020). Even though the current TB regimen is highly effective under optimal conditions, there are still many undefined issues including drug underexposure, high prevalence if drug‐related toxicity, selection of resistant strains and variability of response (Motta et al., 2018), which could be explained by the variability in the pharmacokinetics of anti‐TB drugs. Mutations or polymorphisms in genes encoding metabolic enzymes, transporters, or carries can lead to this variability in drug pharmacokinetics and pharmacodynamics. The identification of these genetic variations could help select the right anti‐TB drug, with the right dosage increasing efficacy and reducing drug‐related toxicity and preventing drug resistance (Figueiredo Teixeira et al., 2013; Motta et al., 2018).
To determine if genetic variabilities affecting drug response were present in the Peruvian population, which has a high TB burden with an estimated 32,970 cases in 2019 (“WHO | Global Tuberculosis Report 2019,” 2020), including a high prevalence of drug‐resistant TB cases, we determined the frequency of genetic polymorphisms in three anti‐TB drug metabolic proteins previously reported: N‐acetyltransferase 2 (NAT2) (OMIM # 612182), cytochrome P450 2E1 (CYP2E1) (OMIM # 124040), and arylacetamide deacetylase (AADAC) (OMIM # 600338) (Guio et al., ). These three proteins participate in the metabolism of the initial phase anti‐TB drugs: isoniazid and rifampicin. In the liver, isoniazid is acetylated to its major metabolite, N‐acetyl‐isoniazid by the action of NAT2. It is then further deactivated by other enzymes including CYP2E1 (Bao et al., 2018; Sotsuka et al., 2011). Thus, genetic variations in these two enzymes, leading to alterations in their enzymatic functions can cause variations in isoniazid pharmacokinetics. AADAC is one of the few known enzymes responsible for the deacetylation of rifampicin and AADAC allele decreased enzyme activity (Lee et al., 2019; Nakajima et al., 2011). Thus, genetic variations in these three enzymes, leading to alterations in their enzymatic functions could cause variations in isoniazid and rifampicin pharmacokinetics. For the present study, we selected previously reported single nucleotide polymorphisms (SNPs) that could alter NAT2, CYP2E1, and AADAC enzyme activity and determine their frequency within a Peruvian population in a cohort of TB patients.
2. PATIENTS AND METHODS
2.1. Studied populations
Our study includes 395 unrelated individuals diagnosed with pulmonary tuberculosis between 2014 and 2015 recruited from health establishments of the Minister of Health (MINSA) located in Lima and Callao, Peru. The 395 participants (217 males and 178 females) completed their antituberculosis treatment.
2.2. Genotyping of NAT2, CYP2E1, and AADAC
Genomic DNA was extracted from peripheral blood of all 395 participants using the genomic DNA extraction kit QIAamp DNA Blood Mini Kit (Qiagen). The selected genomic DNA regions for the analysis of each gene included the most common reported SNPs (For NAT2: rs1041983, rs1801280, rs1799929, rs1799930, rs1208, and rs1799931; for CYP2E1: rs3813867 and rs2031920; for AADAC: rs1803155). These regions were amplified by the PCR using Platinum Taq DNA polymerase kit (Invitrogen, USA) using the following primers: For NAT2: 5′‐GTCACACGAGGAAATCAAATGCT‐3 and 5′‐CGTGAGGGTAGAGAGGATATCTG‐3′; for CYP2E1: 5′‐CCGTGAGCCAGTCGAGTCTA‐3′ and 5′‐TTCATTCTGTCTTCTAACTGGCAA‐3′; and for AADAC: 5’‐TCATTCCTAGCAGAAAGGAGATT‐3’ and 5′‐GCTCACATTTATTCTCTTGCATCG‐3′. PCR‐amplified fragments were purified using the QIAmp Gel Purification Kit (Qiagen). SNP genotyping on the purified fragments was performed using Sanger sequencing (Macrogen). Nucleotide substitutions were identified and analyzed using the Geneious version 9.1.5 (Biomatters Ltd.).
2.3. Computational phenotyping for NAT2
Predicted phenotypes were determined from genotypes as three types of metabolizers: slow metabolizer (two slow alleles), rapid metabolizer (two rapid alleles), and intermediate metabolizer (one slow and another rapid acetylator allele). The alleles considered rapid were: wild‐type NAT2∗4, 282C>T (NAT2∗13), 481C>T (NAT2∗11), and 803A>G (NAT2∗12), while the alleles considered slow were: 341T>C (NAT2∗5), 590G>A (NAT2∗6), 857G>A (NAT2∗7), and 191G>A (NAT2∗14) (Hein et al., 2000). The computational inferred phenotypes using a combination of NAT2 SNPs for the 395 participants were determined using an online software program, NAT2PRED (nat2pred.rit.albany.edu) (Kuznetsov et al., 2009; Sabbagh et al., 2009).
2.4. Statistical analysis
For phenotypic genotypic and allelic frequencies, 95% confidence intervals were calculated. Data analysis was carried out using Stata 15 program (StataCorp. 2016. Stata Statistical Software: Release 15. College Station, TX, USA).
3. RESULTS
In this study, we determined the presence of the six most common SNPs, rs1041983 (282C>T), rs1801280 (341T>C), rs1799929 (481C>T), rs1799930 (590G>A), rs1208 (803A>G), and rs1799931 (857G>A), of the NAT2 gene in the 395 individuals from Lima and Callao, Peru. No new SNPs were identified, indicating that the NAT2 gene has no other SNPs in the Peruvian population studied. The allele frequencies of these major NAT2 SNPs are represented in Table 1. This study found that NAT2∗13, C282T, is the most frequent genetic variant (~40% of alleles) among our samples. The allele not harboring any mutation (wild‐type NAT2∗4) was present in 44 of the 395 samples (~11% of alleles). Table 2 shows the frequencies of NAT2 genotype obtained from the studied population. The most frequent observed heterozygote was also NAT2∗13 C282T (48.6%), followed by NAT2∗11 C481T (34.9%) and NAT2∗5 T341C (34.7%) among the Peruvian population studied. The lowest frequency of observed heterozygote genotypes was NAT2∗12 A803G with a frequency of 18.7%. In homozygote, the NAT2∗12 803A>G (31.2%) genotype was the most common one but the lowest homozygote among them was NAT2∗6 590G>A (12.5%). The linkage disequilibrium (LD) analysis is shown in Figure 1. The six NAT2 variants, 282C>T, 341T>C, 481C>T, 590G>A, 803A>G, and 857G>A were applied to Haploview software. The LD for each pair of genetic variants was measured using ∣D′ ∣ and correlation coefficient (r2 > 0:8). A haplotype block was found in the following SNP positions 341T>C and 481C>T (D′: 0.808 and r 2: 0.437) in Peruvian population samples which is identified as like strong LD. There were no significant differences observed between NAT2 genotypes with respect to age and gender. The NAT2 inferred metabolizing status was predicted using the six SNPs analyzed as stated above. As a result, the predicted metabolizing phenotype of fast, intermediate, and slow metabolizers was 14.9%, 38.2%, and 46.8%, respectively (Table 3).
TABLE 1.
Allele frequencies of NAT2, CYP2E1, and AADAC polymorphisms in a Peruvian population (n = 395)
| Gene | Allele (Haplotype) | SNP | Position | Substituted amino acid | Allele frequency (95% CI) |
|---|---|---|---|---|---|
| NAT2 | NAT2*4 | Wild‐type | 0.111 (0.089–0.134) | ||
| NAT2*13 | rs1041983 | c.282C>T | Y94Y | 0.397 (0.363–0.432) | |
| NAT2*5 | rs1801280 | c.341T>C | I114T | 0.247 (0.216–0.278) | |
| NAT2*11 | rs1799929 | c.481C>T | L161L | 0.329 (0.296–0.363) | |
| NAT2*6 | rs1799930 | c.590G>A | R197Q | 0.138 (0.113–0.163) | |
| NAT2*12 | rs1208 | c.803A>G | R268K | 0.228 (0.198–0.258) | |
| NAT2*7 | rs1799931 | c.857G>A | G286E | 0.356 (0.322–0.390) | |
| CYP2E1 | CYP2E1*1A | Wild‐type | 0.79359 (0.765–0.823) | ||
| CYP2E1*5B | rs2031920 | c.‐1053C>T | 0.206 (0.177–0.235) | ||
| AADAC | AADAC*1 | Wild‐type | 0.199 (0.167–0.230) | ||
| AADAC*2 | rs1803155 | c.841G>A | V281I | 0.999 (0.967–1.03) |
TABLE 2.
Genotype frequency of NAT2, CYP2E1, and AADAC genes in a Peruvian population (n = 395)
| Gene | Allele | Wild‐type frequency (proportion, 95% CI) | Heterozygote frequency (proportion, 95% CI) | Homozygote frequency (proportion, 95% CI) |
|---|---|---|---|---|
| NAT2 | NAT2*13 (C282T) | C/C: 142 (0.359, 0.312–0.407) | C/T: 192 (0.486, 0.437–0.535) | T/T: 61 (0.154, 0.119–0.190) |
| NAT2*5 (T341C) | T/T: 229 (0.580, 0.531–0.628) | T/C: 137 (0.347, 0.300–0.394) | C/C: 29 (0.073, 0.048–0.099) | |
| NAT2*11 (C481T) | C/C: 196 (0.496, 0.447–0.546) | C/T: 138 (0.349, 0.302–0.396) | T/T: 61 (0.154, 0.119–0.190) | |
| NAT2*6 (G590A) | G/G: 303 (0.767, 0.725–0.809) | G/A: 75 (0.190, 0.151–0.229) | A/A: 17 (0.043, 0.023–0.063) | |
| NAT2*12 (A803G) | A/A: 268 (0.678, 0.632–0.725) | A/G: 74 (0.187, 0.149–0.226) | G/G: 53 (0.134, 0.101–0.168) | |
| NAT2*7 (G857A) | G/G: 210 (0.532, 0.482–0.581) | G/A: 89 (0.225, 0.184–0.267) | A/A: 96 (0.243, 0.201–0.285) | |
| CYP2E1 | CYP2E1*5B(C−1053T) | C/C: 250 (0.641, 0.594–0.688) | C/T: 119 (0.359, 0.312–0.406) | T/T: 21 (0.076, 0.032–0.076) |
| AADAC | AADAC*2 (G841A) | G/G: 19 (0.048, 0.027–0.069) | G/A: 41 (0.104, 0.074–0.134) | A/A: 335 (0.848, 0.813–0.883) |
FIGURE 1.
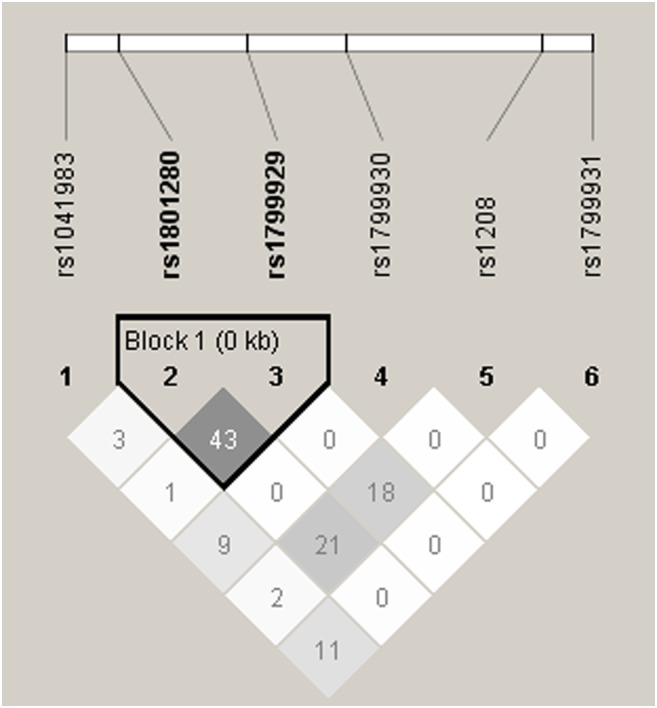
Linkage disequilibrium for NAT2 metabolizer‐associated SNPs in Peruvian population studied
TABLE 3.
Predicted metabolizing phenotype for NAT2 in a Peruvian population (n = 395)
| Gene | Metabolizing phenotype a proportion (95% CI) | ||
|---|---|---|---|
| NAT2 | Fast | Intermediate | Slow |
| 0.149 (0.114–0.185) | 0.382 (0.334–0.430) | 0.468 (0.419–0.518) | |
The metabolizing phenotype was determined using the online software http://nat2pred.rit.albany.edu/.
The allelic and genotypic distribution of the rs2031920 (−1053C>T) variant of CYP2E1 among the studied population is shown in Tables 1 and 2, respectively. The results show an allele frequency of ~21% for the CYP2E1 variant, and ~79% for the wild‐type allele. The observed genotype frequency of the homozygous and heterozygotes were ~7% and ~36%, respectively.
We also analyzed the allele and genotype frequency of the rs1803155 SNP of the AADAC gene in the 395 individuals of this study (Tables 1 and 2). According to our results, the AADAC genetic variant has an allele frequency of ~99.9%, while the wild‐type allele was ~20%. The homozygous and heterozygous genotype distribution were ~85% and ~10%, respectively.
4. DISCUSSION
Studies in different populations have shown ethnic variabilities in both NAT2 and CYP2E1 genotypes and phenotypes. There is still limited information about the genetic variations in the Peruvian population. In the current study, we analyzed NAT2, CYP2E1, and AADAC genotypes and allele frequencies in 395 individuals from Peru. As stated above, NAT2 and CYP2E1 are two essential enzymes in the metabolism of INH. Altered NAT2 and/or CYP2E1 activities due to polymorphic genotypes can result in (a) the accumulation of toxic substances in the liver, and (b) variations in INH plasma concentrations that can affect the efficacy of the drug.
In the analysis of the NAT2 gene, the results showed that NAT2*13 (39.7% of alleles) and NAT2*7 (35.6% of alleles) were the most frequent genetic variants amount the population studied. NAT2*13 is a silent mutation, Y94Y, that does not alter the metabolizer phenotype, whereas NAT2*7 results in an amino acid substitution, G286E, that leads to a significant decrease in the enzyme's activity (Lakkakula et al., 2014; Vatsis et al., 1991). The distribution of the NAT2 polymorphisms in the population studied were similar to other American populations in that one of the most frequent alleles was NAT2*5 (Table 4). It is established that the frequency of NAT2*5 in European populations is ~50%, in African populations is ~33% to 42% and in Asian populations is ~5% (Borlak & Reamon‐Buettner, 2006; Cascorbi et al., 1995; Sekine et al., 2001; Tiis et al., 2020). According to our results, the allele frequency of NAT2*5 is ~25%. The other two slow metabolizer alleles are NAT2*6 and NAT2*7. The NAT2*6 is common in all populations mentioned above with a frequency of ~30%. Conversely, the frequency of NAT2*7 is low in European populations (~2%) and African populations (~3% to 6%). In Asian populations, the frequency of NAT2*7 is ~10% to 12% (Tiis et al., 2020). Diverging from these reports, in our studied population the allele frequency of NAT2*6 is ~14% and of NAT2*7 is ~36%. As stated above, reduced NAT2 activity, which is observed in NAT2*7 variants, can lead to adverse drug reactions due to increased accumulation of toxic metabolites. Additionally, our study revealed that the genotype frequency (predicted phenotype) of slow metabolizers is ~47%. The relationship of NAT2 polymorphisms with INH‐induced hepatotoxicity in TB patients among different populations were studied (Azuma et al., 2013; Borlak & Reamon‐Buettner, 2006; Cascorbi et al., 1995; Ganachari et al., 2010; Huerta‐García et al., 2020; Sekine et al., 2001; Tiis et al., 2020; Zahra et al., 2020), but the previously published studies have demonstrated inconsistent results. Therefore, analysis of the slow genotypes should become part of the dosage regimen of INH in TB patients undergoing anti‐TB treatment to prevent drug‐induced liver injuries (Azuma et al., 2013; Ganachari et al., 2010; Huerta‐García et al., 2020; Zahra et al., 2020).
TABLE 4.
Distribution of NAT2 alleles among the Peruvian population studied compared with various human population
| Population | Peru (current study) | Brazil (2016) | Mexico (2012) | Spain (2011) |
|---|---|---|---|---|
| NAT2*4 (Wild‐type) | 0.111 | 0.258 | 0.306 | 0.186 |
| NAT2*13 (C282T) | 0.099 | 0.008 | 0.008 | — |
| NAT2*5 (T341C) | 0.420 | 0.446 | 0.312 | 0.417 |
| NAT2*11 (C481T) | 0.035 | — | — | — |
| NAT2*6 (G590A) | 0.099 | 0.150 | 0.174 | 0.292 |
| NAT2*12 (A803G) | 0.013 | 0.023 | 0.048 | — |
| NAT2*7 (G857A) | 0.223 | 0.096 | 0.140 | 0.106 |
After NAT2 acetylates INH converting it to acetyl‐INH, it can enter the CYP2E1 pathway, which couples with the glutathione‐S‐transferase (GST) metabolic pathway to facilitate the elimination of toxic metabolites (Guio, Levano, Sánchez, et al., ; Singla et al., 2014; Teixeira et al., 2011). Studies have shown that individuals with the CYP2E1 wild‐type allele (c1/c1 genotype) have a higher CYP2E1 activity that those with CYP2E1*5B allele (c1/c2 or c2/c2 genotype). Thus, these individuals can generate more hepatotoxins and therefore increase the risk of drug‐induced liver injuries (Huang et al., 2003; Singla et al., 2014; Vuilleumier et al., 2006). In our studied population, the allele frequency of the CYP2E1*5B is ~79%, which increases the risk of hepatotoxicity specially in patients with a slow metabolizer phenotype for NAT2 (Guaoua et al., 2014; Singla et al., 2014).
An important enzyme in the metabolism of RIF is AADAC catalyzing its deacetylation to 25‐deacetyl‐RIF (Nakajima et al., 2011; Png et al., 2012; Thomas et al., 2020). Polymorphic variations affecting this enzyme's activity can also result in the accumulation of toxic substances and variations in RIF plasma concentrations that can affect the efficacy of this drug. In this study, we analyzed the nonsynonymous SNP rs1803155 (AADAC*2 allele), which leads to a change in amino acid (V281I) in the coding region (Shimizu et al., 2012). An allele frequency of ~60% for AADAC*2 has been reported in European American, African American, Japanese, and Korean populations. In our studied population, the allele frequency of AADAC*2 is ~99.9%. A limitation in this study is the number of SNPs analyzed in each gene, especially in AADAC. The analysis of additional genetic variations in AADAC can provide additional information in the metabolism of RIF. For example, the allele AADAC*3 (g.13651G>A/g.14008T>C), not analyzed in the current study, has shown a reduced metabolizing activity for RIF (Shimizu et al., 2012). Additionally, studies have reported genetic polymorphisms in other RIF metabolizing enzymes, including carboxylesterase 1(CES1) (OMIM # 114835) and carboxylesterase 2 (CES2) (OMIM # 605278) (Sloan et al., 2017), as well as in drug transporters and /or their transcriptional regulators, including SLCO1B1 (OMIM # 604843) (Yang et al., 2019) and ABCB1 (OMIM # 171050) (Pontual et al., 2017).
Countries have begun clinical trials focused on personalization of tuberculosis treatment to reduce the consequences for patients in treatment (Huerta‐García et al., 2020; Yoo et al., 2020). In countries like Peru, where high rates of tuberculosis are recorded and therefore more people in treatment, the pharmacogenomics of individuals becomes a crucial tool for an optimum tuberculosis treatment. This review highlights the importance of having pharmacogenomic studies and having the identification of polymorphisms associated to the metabolism of the antituberculosis drugs in our Peruvian population. Future studies should evaluate adverse effects such as hepatotoxicity and treatment failure.
5. CONCLUSION
In conclusion, our study showed the distribution of NAT2, CYP2E1, and AADAC genetic polymorphisms in a Peruvian population diagnosed with tuberculosis. This is a preliminary study to help understand the genetic basis of metabolizing polymorphisms in our population, and thus contribute to the use of this and future data in determining the safe INH and RIF dose in slow and fast metabolizers and thus minimizing adverse drug reactions. According to our results, ~74% of the participants are carriers of slow metabolizer genotypes: NAT2*5, NAT2*6, and NAT2*7, which increase the sensitivity of INH at low doses and increase the risk of drug‐induced liver injuries. Additionally, ~64% are homozygous for the wild‐type CYP2E1*1A allele, which could increase the risk of hepatotoxicity. This high prevalence of slow metabolizers for isoniazid in the Peruvian population should be further studied and considered to help individualize drug regimens, especially in countries with a great genetic diversity like Peru. However, 16% had a NAT2 fast metabolizer phenotype which could increase the risk of acquiring resistance to INH, thereby increasing the risk of multidrug‐resistant (MDR) or treatment failure. The frequency of rs1803155 (AADAC*2 allele) was higher (99.9%) in Peruvians than in European American, African American, Japanese, and Korean populations. These data will help the Peruvian National Tuberculosis Control Program develop new strategies for therapies, and in addition, these data are of worldwide interest to identify the distribution of genotypes and allelic frequencies related to the enzymes that participate in the metabolism of antituberculosis drugs.
CONFLICT OF INTEREST
The authors declared no conflict of interest.
AUTHOR CONTRIBUTIONS
Study design: LK, TD, SC, VLT, SL, MTA, SA, RC, and GH. Performed the experiments: LK, JVL, TD, CS, and SCR. Analyzed the data: LK, JVL, TD, VLT, and ZCR. Contributed materials/analysis tools: SC, SL, MTA, SA, RC, and GH. All authors have read and approved the final manuscript.
Ethical approval
Our study was approved by the Ethics in Research Committee of the Peruvian National Institute of Health (INS), and written informed consent was obtained from all the participants.
ACKNOWLEDGMENT
The authors are grateful to all the study participants. This work was supported by the Instituto Nacional de Salud, Lima, Perú.
Levano, K. S. , Jaramillo‐Valverde, L. , Tarazona, D. D. , Sanchez, C. , Capristano, S. , Vásquez‐Loarte, T. , Solari, L. , Mendoza‐Ticona, A. , Soto, A. , Rojas, C. , Zegarra‐Chapoñan, R. , & Guio, H. (2021). Allelic and genotypic frequencies of NAT2, CYP2E1, and AADAC genes in a cohort of Peruvian tuberculosis patients. Molecular Genetics & Genomic Medicine, 9, e1764. 10.1002/mgg3.1764
DATA AVAILABILITY STATEMENT
All data generated or analyzed during this study could be obtained from the authors upon reasonable requirements.
REFERENCES
- Azuma, J. , Ohno, M. , Kubota, R. , Yokota, S. , Nagai, T. , Tsuyuguchi, K. , Okuda, Y. , Takashima, T. , Kamimura, S. , Fujio, Y. , & Kawase, I. ; Pharmacogenetics‐based tuberculosis therapy research group . (2013). NAT2 genotype guided regimen reduces isoniazid‐induced liver injury and early treatment failure in the 6‐month four‐drug standard treatment of tuberculosis: A randomized controlled trial for pharmacogenetics‐based therapy. European Journal of Clinical Pharmacology, 69(5), 1091–1101. 10.1007/s00228-012-1429-9 [DOI] [PMC free article] [PubMed] [Google Scholar]
- Bao, Y. , Ma, X. , Rasmussen, T. P. , & Zhong, X.‐B. (2018). Genetic variations associated with anti‐tuberculosis drug‐induced liver injury. Current Pharmacology Reports, 4(3), 171–181. 10.1007/s40495-018-0131-8 [DOI] [PMC free article] [PubMed] [Google Scholar]
- Borlak, J. , & Reamon‐Buettner, S. M. (2006). N‐acetyltransferase 2 (NAT2) gene polymorphisms in colon and lung cancer patients. BMC Medical Genetics, 7, 58. 10.1186/1471-2350-7-58 [DOI] [PMC free article] [PubMed] [Google Scholar]
- Cascorbi, I. , Drakoulis, N. , Brockmoller, J. , Maurer, A. , Sperling, K. , & Roots, I. (1995). Arylamine N‐acetyltransferase (NAT2) mutations and their allelic linkage in unrelated Caucasian individuals: Correlation with phenotypic activity. American Journal of Human Genetics, 57(3), 581–592. [PMC free article] [PubMed] [Google Scholar]
- de Figueiredo Teixeira, R. L. , Pires Lopes, M. Q. , Noel, P. , & Rezende, A. (2013). Tuberculosis pharmacogenetics: State of the art. In Mahboub B. H. & Vats M. G. (Eds.), Tuberculosis – Current issues in diagnosis and management. InTech. 10.5772/54984 [DOI] [Google Scholar]
- Ganachari, M. , Ruiz‐Morales, J. A. , de la Torre, G. , Pretell, J. C. , Dinh, J. , Granados, J. , & Flores‐Villanueva, P. O. (2010). Joint effect of MCP‐1 genotype GG and MMP‐1 genotype 2G/2G increases the likelihood of developing pulmonary tuberculosis in BCG‐vaccinated individuals. PLoS One, 5(1), e8881. 10.1371/journal.pone.0008881 [DOI] [PMC free article] [PubMed] [Google Scholar]
- Guaoua, S. , Ratbi, I. , Laarabi, F. Z. , Elalaoui, S. C. , Jaouad, I. C. , Barkat, A. , & Sefiani, A. (2014). Distribution of allelic and genotypic frequencies of NAT2 and CYP2E1 variants in Moroccan population. BMC Genetics, 15(1), 10.1186/s12863-014-0156-x [DOI] [PMC free article] [PubMed] [Google Scholar]
- Guio, H. , Levano, K. S. , Sanchez, C. , & Tarazona, D. (2015). The role of pharmacogenomics in the tuberculosis treatment regime. Revista Peruana De Medicina Experimental Y Salud Pública, 32(4), 794–800. [PubMed] [Google Scholar]
- Hein, D. W. , Doll, M. A. , Fretland, A. J. , Leff, M. A. , Webb, S. J. , Xiao, G. H. , Devanaboyina, U. S. , Nangju, N. A. , & Feng, Y. (2000). Molecular genetics and epidemiology of the NAT1 and NAT2 acetylation polymorphisms. Cancer Epidemiology, Biomarkers & Prevention, 9(1), 29–42. http://www.ncbi.nlm.nih.gov/pubmed/10667461 [PubMed] [Google Scholar]
- Huang, Y. S. , Chern, H. D. , Su, W. J. , Wu, J. C. , Chang, S. C. , Chiang, C. H. , Chang, F. Y. , & Lee, S. D. (2003). Cytochrome P450 2E1 genotype and the susceptibility to antituberculosis drug‐induced hepatitis. Hepatology, 37(4), 924–930. 10.1053/jhep.2003.50144 [DOI] [PubMed] [Google Scholar]
- Huerta‐García, A. P. , Medellín‐Garibay, S. E. , Ortiz‐Álvarez, A. , Magaña‐Aquino, M. , Rodríguez‐Pinal, C. J. , Portales‐Pérez, D. P. , Romano‐Moreno, S. , & Milán‐Segovia, R. D. C. (2020). Population pharmacokinetics of isoniazid and dose recommendations in Mexican patients with tuberculosis. International Journal of Clinical Pharmacy, 42(4), 1217–1226. 10.1007/s11096-020-01086-1 [DOI] [PubMed] [Google Scholar]
- Kuznetsov, I. B. , Mcduffie, M. , & Moslehi, R. (2009). A web server for inferring the human N‐acetyltransferase‐2 (NAT2) enzymatic phenotype from NAT2 genotype. Bioinformatics Applications Note, 25(9), 1185–1186. 10.1093/bioinformatics/btp121 [DOI] [PMC free article] [PubMed] [Google Scholar]
- Lakkakula, S. , Pathapati, R. M. , Chaubey, G. , Munirajan, A. K. , Lakkakula, B. V. K. S. , & Maram, R. (2014). NAT2 genetic variations among South Indian populations. Human Genome Variation, 1(1), 1. 10.1038/hgv.2014.14 [DOI] [PMC free article] [PubMed] [Google Scholar]
- Lee, M.‐R. , Huang, H.‐L. , Lin, S.‐W. , Cheng, M.‐H. , Lin, Y.‐T. , Chang, S.‐Y. , Yan, B.‐S. , Kuo, C.‐H. , Lu, P.‐L. , Wang, J.‐Y. , & Chong, I.‐W. (2019). Isoniazid concentration and NAT2 genotype predict risk of systemic drug reactions during 3HP for LTBI. Journal of Clinical Medicine, 8(6), 812. 10.3390/jcm8060812 [DOI] [PMC free article] [PubMed] [Google Scholar]
- Motta, I. , Calcagno, A. , & Bonora, S. (2018). Pharmacokinetics and pharmacogenetics of anti‐tubercular drugs: a tool for treatment optimization? Expert Opinion on Drug Metabolism & Toxicology, 14(1), 59–82. 10.1080/17425255.2018.1416093 [DOI] [PubMed] [Google Scholar]
- Nakajima, A. , Fukami, T. , Kobayashi, Y. , Watanabe, A. , Nakajima, M. , & Yokoi, T. (2011). Human arylacetamide deacetylase is responsible for deacetylation of rifamycins: Rifampicin, rifabutin, and rifapentine. Biochemical Pharmacology, 82(11), 1747–1756. 10.1016/j.bcp.2011.08.003 [DOI] [PubMed] [Google Scholar]
- Png, E. , Alisjahbana, B. , Sahiratmadja, E. , Marzuki, S. , Nelwan, R. , Balabanova, Y. , Nikolayevskyy, V. , Drobniewski, F. , Nejentsev, S. , Adnan, I. , van de Vosse, E. , Hibberd, M. L. , van Crevel, R. , Ottenhoff, T. H. M. , & Seielstad, M. (2012). A genome wide association study of pulmonary tuberculosis susceptibility in Indonesians. BMC Medical Genetics, 13, 5. 10.1186/1471-2350-13-5 [DOI] [PMC free article] [PubMed] [Google Scholar]
- Pontual, Y. , Pacheco, V. S. S. , Monteiro, S. P. , Quintana, M. S. B. , Costa, M. J. M. , Rolla, V. C. , & de Castro, L. (2017). ABCB1 gene polymorphism associated with clinical factors can predict drug‐resistant tuberculosis. Clinical Science, 131(15), 1831–1840. 10.1042/CS20170277 [DOI] [PubMed] [Google Scholar]
- Sabbagh, A. , Darlu, P. , & Vidaud, M. (2009). Evaluating NAT2PRED for inferring the individual acetylation status from unphased genotype data. BMC Medical Genetics, 10(148), 10.1186/1471-2350-10-148 [DOI] [PMC free article] [PubMed] [Google Scholar]
- Sekine, A. , Saito, S. , Iida, A. , Mitsunobu, Y. , Higuchi, S. , Harigae, S. , & Nakamura, Y. (2001). Identification of single‐nucleotide polymorphisms (SNPs) of human N‐acetyltransferase genes NAT1, NAT2, AANAT, ARD1, and L1CAM in the Japanese population. Journal of Human Genetics, 46(6), 314–319. 10.1007/s100380170065 [DOI] [PubMed] [Google Scholar]
- Shimizu, M. , Fukami, T. , Kobayashi, Y. , Takamiya, M. , Aoki, Y. , Nakajima, M. , & Yokoi, T. (2012). A novel polymorphic allele of human arylacetamide deacetylase leads to decreased enzyme activity. Drug Metabolism and Disposition, 40(6), 1183–1190. 10.1124/dmd.112.044883 [DOI] [PubMed] [Google Scholar]
- Singla, N. , Gupta, D. , Birbian, N. , & Singh, J. (2014). Association of NAT2, GST and CYP2E1 polymorphisms and anti‐tuberculosis drug‐induced hepatotoxicity. Tuberculosis (Edinb), 94(3), 293–298. 10.1016/j.tube.2014.02.003 [DOI] [PubMed] [Google Scholar]
- Sloan, D. J. , McCallum, A. D. , Schipani, A. , Egan, D. , Mwandumba, H. C. , Ward, S. A. , Waterhouse, D. , Banda, G. , Allain, T. J. , Owen, A. , Khoo, S. H. , & Davies, G. R. (2017). Genetic determinants of the pharmacokinetic variability of rifampin in Malawian adults with pulmonary tuberculosis. Antimicrobial Agents and Chemotherapy, 61(7). e00210‐17. 10.1128/AAC.00210-17 [DOI] [PMC free article] [PubMed] [Google Scholar]
- Sotsuka, T. , Sasaki, Y. , Hirai, S. , Yamagishi, F. , & Ueno, K. (2011). Association of isoniazid‐metabolizing enzyme genotypes and isoniazid‐induced hepatotoxicity in tuberculosis patients. Vivo, 25(5), 803–812. [PubMed] [Google Scholar]
- Teixeira, R. L. D. F. , Morato, R. G. , Cabello, P. H. , Muniz, L. M. K. , Moreira, A. D. S. R. , Kritski, A. L. , Mello, F. C. Q. , Suffys, P. N. , Miranda, A. B. D. , & Santos, A. R. (2011). Genetic polymorphisms of NAT2, CYP2E1 and GST enzymes and the occurrence of antituberculosis drug‐induced hepatitis in Brazilian TB patients. Memorias do Instituto Oswaldo Cruz, 106(6), 716–724. 10.1590/s0074-02762011000600011 [DOI] [PubMed] [Google Scholar]
- Thomas, L. , Miraj, S. S. , Surulivelrajan, M. , Varma, M. , Sanju, C. S. V. , & Rao, M. (2020). Influence of single nucleotide polymorphisms on rifampin pharmacokinetics in tuberculosis patients. Antibiotics, 9(6), 1–15. 10.3390/antibiotics9060307 [DOI] [PMC free article] [PubMed] [Google Scholar]
- Tiis, R. P. , Osipova, L. P. , Lichman, D. V. , Voronina, E. N. , & Filipenko, M. L. (2020). Studying polymorphic variants of the NAT2 gene (NAT2*5 and NAT2*7) in Nenets populations of Northern Siberia. BMC Genetics, 21(Suppl 1), 115. 10.1186/s12863-020-00909-4 [DOI] [PMC free article] [PubMed] [Google Scholar]
- Vatsis, K. P. , Martell, K. J. , & Weber, W. W. (1991). Diverse point mutations in the human gene for polymorphic N‐acetyltransferase. Proceedings of the National Academy of Sciences of the United States of America, 88(14), 6333–6337. 10.1073/pnas.88.14.6333 [DOI] [PMC free article] [PubMed] [Google Scholar]
- Vuilleumier, N. , Rossier, M. F. , Chiappe, A. , Degoumois, F. , Dayer, P. , Mermillod, B. , Nicod, L. , Desmeules, J. , & Hochstrasser, D. (2006). CYP2E1 genotype and isoniazid‐induced hepatotoxicity in patients treated for latent tuberculosis. European Journal of Clinical Pharmacology, 62(6), 423–429. 10.1007/s00228-006-0111-5 [DOI] [PubMed] [Google Scholar]
- WHO | Global tuberculosis report 2019. (2020). WHO.
- Yang, S. , Hwang, S. J. , Park, J. Y. , Chung, E. K. , & Lee, J. I. (2019). Association of genetic polymorphisms of CYP2E1, NAT2, GST and SLCO1B1 with the risk of anti‐tuberculosis drug‐induced liver injury: A systematic review and meta‐analysis. British Medical Journal Open. BMJ Publishing Group. 9(8), e027940. 10.1136/bmjopen-2018-027940 [DOI] [PMC free article] [PubMed] [Google Scholar]
- Yoo, H. , Chun Ji, S. , Cho, J.‐Y. , Kim, S.‐H. , Yoon, J. G. , Goo Lee, M. , Yu, K.‐S. , Jang, I.‐J. , & Oh, J. (2020). A pilot study to investigate the utility of NAT2 genotype‐guided isoniazid monotherapy regimens in NAT2 slow acetylators. Pharmacogenetics and Genomics. 31(3), 68–73. 10.1097/fpc.0000000000000423 [DOI] [PubMed] [Google Scholar]
- Zahra, M. A. , Kandeel, M. , Aldossary, S. A. , & Al‐Taher, A. (2020). Study on genotyping polymorphism and sequencing of N‐acetyltransferase 2 (NAT2) among Al‐Ahsa population. BioMed Research International, 2020(3), 1–9. 10.1155/2020/876534 [DOI] [PMC free article] [PubMed] [Google Scholar]
Associated Data
This section collects any data citations, data availability statements, or supplementary materials included in this article.
Data Availability Statement
All data generated or analyzed during this study could be obtained from the authors upon reasonable requirements.