Abstract
We employ distinct exploratory procedures to improve our perceptual judgments of an object’s properties. For instance, with respect to compliance, we exert pressure against a resisting force. The present work investigates ties between strategies for active control of the finger and resultant cues by which compliances may be discriminated. In particular, we employ elastic spheres that co-vary in compliance and radius, as these generate non-differentiable contact areas and are discriminable only in active touch with proprioceptive inputs. During human-subjects psychophysical experiments, we measure touch force, fingertip displacement, and joint kinematics. Two active touch paradigms are used, with and without a force constraint. First, in behaviorally-controlled situations that make force cues non-useful, the results indicate that participants can employ a force-matching strategy between the compliant objects and rely upon displacement-related cues to differentiate them. We show these cues are directly tied to a proprioception mechanism, specifically, the angle of the MCP joint. However, in the fully active paradigm, participants control displacements instead and discriminate via force-related cues. Similar to prior findings in passive touch, we find that force-related cues, likewise, are used in active touch for the optimal and efficient discrimination of compliant objects.
I. Introduction
We volitionally employ certain active exploratory procedures to facilitate the discrimination of compliance [1]-[3], as we do for haptic dimensions of temperature, volume, surface texture, etc. With respect to compliance, we tend to exert pressure against a resisting force. In the process, our somatosensory system recruits, processes, and converges a multimodal array of signals, including cues from our cutaneous and proprioceptive systems [4]. Superior performance is achieved by some combination of active movements that evoke the most optimal and efficient perceptual cues. To design tactile displays that render compliance [5], [6], research is needed to tease apart the cues which best convey an object’s mechanical properties. In particular, we need to understand the number of cues, their transformations from physical to perceptual space, and whether they are perceptually integral or separable.
The precise cues that drive our discrimination of compliance have yet to be resolved. One paradigm is that we rely upon cues of cutaneous contact as a function of force [5]-[7]. Spatial contact information is typically referred to by measures of contact area, spatial distributions of pressure within the contact region, and deformation of the skin surface [8], [9]. Such cues are all associated with the deformation of the skin and therefore are cutaneous. However, a couple of recent studies indicate that contact area alone may not convey compliance. In particular, using combinations of spheres that are of large diameter and stiff versus small diameter and compliant, both computational modeling and human-subjects psychophysical evaluation show that these stimuli generate similar contact areas, and cannot be differentiated in passive touch where only cutaneous cues are available [10], [11]. However, the stimuli are readily discriminable when touched under one’s own volition.
Indeed, to augment our judgments of compliance, our proprioceptive system provides vital input [12]-[14]. The rotation about the metacarpophalangeal (MCP) joint is considered to reliably encode finger penetration into compliant objects and help fine-tune our sensorimotor control of movements [13], [15]. That said, exactly how we modulate our exploratory motions to obtain optimal perceptual cues remains unclear. We do know that people tend to apply higher forces as a robust strategy to obtain higher differential sensitivity. They also tend to utilize steeper finger angles against the stimulus surface when discriminating harder objects [3], [16]. On the other hand, evoking cues of a time-dependent nature may aid efficiency and fidelity. In passive touch, the availability of force-rate cues, as opposed to velocity cues, can more efficiently encode compliance by requiring less deformation into an object [17]. While this is the case for passive touch, it is unclear if people actually employ such volitional control strategies.
In summary, we do not yet understand the optimal combination of exploration strategies for active control of the finger and the resultant cues by which compliances may be discriminated. As a step toward that goal, the objective of this work is to clarify the roles of force-related cues and joint proprioception by employing the aforementioned diameter-stiffness illusion stimuli, which are only discriminable via active touch, and therefore require both cutaneous and proprioceptive inputs.
II. Methods
Three compliant, spherical stimuli that co-vary in compliance and radius were employed in human-subjects experiments. Developed and evaluated in prior work [10], [11], these stimuli generate similar contact areas upon finger contact and are discriminable only in active touch. Using these stimuli ensures that both cutaneous and proprioceptive cues serve as input to a participant’s evaluation of compliance. First, to determine how one’s finger movements might encode compliance absent force cues, we employed a constrained-active paradigm where participants touched stimuli up to a commanded force level. Thereby, force cues were controlled and participants would have to rely on fingertip displacement and proprioceptive joint angles to differentiate compliance. Second, a fully-active paradigm was used to determine if participants indeed volitionally employed force-related cues in differentiating the compliances. In both sets of experiments, the exerted force, fingertip displacement, and joint kinematics were monitored. Finally, a follow-up experiment was conducted with stimuli of the same compliance with different radius. This was done to determine if participants would utilize the same exploration strategy to differentiate radius as opposed to compliance.
A. Experimental Apparatus and Stimuli
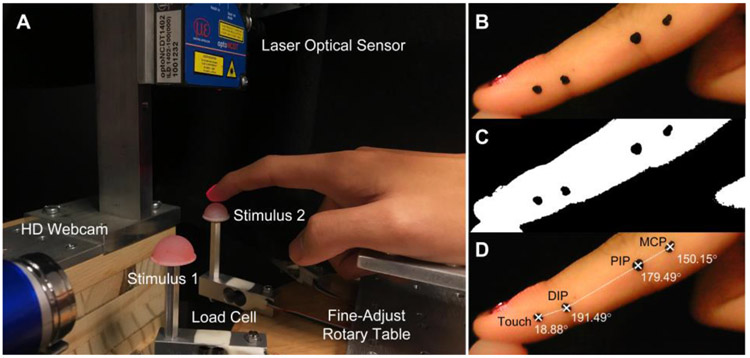
An experimental platform was built for the table grounded condition where one finger actively explores and interacts with the presented object, Fig. 1. A load cell per stimulus (5 kg, HTC Sensor TAL220, Colorado USA) was mounted on a fine-adjust rotary table (from a milling machine) that can be rapidly rotated into position to present the designated stimulus. The participant’s forearm, wrist, and base of palm rest freely on a beam which is parallel to the table surface. To monitor the position of participant’s fingertip, a non-contact laser displacement sensor (1-micron resolution, optoNCDT ILD 1402-100, Micro-Epsilon, Raleigh, NC USA) was mounted downwards on the beam fixture and the laser beam was calibrated to point towards the central surface of the spherical stimulus. To the side of the participant’s hand, and down its shaft, a high-definition web camera (720P, 30FPS, YoLuke A860, Shenzhen China) was mounted to record movements of joints of the index finger.
Figure 1.
Experimental setup for monitoring finger movement and force into the spherical stimuli and joint angles of finger digits. A) In the active touch setup, load cells are mounted on a turntable that can be rapidly rotated to present designated stimuli. The vertical position of the participant’s nail is monitored by a laser sensor and movements of finger digits are tracked by a web camera mounted horizontally. B) One image frame selected from snapshots captured by the webcam, cropped for processing efficiency. The laser beam is visible at the nail surface. C) The image frame is color thresholded into a binary image according to the HSV colormap. D) Target finger digit joints are identified and joint angles calculated based on relative position.
The compliant stimuli were made of a room temperature curing silicone elastomer (BJB Enterprises, Tustin, CA; TC-5005 A/B/C). Corresponding percentages of cross-linker were added based on the desired modulus [18]. These formulations were cast into 3D printed molds of varied radii to become stimulus tips. Following prior computational modeling and psychophysical evaluation [10], [11], three stimuli that generate similar contact areas were determined and prepared. The elasticity-radius specifications were 10 kPa – 4 mm, 90 kPa – 6 mm, and 90 kPa – 8 mm.
B. Measurement of Displacement and Stimulus-rate
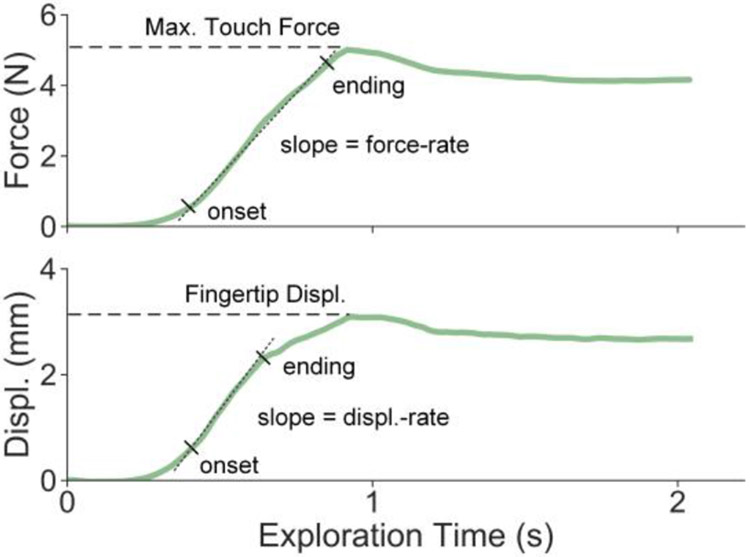
As illustrated in Fig. 1B, the emitted laser beam was pointed at the surface of the participant’s fingernail. Black nail polish was fully applied to avoid any light penetration. Fingertip displacement (Fig. 2) was calculated by the absolute difference between initial movement and peak distance that were both averaged over a window of 100 neighboring values.
Figure 2.
Example traces of touch force and displacement. Maximum force is defined at the peak. Fingertip displacement is defined as the relative displacement between initial movement and peak distance. The same linear regression is applied to the segmented curve from onset to ending to obtain the rate of change of force and displacement, defined as force-rate and displacement-rate respectively.
To calculate the force-rate and displacement-rate, a moving average filter was first applied to remove any electrical artifacts in readings. A segmentation procedure based on first-order approximate derivatives was then applied to the filtered data, Fig. 2. Ramp onset was defined at the first time when the derivative crossed 40% of peak value. Ramp ending was defined when the derivative passed 70% of the peak and dropped below 30% of the peak for the first time [19]. A least-squares linear regression was applied to this segmented trace and the stimulus-rate was set as the slope.
C. Measurement of Finger Joint Angle
A marker-based approach was applied to track finger digits and measure joint angles. As illustrated in Fig. 1B, surface markers were drawn along the side of the participant's index phalangeal, indicating actual positions of the distal interphalangeal (DIP) joint and the proximal interphalangeal joint (PIP). Two additional markers at the right and left helped align the distal and proximal phalanges. During experimental trials, movements of the index finger were captured by the monocular camera at 30 frames per second. Videos were then extracted and processed offline to calculate joint angles. After all frames were color thresholded into binary images based on the HSV colormap, connected pixel components within a marker point were identified and the centroid pixel was considered as the corresponding joint’s origin. Finally, all of the flexion-extension angles were calculated based on the relative positions of DIP, PIP, and MCP joints. As in Fig. 1D, the touch angle was calculated as the pitch angle between distal phalanges and the horizontal axis. Meanwhile, the MCP angle was the angle between proximal phalanges and the horizontal axis.
D. Data Normalization
To aggregate and analyze results among all participants, a data normalization procedure based on sigmoidal membership function was applied to normalize individual recordings to the range of (0,1). The value of sigmoid midpoint was set to be the average of raw data that need to be normalized and the slope of the sigmoid function was set as 1.
E. Participants
The human-subjects experiments were approved by the Institutional Review Board at the University of Virginia. In total, four subjects were recruited to participate in this study (2 females, 2 males, mean age = 27.0, SD = 1.83). Following the Edinburgh-handedness inventory, all participants exhibited right-handed dominance [20]. No chronic history or evidence of upper extremity pathology were reported. After obtaining informed consent, all participants continued to complete all experiments and no data were discarded.
F. Experimental Procedure
Experiment 1: Biomechanical experiment with controlled touch force:
To determine which biomechanical cues might be utilized besides contact area and those force-related, experiments were designed in constrained-active touch mode where discrete touch force levels (2, 3, 4, and 6 N) were predefined and behaviorally controlled. In particular, participants were instructed to actively explore a presented stimulus by pressing their index finger down into the center of the spherical surface. A sound alarm was triggered when peak force reached the designated force level, indicating the end of the trial. Participants could only touch the stimulus once per trial. The imposed touch force, fingertip displacement, and index finger movement were recorded simultaneously. There were 25 trials for each stimulus at each force level per each participant, for a total of 1200 trials. All sets of 25 trials were separated by a 5-minute break. The duration of a trial was not constrained but based on the data recordings, within one participant, exploration time for all the trials was consistently around 2 - 3 seconds in average.
Experiment 2: Psychophysical experiment in fully active touch:
Using a same-different procedure, psychophysical discrimination of three pairs of the three stimuli was conducted in active touch with no external constraints. Each trial consisted of the presentation of one of the two stimuli in a one pair. Participants were blindfolded to restrict visual information about the stimuli and their finger movements. After palpating both stimuli the pair (one touch per stimulus), participants reported whether their compliance was the same or different. Each participant completed a total of 36 trials, 12 trials for each stimulus pair which includes one set of 8 trials where two different stimuli were presented, and another set of 4 trials where the same stimulus was presented twice. These two sets were randomized and grouped together. For the particular pair of 90 kPa - 8 mm and 90 kPa – 6 mm, it was not appropriate to use aforementioned psychophysical questions since their compliances are identical. The question on compliance would inevitably pose certain presupposition to the participants and decouple the perception of compliance and stimulus size. To eliminate any of those effects in the later psychophysical experiments, and evaluate strategies and cues for the stimuli pair that varied in radius only, two participants conducted another follow-up experiment with only this hard-hard pair (1 female, age 25, 1 male, age 29). The procedure was the same but the psychophysical question was different. Participants were asked to report whether the two stimuli were the same or different on each trial.
III. Results
A. Biomechanical Experiment with Controlled Touch Force
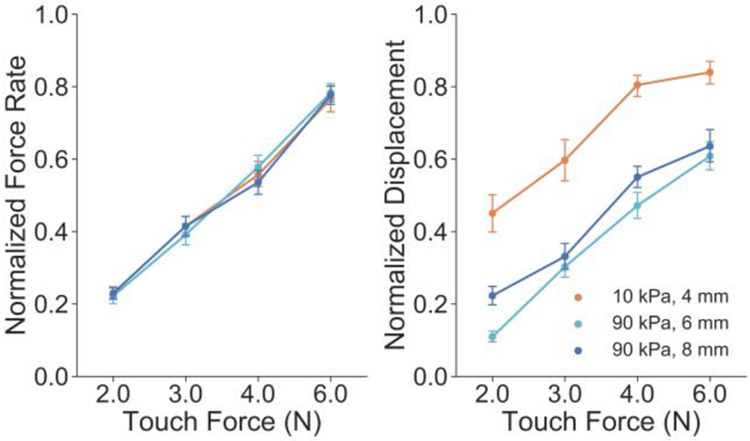
Biomechanical relationships of force-rate and fingertip displacement for the three stimuli were measured at the four behaviorally-constrained force levels, Fig. 3. Force-rate traces for the three stimuli well overlapped across all force levels, indicating that participants could not rely upon force-rate cues in differentiating those three stimuli. Also, force-rate changed in tandem with a force target regardless of stimulus compliance. In Fig. 3, displacements were well separated between soft and hard stimuli.
Figure 3.
Normalized biomechanical relationships of touch force, force-rate, and displacement for the three stimuli recorded in constrained-active touch. Left: Force-rate and maximum force relationship aggregated for all four participants. Right: Displacement and touch force relationship aggregated for all four participants. Error bars denote 95% confidence intervals.
B. Finger Joint Proprioception in Controlled Active Touch
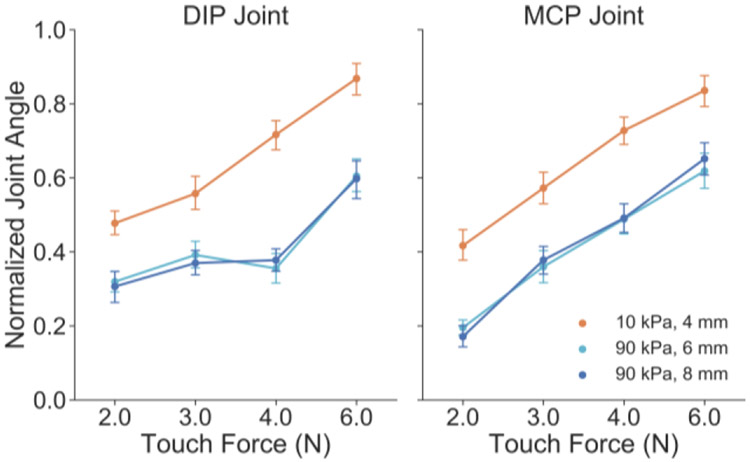
Biomechanical relationships of finger joint angle and touch force for the three stimuli were measured at the four force levels, Fig. 4. The DIP angles measured for the softer stimulus are clearly separate from the two harder stimuli. In Fig. 4, the MCP angles measured for the two harder stimuli overlapped yet these are well separated from the softer stimulus. Participants tend to apply greater joint angles for the softer stimulus, under higher force level. The trends in joint angles are aligned with displacement traces reported in Fig. 3.
Figure 4.
Normalized joint angles for the three stimuli recorded in constrained-active touch. Left: Force-DIP angle relationship aggregated for all participants. Right: Force-MCP angle relationship aggregated for all participants. Error bars denote 95% confidence intervals.
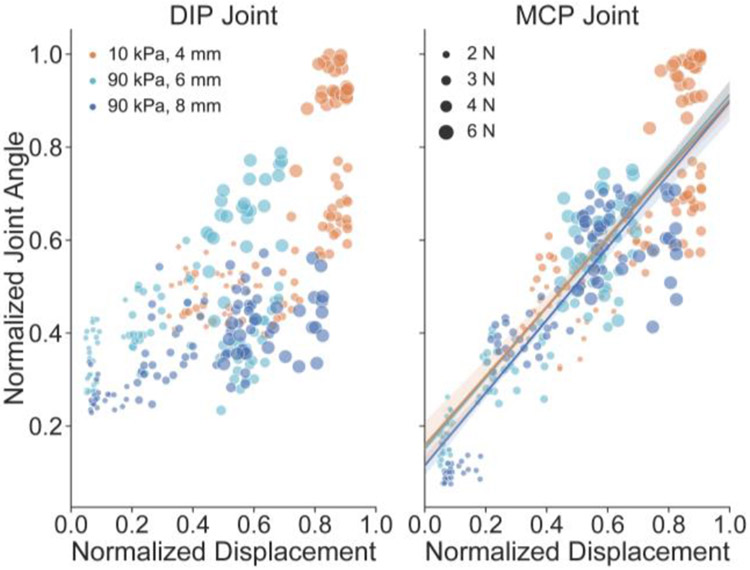
To determine the quantitative relation between fingertip displacement and joint angle, a linear regression was applied for one example participant’s data. In Fig. 5, the Spearman’s rank correlation coefficient yields linear correlations of 0.82 (p = 2.74e-25), 0.90 (p = 9.13e-38), and 0.86 (p = 1.03e-29) for the three stimuli (10 kPa, 4 mm), (90 kPa, 6 mm), and (90 kPa, 8 mm), respectively. Meanwhile, Fig 5, a positive correlation between DIP angle and fingertip displacement was also reported. These relationships indicate that these proprioceptive joint angles indeed correlate with fingertip displacements, especially at the level of MCP joint. Participants tend to utilize proprioceptive cues of this nature when force-related cues are controlled to be non-distinct.
Figure 5.
Normalized relationship of finger joint angle and fingertip displacement for three illusion stimuli presented in constrained-active experiments. Point size is varied indicating the maximum touch force. Left: Displacement-DIP angle relationship for one example participant. Right: Displacement-MCP angle relationship for one example participant. Linear regression is applied to visualize the correlation. Translucent bands around the regression line denote 90% confidence intervals for the regression estimate.
C. Biomechanical Cues Measured in Fully Active Touch
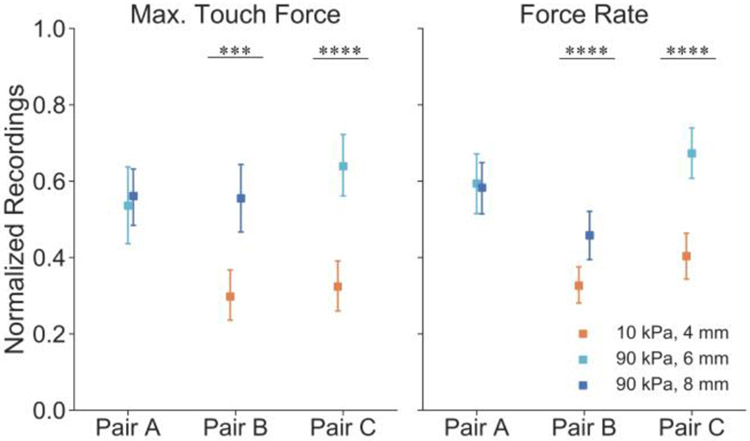
Participants’ maximum touch force and force-rate are presented for the pairs of stimuli in Fig. 6. Maximum force cues were significantly different for both soft-hard pairs, as opposed to the hard-hard pair. Participants tended to apply higher forces when exploring harder objects as compared to softer ones, as noted in prior work [16]. In Fig. 6, force-rate cues were also significantly different for both soft-hard pairs, as opposed to the hard-hard pair.
Figure 6.
Normalized recordings for three stimulus pairs presented in fully-active experiments. Left: Normalized maximum touch force for all participants aggregated. Right: Normalized force-rate for all participants aggregated. Error bars denote 95% confidence intervals. ***significance and ****significance is denoted at p < .001 and p < .0001 by the Mann-Whitney U Test.
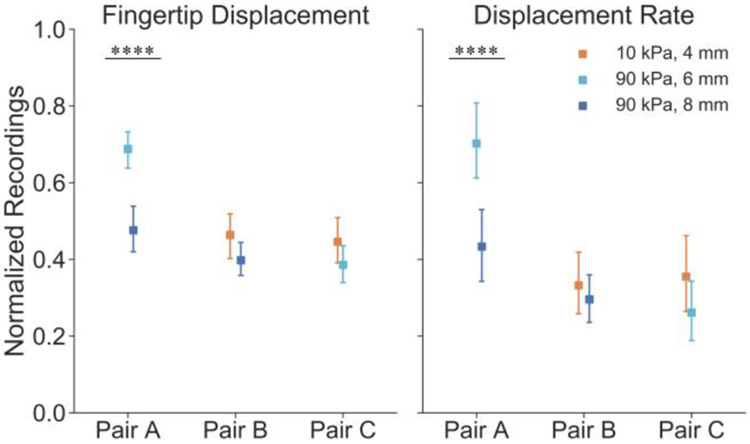
Fingertip displacement and displacement-rate cues likewise are presented for the pairs of stimuli in Fig. 7. Participants applied significantly different fingertip displacement and displacement-rate in discriminating the hard-hard pair, as opposed to the soft-hard. The participants appeared therefore to use a different strategy in discriminating radius as opposed to discriminating compliance. Additionally, greater displacement-related cues were applied for the 90 kPa - 6 mm stimulus as compared to the 8 mm stimulus. However, in Experiment 1 at the 2 N force level, participants tended to apply a lesser displacement for the 90 kPa - 6 mm stimulus. Note that this difference results from distinct active touch conditions between these two experiments, where touch force was constrained in Experiment 1.
Figure 7.
Normalized recordings for three stimulus pairs presented in fully-active experiments. Left: Normalized fingertip displacement for all four participants aggregated. Right: Normalized displacement-rate for all four participants aggregated. Error bars denote 95% confidence intervals. The ****significance is denoted at p < .0001 by the Mann-Whitney U Test.
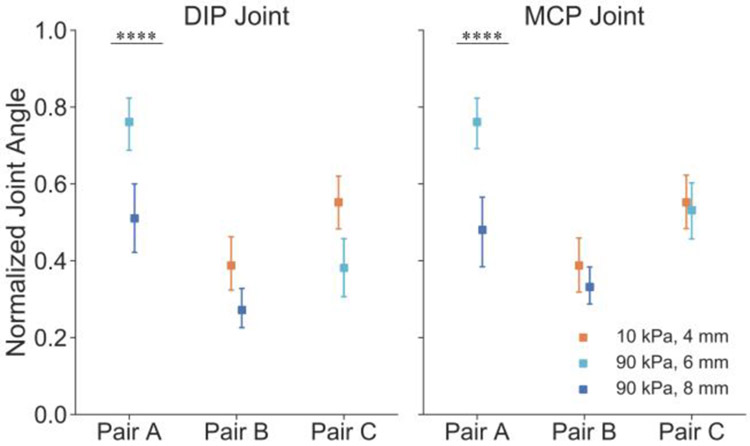
Furthermore, finger joint angles were measured for each stimulus pair, Fig. 8. This was done to follow upon the positive correlation in Fig. 5 in the constrained active touch experiment between displacement of the finger and joint angle. Indeed in Fig. 8, significant differences are observed for both the DIP and MCP joints for the stimulus pair that varied only in radius, not compliance (90 kPa, 8 mm) – (90 kPa, 6 mm). In contrast, for soft-hard pairs where there is no difference in displacement observed in Fig. 7, there is no difference in joint angle in Fig. 8. Therefore, finger joint proprioception correlates well with finger displacement in the case of fully active touch and can distinguish stimuli with the same compliance but different radius (Pair A).
Figure 8.
Normalized finger joint angles for three stimulus pairs presented in fully-active experiments. Left: Normalized DIP joint angles for all four participants aggregated. Right: Normalized MCP joint angles for all four participants aggregated. Error bars denote 95% confidence intervals. The ****significance is denoted at p < .0001 by the Mann-Whitney U Test.
D. Psychophysical Discrimination of Illusion Stimuli
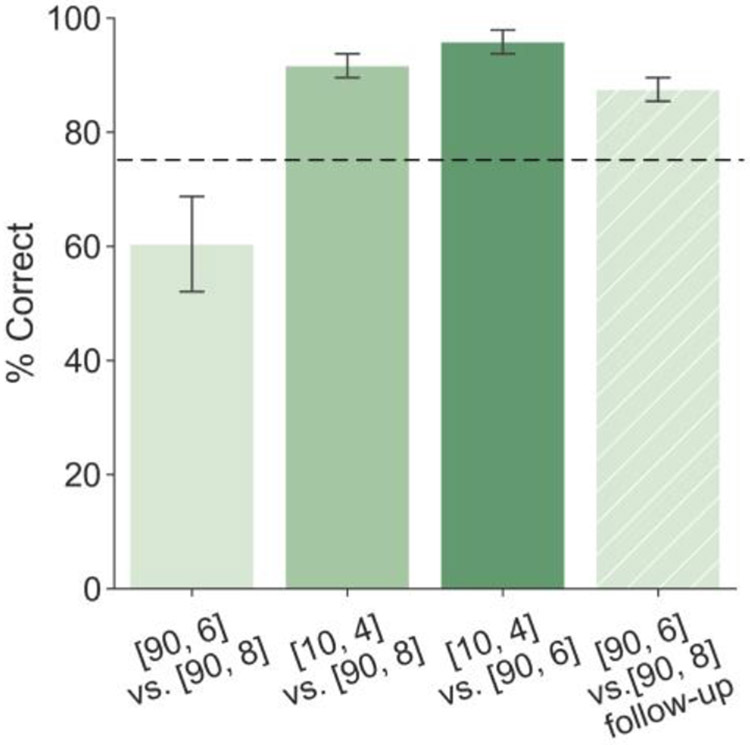
In the fully active discrimination experiments, participants were able to differentiate the soft-hard stimulus pairs by employing force-rate cues with a threshold detection rate of 91.7% for pair B, and 95.8% for pair C, Fig. 9. For the (90 kPa, 8 mm) – (90 kPa, 6 mm) pair, where force-rate cues were non-distinct, participants were not successful at a detection rate of 60.4%. This is the most difficult stimulus pair where only the radius of curvature changes, not compliance. However, in the follow-up discrimination experiments, when the presupposition of stimulus compliance was eliminated, two participants were able to differentiate this pair solely utilizing joint proprioceptive cues, with the detection rate of 83.3% and 91.7% respectively.
Figure 9.
Psychophysical discrimination in the fully-active experiments. Note that [90, 6] is the abbreviated form of 90 kPa, 6 mm radius. The same three stimulus pairs are presented as in Fig. 5. Also note that only two participants were enrolled in the follow-up experiments (rightmost bar). Error bars denote 90% confidence intervals. Discrimination threshold of 75% is illustrated by the dashed line.
IV. Discussion
This work investigates strategies for active control of the finger and their role in evoking physical cues from which we derive our ability to discriminate compliant objects. Overall, we find that in employing exploratory motions to discriminate compliance, participants tend to volitionally match their finger displacements between soft-hard compliant pairs in order to generate discriminable force-related cues. In particular, when contact area cues are non-differentiable, higher maximum forces and higher force-rate cues are applied when exploring harder objects as compared to softer ones, as in line with prior work discriminating non-illusory compliant objects [16], [17]. Similar to prior findings in passive touch with contact area cues available, force cues are indeed used volitionally for the optimal and efficient discrimination of flat compliant objects.
In addition to the optimal force cues, supplementary cues from finger movement may also be utilized to augment discrimination. Our findings from the first experiment indicate that participants tend to apply higher fingertip displacement with the softer stimulus when force-related cues are controlled to be non-differentiable, as in Fig. 3. Note that displacements for the two harder stimuli are relatively close and the comparison between these two could converge to be more significant and conclusive if more samples are included in future experiments. Furthermore, proprioception at the level of joint digit angles indeed correlates with those fingertip displacements. Specifically, a linear correlation between fingertip displacement and MCP joint are reported, as in Fig. 5. This finding indicates that proprioceptive joint angles can reliably encode compliance, in line with prior work demonstrating that participants tend to actively adjust their joint angles in discriminating stimuli with flat surfaces that vary only in compliance [16].
In formulating optimal exploratory strategies, the participants adapted their volitional movements to improve discrimination performance. In particular, when exploring soft-hard compliant pairs, participants tend to control their proprioceptive/displacement cues to be the same, in order to rely more on force-related cues, as illustrated in the results for pair B, C in Figs. 6 and 7. However, when differentiating stimuli with same compliance but varied radius (pair A), participants actively change their exploration strategy. They tend to utilize proprioceptive cues – of fingertip displacement and joint angle – by matching force cues and cutaneous contact between the compliant objects. This volitional adaptation of exploratory strategies, as observed in the discrimination task, suggests that the integration of physical cues is fine-tuned to achieve optimal performance. If such optimization requires a high cost to work load or movement, participants tend to adjust their movement parameters in ways regarding this trade-off. Specifically, participants only require minimal finger movements to generate sufficient force cues in discriminating the soft-hard pairs, as compared to the additional movement effort required for discriminating the hard-hard pair.
Furthermore, a change in cutaneous contact may induce relative volitional movements and people may interpret this as a cue to proprioception. Prior work indicates that the change in contact area may alter the perception of finger displacement [14]. Meanwhile, information by cutaneous mechanoreceptors, such as skin stretch, muscle contraction, and external vibration could also induce the sensation of body movement, which contributes as an alternative source for proprioception [14], [21]. In general, prior work has indicated that the change of physical cues, such as skin deformation, surface penetration, is highly correlated with our perception of compliance [17], [22]. A next step might consider using continuous imaging methods to capture both the contact deformation at finger pad and angular motion at finger joint to elucidate the contribution of cutaneous contact in evoking proprioceptive cues.
Acknowledgment
This work was supported in part by a grant from the National Institutes of Health (NINDS R01NS105241). The content is solely the responsibility of the authors and does not necessarily represent the official views of the NIH.
References
- [1].Lederman SJ and Klatzky RL, “Hand movements: A window into haptic object recognition,” Cogn. Psychol, vol. 19, no. 3, pp. 342–368, Jul. 1987. [DOI] [PubMed] [Google Scholar]
- [2].Tan HZ, Durlach NI, Beauregard GL, and Srinivasan MA, “Manual discrimination of compliance using active pinch grasp: The roles of force and work cues,” Percept. Psychophys, vol. 57, no. 4, pp. 495–510, Jun. 1995. [DOI] [PubMed] [Google Scholar]
- [3].Lezkan A, Metzger A, and Drewing K, “Active Haptic Exploration of Softness: Indentation Force Is Systematically Related to Prediction, Sensation and Motivation,” Front. Integr. Neurosci, vol. 12, p. 59, Nov. 2018. [DOI] [PMC free article] [PubMed] [Google Scholar]
- [4].Kim SS, Gomez-Ramirez M, Thakur PH, and Hsiao SS, “Multimodal Interactions between Proprioceptive and Cutaneous Signals in Primary Somatosensory Cortex,” Neuron, vol. 86, no. 2, pp. 555–566, Apr. 2015. [DOI] [PMC free article] [PubMed] [Google Scholar]
- [5].Bianchi M and Serio A, “Design and Characterization of a Fabric-Based Softness Display,” IEEE Trans. Haptics, vol. 8, no. 2, pp. 152–163, Apr. 2015. [DOI] [PubMed] [Google Scholar]
- [6].Scilingo EP, Bianchi M, Grioli G, and Bicchi A, “Rendering Softness: Integration of Kinesthetic and Cutaneous Information in a Haptic Device,” IEEE Trans. Haptics, vol. 3, no. 2, pp. 109–118, Apr. 2010. [DOI] [PubMed] [Google Scholar]
- [7].Caldiran O, Tan HZ, and Basdogan C, “An investigation of haptic perception of viscoelastic materials in the frequency domain,” in 2018 IEEE Haptics Symposium (HAPTICS), 2018, pp. 222–228. [Google Scholar]
- [8].Srinivasan MA and LaMotte RH, “Tactual discrimination of softness.,” J. Neurophysiol, vol. 73, no. 1, pp. 88–101, 1995. [DOI] [PubMed] [Google Scholar]
- [9].Bergmann Tiest WM and Kappers AML, “Cues for haptic perception of compliance,” IEEE Trans. Haptics, vol. 2, no. 4, pp. 189–199, Oct. 2009. [DOI] [PubMed] [Google Scholar]
- [10].Wang Y and Gerling GJ, “Computational Modeling Reinforces that Proprioceptive Cues May Augment Compliance Discrimination When Elasticity Is Decoupled from Radius of Curvature,” in Haptics: Neuroscience, Devices, Modeling, and Applications: 9th International Conference, EuroHaptics 2014, Versailles, France, June 24-26, 2014, Proceedings, Part II, Auvray M and Duriez C, Eds. Berlin, Heidelberg: Springer Berlin Heidelberg, 2014, pp. 360–368. [DOI] [PMC free article] [PubMed] [Google Scholar]
- [11].Xu C, Wang Y, Hauser SC, and Gerling GJ, “In the Tactile Discrimination of Compliance, Perceptual Cues in Addition to Contact Area Are Required,” Proc. Hum. Factors Ergon. Soc. Annu. Meet, vol. 62, no. 1, pp. 1535–1539, Sep. 2018. [DOI] [PMC free article] [PubMed] [Google Scholar]
- [12].Kuschel M, Di Luca M, Buss M, and Klatzky RL, “Combination and Integration in the Perception of Visual-Haptic Compliance Information,” IEEE Trans. Haptics, vol. 3, no. 4, pp. 234–244, Oct. 2010. [DOI] [PubMed] [Google Scholar]
- [13].Gurari N, Kuchenbecker KJ, and Okamura AM, “Perception of Springs With Visual and Proprioceptive Motion Cues: Implications for Prosthetics,” IEEE Trans. Human-Machine Syst, vol. 43, no. 1, pp. 102–114, Jan. 2013. [Google Scholar]
- [14].Moscatelli A et al. , “The Change in Fingertip Contact Area as a Novel Proprioceptive Cue,” Curr. Biol, vol. 26, no. 9, pp. 1159–1163, 2016. [DOI] [PMC free article] [PubMed] [Google Scholar]
- [15].Rinderknecht MD et al. , “Reliability, validity, and clinical feasibility of a rapid and objective assessment of post-stroke deficits in hand proprioception,” J. Neuroeng. Rehabil, vol. 15, no. 1, p. 47, Dec. 2018. [DOI] [PMC free article] [PubMed] [Google Scholar]
- [16].Kaim L and Drewing K, “Exploratory Strategies in Haptic Softness Discrimination Are Tuned to Achieve High Levels of Task Performance,” IEEE Trans. Haptics, vol. 4, no. 4, pp. 242–252, Oct. 2011. [DOI] [PubMed] [Google Scholar]
- [17].Hauser SC and Gerling GJ, “Force-rate Cues Reduce Object Deformation Necessary to Discriminate Compliances Harder than the Skin,” IEEE Trans. Haptics, vol. PP, no. 99, pp. 1–1, 2017. [DOI] [PMC free article] [PubMed] [Google Scholar]
- [18].Gerling GJ, Hauser SC, Soltis BR, Bowen AK, Fanta KD, and Wang Y, “A Standard Methodology to Characterize the Intrinsic Material Properties of Compliant Test Stimuli,” IEEE Trans. Haptics, pp. 1–1, 2018. [DOI] [PMC free article] [PubMed] [Google Scholar]
- [19].Xu C, Li S, Wang K, Hou Z, and Yu N, “Quantitative assessment of paretic limb dexterity and interlimb coordination during bilateral arm rehabilitation training,” in 2017 International Conference on Rehabilitation Robotics (ICORR), 2017, pp. 634–639. [DOI] [PubMed] [Google Scholar]
- [20].Oldfield RC, “The assessment and analysis of handedness: The Edinburgh inventory,” Neuropsychologia, vol. 9, no. 1, pp. 97–113, Mar. 1971. [DOI] [PubMed] [Google Scholar]
- [21].Collins DF, Refshauge KM, Todd G, and Gandevia SC, “Cutaneous Receptors Contribute to Kinesthesia at the Index Finger, Elbow, and Knee,” J. Neurophysiol, vol. 94, no. 3, pp. 1699–1706, Sep. 2005. [DOI] [PubMed] [Google Scholar]
- [22].Hauser SC and Gerling GJ, “Imaging the 3-D deformation of the finger pad when interacting with compliant materials,” in 2018 IEEE Haptics Symposium (HAPTICS), 2018, pp. 7–13. [DOI] [PMC free article] [PubMed] [Google Scholar]


