

Abstract
Aims:
The aim of this study is to provide statistical inference of the sojourn time and the transition probability from the disease free to the preclinical state of lung cancer for male and female smokers using lung cancer data from the National Lung Screening Trial (NLST).
Materials and Methods:
We applied a likelihood function to the lung cancer data, to obtain Bayesian inference of the transition probability and the sojourn time distribution. A log-normal distribution was used for the transition probability density function multiplied by 30%, and a Weibull distribution was used to model the sojourn time in the preclinical state.
Results:
The estimate of screening sensitivity is 0.61 for males and 0.62 for females. Early transition happened before age 50 and lasted until after age 90. The transition probability from the disease free to the preclinical state has a single maximum at around age 73 for males and 72 for females. For male, the Bayesian posterior mean, and median sojourn time are 1.33 and 1.27 years, respectively. For female, the corresponding posterior mean, and median sojourn time are 1.23 and 1.21 years, respectively.
Conclusion:
Our estimation showed that male smokers are more vulnerable to lung cancer, because they have a higher transition probability density than the same aged female smokers. The female smokers have a slightly shorter mean sojourn time than the male, meaning that they are quicker to develop clinical symptom of lung cancer.
Keywords: Lung Cancer Screening, Sojourn Time, Transition Density, Sensitivity, Markov Chain Monte Carlo, National Lung Screening Trial
1. Introduction
Lung cancer is the second most common cancer and the leading cause of cancer deaths among both men and women in the United States.[1] Lung cancer occurs when malignant (cancer) cells form in the tissues of the lung. Lung cancers usually are grouped into two main types called small cell and non-small cell; among which non-small cell lung cancer is more common than small cell lung cancer. These types of lung cancer grow differently and are treated differently. Cancer screening is looking for cancer before a person develops any symptoms. Cancer screening trials may help finding cancer at an early stage and are meant to show whether early detection helps a person live longer or decreases a person’s chance of dying from the disease. For some types of cancer, the chance of recovery is better if the disease is found and treated at an early stage. There are three kinds of screening test for lung cancer: Low-dose spiral CT scan (LDCT scan): A procedure that uses X-ray machine of low-dose radiation to make a series of very detailed pictures of areas inside the body. Chest X-ray: An X-ray of the organs and bones inside the chest. Sputum cytology: Sputum cytology is a procedure in which a sample of sputum (mucus that is coughed up from the lungs) is viewed under a microscope to check for cancer cells.[2]
According to National Cancer Institute (NCI), five-year overall survival from lung cancer is 20.5% whereas survival at stage I is 59% and from stage II is 31.7%.[3] Early detection and treatment may lead to better survival since the survival rate for advanced lung cancer stage is low. Lung cancer is most frequently diagnosed among people aged 65–74 with a median age of 71 at diagnosis. In 2020, it is estimated that 12.7% among all cancer cases will occur in the United States.[3]
The data we used in this study is the National Lung Screening Trial (NLST) - a randomized clinical trial that screened heavy smokers with either low-dose helical computed tomography (CT) or single-view chest radiography (X-ray).[4] We used the standard chest X-ray (a single image of the whole chest) data divided in to two groups: male (15,396) and female (10,634) of heavy smokers. Asymptomatic participants aged 55 to 74 from 33 centers across the US between August 2002 and April 2004 were initially screened from each group. Three annual screening exams were provided to each participant from each group. The data were organized in such a way for accurate estimation: for each age t0 at study entry, and at each screening, the total number of people being screened ni, the number of confirmed cancer cases si and the number of interval cases ri, before the next exam. Participants that dropped in the middle of the program are also included. Table 1 shows the data format that we are using from the NLST study. Patients with different age, gender, smoking status are considered as major risk factors in this project. If any of the tests was positive, then the screen was considered positive and a definitive work-up exam, such as biopsy, was done.
Table 1:
Sample Cancer Screening Data
| Age t | n 1 | s 1 | r 1 | n 2 | s 2 | r 2 | … | ank | s k | r k |
|---|---|---|---|---|---|---|---|---|---|---|
| … | … | … | … | … | … | … | … | … | … | … |
| 60 | 1188 | 4 | 1 | 1123 | 3 | 2 | … | 1091 | 1 | 2 |
| … | … | … | … | … | … | … | … | … | … | … |
| 65 | 752 | 6 | 1 | 704 | 3 | 3 | … | 686 | 3 | 3 |
| … | … | … | … | … | … | … | … | … | … | … |
The total number of screening K > 0 is an integer. K = 3 in NLST study
In this study, we assume that the disease develops through three states denoted by
The state S0 refers to the disease-free state: a person does not have the disease, or the person have the disease of an early stage which cannot be detected by a screening exam. The state Sp is the preclinical disease state: an asymptomatic individual unknowingly has the disease that a screening exam can detect. The disease state, Sc is a state at which the disease is found with clinical symptoms. This was illustrated in Figure 1. We will focus on estimating the parameters: the transition probability and the sojourn time in X-ray screening using the NLST data.
Figure 1:

A graphical representation of disease progression model
Transition probability is the probability density function which indicates the time duration in the disease-free state S0. Also, it provides important information about the age people will move from the disease-free (S0) to the preclinical state (Sp). Sojourn time is the time duration a person stays in the preclinical state Sp. A person with a longer sojourn time means that it is easier to catch the disease by screening exams. If a person enters the preclinical state (Sp) at age t1, and his (or her) clinical symptoms present later at age t2, then Tp = (t2 − t1) is the sojourn time in the preclinical state. The nature of data collection in a screening program makes it hard to observe the inception of either Sp or Sc. Therefore, estimation of the sojourn time and transition density is difficult without proper modeling. Our goal is to provide accurate statistical inference for the distribution of sojourn time and the transition probability from the disease-free to the preclinical state for smokers using the NLST-Lung cancer screening data, and we will use the likelihood function in Wu et al. [5]
2. Method
Let t represents the age of participants in the screening. β(t) represents the sensitivity of the screening. We define w(t)dt as the probability of the transition from S0 to Sp in the time interval (t, t + dt). Let q(x) be the probability density function (pdf) of the sojourn time in (Sp)., then is the survival function of the sojourn time in Sp
Initially, we consider asymptomatic heavy smoker of age t0, who has no history of lung cancer, and suppose that the person will undergo K screening exams at ages t0 < t1 < ⋯ < tK−1 , where ti = t0 + i for annual screening exams in the NLST study. We define the ith screening interval as the time interval between the ith and the (i + 1)th screening exams (ti−1, ti) where i = 1,2, … , K − 1. We consider t−1 = 0. For each screening exam, let ni,t0 be the total number of individuals in this cohort examined at the ith screening, si,t0 is the number of cases detected at the ith screening exam, and ri,t0 is the number of cases diagnosed in the clinical state Sc within the interval (ti−1, ti) which is the interval cases. For the NLST data, since the age of participants enrolled was between 55 to 74 at the study entry the likelihood function for all groups is:
| (1) |
where Dk,t0 is the probability that an individual will be diagnosed at the kth scheduled exam given that he or she is in Sp, and Ik,t0 is the probability of being incident in the kth screening interval. These two probabilities were originally derived in Wu et al.:[5]
| (2) |
| (3) |
| (4) |
The sensitivity was estimated by the epidemiologic method using the NLST data:
| (5) |
It was obtained by using the total number of screen-detected cases divided by the sum of screen detected cases and interval cases.[6] This provides β(t) = 0.61 for male smokers and β(t)= 0.62 for female smokers, which would be used in the likelihood function for β(t). We would use a log-Normal PDF multiplied by 30% for the transition density:
| (6) |
The density and the survival function of the sojourn time are:
| (7) |
where x is the sojourn time in the state of Sp; α and λ are positive parameters to be estimated.
3. Results
We applied the likelihood function to the NLST X-ray data and obtained the Bayesian estimate of the four unknown parameters θ = (μ, σ2, α, λ) in lung cancer for smokers. We used epidemiological method to estimate the sensitivity for the study which does not depend on the age of the patients. The sensitivity is 0.61 for males, and 0.62 for females, which means sensitivity is slightly higher in female than male.
Markov Chain Monte Carlo (MCMC) was used to draw posterior samples with non-informative Uniform priors. The prior distribution for μ was Uniform (0.1, 5) and σ2 was Uniform (0.01, 0.99). The prior for α was Uniform (0.1, 5), and the prior for λ was Uniform (0.1, 2). It was mentioned in Wu et al.,[7] the range for each parameter can be identified as: 4 < μ < 4.5, 0.01 < σ2 < 0.05, 1.5 < α < 4, and 0.01 < λ < 0.5. We partitioned the posterior simulation into two sub-chains, sampling the posterior for (μ, σ2) and (α, λ) separately. Three simulations were carried out that were over dispersed with respect to the target distribution. Each simulation was run for 200,000 iterations, with 50,000 burn-in steps. After the burn-in steps, the posteriors were sampled every 300 steps, resulting 500 posterior samples for the parameter vector θ. The 500 posterior samples from each of the three chains were pooled for the analysis, providing a total of 1,500 posterior samples for θ. The MCMC trace and the posterior density of θ are plotted using the final 1,500 posterior samples for θ of two groups: male and female groups. Figure 2 shows the MCMC trace plot of male and female group. Figure 3 shows the density plots for two groups. The posterior estimates for parameters θ are listed in table 2.
Figure 2:


The MCMC trace plots of parameters θ = (μ, σ2, α, λ) using chest X-ray of male and female group
Figure 3:

The posterior density plots of the parameters θ = (μ, σ2, α, λ) using chest X-ray of male and female group
Table 2:
Bayesian Posterior Estimates
| Male | Female | |||||
|---|---|---|---|---|---|---|
| Parameters | Mean | Median | SE | Mean | Median | SE |
| μ | 4.3158 | 4.3156 | 0.0114 | 4.3178 | 4.3176 | 0.0665 |
| σ 2 | 0.0220 | 0.0218 | 0.0032 | 0.0376 | 0.0374 | 0.0063 |
| α | 2.3274 | 2.1165 | 0.7130 | 2.7634 | 2.7797 | 0.7200 |
| λ | 0.4210 | 0.4326 | 0.0587 | 0.4063 | 0.4164 | 0.0665 |
| MST | 1.3388 | 1.2606 | 0.7039 | 1.2742 | 1.2335 | 0.5733 |
Figure 3 shows the density for each parameter, θ = (μ, σ2, α, λ) with pointing out Bayesian mean and 95% credible interval for male and female group. Figure 4 and 5 show posterior quantities of transition probability and sojourn time for each group. The age-dependent transition probability is a sub-pdf of log-normal distribution multiplied by 30%. The transition probability has a single maximum around age 73 for males and 72 for females. The posterior mean sojourn time (MST) is 1.33 years for male and 1.27 years for female, with a posterior median of 1.26 years for male and 1.23 years for female, respectively. The standard error for the sojourn time is 0.70 for male and 0.57 for female. By Bayesian estimate, males may have a slightly longer sojourn time in the preclinical state which is not statistically significant (i.e., Probability ((MST of male) > (MST of female)) = 0.392). We plotted the density curve of the MST for male and female heavy smokers for comparison in Figure 6.
Figure 4:

Posterior quantities (2.5%, 50%,97.5%) of transition probabilities
Figure 5:

Posterior quantities (2.5%,50%,97.5%) of sojourn time probabilities
Figure 6:
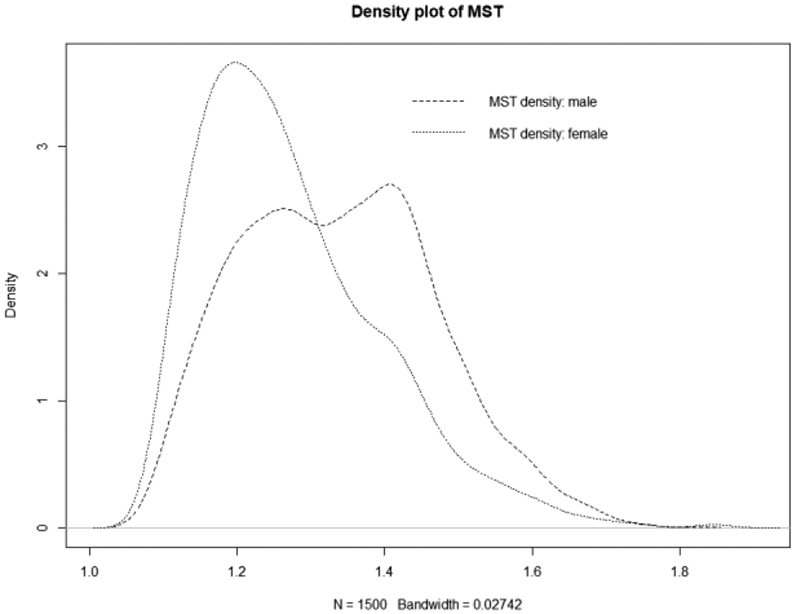
Density plot of Mean Sojourn Time of male and female
4. Discussion and Conclusion
In this study, we limited our research to Bayesian estimates, without using the maximum likelihood estimate (MLE). Wu and Kim stated in their review article that estimating these parameters using the MLE is very hard to be close to the true value when the number of screening is less than four and the sample size is small for each age group.[8] In the case of large sample size, the average of MLE may be closer to the true value, but the standard error becomes large. In the NLST study, the number of screening is less than four and it was hard to obtain the MLE, so we focus on using Bayesian inference in this project. We applied the likelihood method (1) to the NLST X-ray data for male and female heavy smokers separately, to estimate the sojourn time and the transition density by drawing posterior samples using Markov Chain Monte Carlo (MCMC) in a Bayesian framework. The goal is to obtain accurate estimation of the sojourn time and the transition age into the preclinical state, to assist policy makers make decisions regarding initial age of heavy smokers for lung cancer screening exams and determine the frequency to schedule future exams.
We used the epidemiological method to estimate the sensitivity, the probability of getting a positive result given one is in the preclinical state, which is the same method as in Wang et al..[9] They found that the sensitivity was 0.65 for male and 0.68 for female smokers using the PLCO X-ray data. We found that the sensitivity (5) was 0.61 for male and 0.62 for female heavy smokers, very close to that of the PLCO X-ray data. In the NCI trials, the sensitivity of chest X-ray was demonstrated an average of 0.69 with an interval of 0.54-0.84.[10] Wu et al. demonstrated that the 95% highest posterior density (HPD) interval for sensitivity is (0.72, 0.98) with a posterior mean 0.89 on the Mayo Lung Project.[7] The sensitivity estimated in the study of Liu et al. [11] using the NLST low dose CT group data was around 0.95 for all male-female groups, confirming that low dose CT scan improves lung cancer screening sensitivity greatly.
Three previous studies had reported sensitivity of chest X-ray and that had a low risk of bias and, the sensitivity estimates for these studies were: 79.3% (95% CI = 67.6 to 91.0%), 76.8% (95% CI = 64.5 to 84.2%), and 79.7% (95% CI = 72.7 to 86.8%).[15, 16, 17] Toyoda et al. showed sensitivity of chest X-ray by detection method was 78.3%, and by the incidence method was 86.5% whereas, sensitivity of low-dose CT by detection method was 88.9%, and by the incidence method was 79.5%.[18]
Transition into the preclinical state could happen before age 50, and last until after age 90 from Figure 4. In Wang et al.,[9] the transition probability increases all the way to age 80 for male smokers and has a peak around age 72.5 for females. In Liu et al., they showed that the transition probability from the disease-free to the preclinical state has a peak around age 70 for both genders.[11] Wu et al. found age-dependent transition probability with a single maximum at age 68 for male. [7] The transition probability had a peak around age 70 on the study of The Lung Cancer Screening Program at the Memorial Sloan-Kettering Cancer Center (MSKC-LCSP) data by Chen et al..[12] In this study, the transition probability from the disease-free to the preclinical state has a high peak at around age 73 for males and 72 for females. To find people at potential risk, it is important to know at what age would the transition from the disease-free state to the preclinical state starts and ends.
The goal of cancer screening is to catch the cancer in its preclinical state before symptoms appear. Our results show that male smokers have a slightly longer mean sojourn time (1.33 years) than their female counterparts (1.27 years) which is not statistically significant in the NLST X-ray study. This slight difference of MST both for male and female can be easily identified from the Figure 6, however, is not significant. In general, both groups have a shorter sojourn time than other existing results, which explains why lung cancer screening have a short time interval to catch lung cancer. The 95% HPD interval for the sojourn time is (1.102, 1.576) for male and (1.088, 1.512) female smokers. Additionally, 90% HPD interval for the sojourn time is (1.108, 1.515) for male and (1.100, 1.453) female smokers. Liu et al. in her CT scan of lung cancer study estimated the MST was 1.44 years for males and 1.62 years for females.[11] However, Chen et al. had a MST about 3.35 years for male smokers.[12] In the Mayo Lung Project study, the MST was shorter (2.24 years).[7] Chien et al. summarized several MST estimates ranging from 1.38–3.86 years from different CT scan.[13] In Wang et al., the MST for male was 1.50 and female was 1.74 years.[9] In the paper, Chen et al. enlisted the MST values from previous researches and mentioned that the estimated MST with a 95%CI of range from 1.38 (0.63–3.18) to 3.86 (3.42–3.99) whereas the median and 95% CI of MST as a whole was estimated as 2.06 (0.42–3.83) years.[14]
The key parameters obtained from this study are important, and reliable estimation is our priority. Because other interesting terms, such as the lead time distribution, the percentage of overdiagnosis, etc., can be expressed as functions of these key parameters, and the outcomes here will be used for further studies.
Acknowledgements
This research was supported by NIH/NCI 1R15CA242482 (Wu). We authors thank the National Cancer Institute (NCI) for access to the NCI’s data collected by the NLST team. The statements contained herein are solely those of the authors and do not represent or imply concurrence or endorsement by the NCI.
References
- 1.Centers for Disease Control and Prevention. Retrieved from https://www.cdc.gov/cancer/lung/index.htm (accessed 14 September 2020).
- 2.National Cancer Institute. Retrieved from https://www.cdc.gov/cancer/lung/index.htm (accessed 14 September 2020).
- 3.National Cancer Institute. Retrieved from https://seer.cancer.gov/statfacts/html/lungb.html (accessed 14 September 2020).
- 4.Jang H, Kim S, Wu D. Bayesian lead time estimation for the Johns Hopkins lung project data. JEGH. 2013; 3(3): 157–163. [DOI] [PMC free article] [PubMed] [Google Scholar]
- 5.Wu D, Rosner GL, Broemeling L. MLE and Bayesian inference of age-dependent sensitivity and transition probability in periodic screening. Biometrics. 2005; 61(4): 1056–1063. [DOI] [PMC free article] [PubMed] [Google Scholar]
- 6.Walter SD, Day NE. Estimation of the duration of a pre-clinical disease state using screening data. Am J Epidemiol. 1983; 118(6): 865–886. [DOI] [PubMed] [Google Scholar]
- 7.Wu D, Erwin D, Rosner GL. Sojourn time and lead time projection in lung cancer screening. Lung Cancer. 2011; 72(3): 322–326. [DOI] [PMC free article] [PubMed] [Google Scholar]
- 8.Wu D, Kim S. Problems in the estimation of the key parameters using MLE in lung cancer screening. J Clin Res Rep. 2020; 5(3). [PMC free article] [PubMed] [Google Scholar]
- 9.Wang D, Levitt B, Riley T, Wu D. Estimation of sojourn time and transition probability of lung cancer for smokers using the PLCO data. J Biom Biostat. 2017; 8((3)60): 2. [Google Scholar]
- 10.Gavelli G, Giampalma E. Sensitivity and specificity of chest X-ray screening for lung cancer. Cancer. 2000; 89(S11): 2453–2456. [DOI] [PubMed] [Google Scholar]
- 11.Liu R, Levitt B, Riley T, Wu D. Bayesian estimation of the three key parameters in CT for the National Lung Screening Trial data. J Biom Biostat. 2015; 6(5). [Google Scholar]
- 12.Chen Y, Erwin D, Wu D. Over-diagnosis in lung cancer screening using the MSKC-LCSP data. J Biom Biostat. 2014; 5(201): 322–326. [Google Scholar]
- 13.Chien C, Lai M, Chen TH. Estimation of mean sojourn time for lung cancer by chest X-ray screening with a Bayesian approach. Lung Cancer. 2008; 62(2): 215–220. [DOI] [PubMed] [Google Scholar]
- 14.Chien C, Chen TH. Mean sojourn time and effectiveness of mortality reduction for lung cancer screening with computed tomography. Int. J. Cancer 2008; 122: 2594–2599. [DOI] [PubMed] [Google Scholar]
- 15.Bjerager M, Palshof T, Dahl R, et al. Delay in diagnosis of lung cancer in general practice. Br J Gen Pract. 2006; 56(532): 863–868. [PMC free article] [PubMed] [Google Scholar]
- 16.Stapley S, Sharp D, Hamilton W. Negative chest X-rays in primary care patients with lung cancer. Br J Gen Pract. 2006; 56(529): 570–573. [PMC free article] [PubMed] [Google Scholar]
- 17.Barry C, Bergin D. Non-detected primary lung cancers on chest x-ray: 3 year retrospective review in university hospital. Ir J Med Sci. 2015; 1: S262. [Google Scholar]
- 18.Toyoda Y, Nakayama T, Kusunoki Y, Iso H, Suzuki T. Sensitivity and specificity of lung cancer screening using chest low-dose computed tomography. British Journal of Cancer. 2008; 98: 1602–1607. [DOI] [PMC free article] [PubMed] [Google Scholar]