

Abstract
Adult-onset neurodegenerative diseases are often accompanied by evidence of a chronic inflammation that includes activation of microglial cells and altered levels of brain cytokines. Aspects of this response are likely secondary reactions to neurodegeneration, but for many illnesses the inflammation may itself be an early and even causative disease event. In such cases, the inflammation is referred to as “sterile” as it occurs in the absence of an actual bacterial or viral pathogen. A potent trigger of sterile inflammation in CNS microglia has been shown to be the presence of DNA in the cytoplasm (cytoDNA) induced either by direct DNA damage or by inhibited DNA repair. We have shown that cytoDNA comes from the cell nucleus as a result of insufficient DNA damage repair. Using wild-type and Atm-/- mouse microglia, we extend these observations here by showing that its genomic origins are not random, but rather are heavily biased toward transcriptionally inactive, intergenic regions, in particular repetitive elements and AT-rich sequences. Once released from the genome, in both males and females, we show that cytoDNA is actively exported to the cytoplasm by a CRM1-dependent mechanism. In the cytoplasm, it is degraded either by a cytosolic exonuclease, Trex1, or an autophagy pathway that ends with degradation in the lysosome. Blocking the accumulation of cytoDNA prevents the emergence of the sterile inflammation reaction. These findings offer new insights into the emergence of sterile inflammation and offer novel approaches that may be of use in combatting a wide range of neurodegenerative conditions.
SIGNIFICANCE STATEMENT Sterile inflammation describes a state where the defenses of the immune system are activated in the absence of a true pathogen. A potent trigger of this unorthodox response is the presence of DNA in the cytoplasm, which immune cells interpret as an invading virus or pathogen. We show that when DNA damage increases, fragments of the cell's own genome are actively exported to the cytoplasm where they are normally degraded. If this degradation is incomplete an immune reaction is triggered. Both age and stress increase DNA damage, and as age-related neurodegenerative diseases are frequently accompanied by a chronic low-level inflammation, strategies that reduce the induction of cytoplasmic DNA or speed its clearance become attractive therapeutic targets.
Keywords: DNA damage, cytoplasmic DNA, microglia, inflammation, repetitive elements
Introduction
Pathologic deposits of misfolded proteins are often cited as “hallmarks” of neurodegenerative disease, even as other pathologies like DNA damage (Herrup et al., 2013; Hou et al., 2017; Tse et al., 2018; Pao et al., 2020) and neuroinflammation (Heneka et al., 2015) contribute significantly to their etiology. DNA damage is a key driver of the neurodegeneration and aging processes (Katyal and McKinnon, 2008; Chow and Herrup, 2015), while neuroinflammation induces increased risk of Alzheimer's disease as supported by the genetic association of immune-related genes such as TREM2 and CD33 (Bradshaw et al., 2013; Guerreiro et al., 2013). Recent work has shown that these two processes are related. DNA damage can serve as a potent inflammatory signal in cells of the innate immune system (McCool and Miyamoto, 2012; Paludan and Bowie, 2013; West et al., 2015; Vizioli et al., 2020) and cells that are deficient for the DNA repair protein, ataxia-telangiectasia mutated (ATM), accumulate DNA fragments in their cytoplasm (cytoDNA; Quek et al., 2017a; Song et al., 2019). Microglia interpret the presence of any DNA in the cytoplasm, including fragments of their own genome as a pathogenic invasion (Vanpouille-Box et al., 2018). The resulting proinflammatory reaction is known as “sterile inflammation” and has been implicated in conditions such as cancer, neurodegeneration and aging (Paludan and Bowie, 2013; Feldman et al., 2015; Quek et al., 2017b; Vanpouille-Box et al., 2018; Ferro et al., 2019; Hu and Shu, 2020; Kwon and Bakhoum, 2020).
Double-stranded DNA (dsDNA) in the cytoplasm is recognized by cyclic GMP-AMP synthase (cGAS), which catalyzes the formation of 2′−3′-cyclic GMP-AMP (cGAMP). Subsequently, cGAMP binds to stimulator of interferon genes (STING; Paludan and Bowie, 2013), which upregulates interferon gene expression and NFκB activation (Balka et al., 2020). While the cytoDNA response serves as an important pathogen defense, if it is not cleared, the resulting prolonged inflammatory response has adverse effects. Eukaryotic cells have several ways to remove cytoDNA to protect themselves against constitutive inflammation. The first involves Trex1, a 3′→5′ cytoplasmic exonuclease (Perrino et al., 1999; Stetson et al., 2008; Hasan and Yan, 2014; Simpson et al., 2020). Interestingly, Trex1 knock-out mice have high levels of DNA-dependent inflammation (Yang et al., 2007; Hasan et al., 2013; Rego et al., 2018), that leads to death in a cytoDNA-dependent and STING-dependent manner (Kawane et al., 2006; Ahn et al., 2012; Gao et al., 2015). A second cytoDNA clearance mechanism is the lysosome-autophagy pathway (Arsenis et al., 1970; Odaka and Mizuochi, 1999). CytoDNA can either be packaged in autophagic vesicles, or directly imported into lysosomes via LAMP2a/SIDT2 transport to be degraded by DNase2α (Fujiwara et al., 2013, 2017).
Although the cellular responses to cytoDNA have been studied for over half a century, with respect to microglia little is known about the mechanisms of cytoDNA production and degradation and its relationship to the process of neuroinflammation. Here, we demonstrate that when DNA repair is compromised in microglia, cytoDNA is released from the nucleus. Using next-generation sequencing (NGS), we show that virtually none of the cytoDNA comes from the mitochondria and that the nuclear origins of cytoDNA are not random. Rather specific regions of the genome, notably repetitive elements, are overrepresented in its composition. These sequences are associated with specific histone modifications, transcription factor binding motifs, and localization at the nuclear periphery. We further show that cytoDNA is actively transported by a leptomycin B (LMB)-sensitive process from nucleus to cytoplasm. Once in the cytoplasm, it is degraded by both Trex1 and the lysosome-autophagy pathway. Taken together, our findings offer new insights into features of cytoDNA and identify key steps in its “life history” and role in neuroinflammation.
Materials and Methods
Animals
ATM knock-out mice, Bal (B6;129S4-Atmtm1Bal/J) and wild-type mice (C57BL/6J) were obtained from The Jackson Laboratory. Briefly, the Atm-/- mouse line was created by injecting the ES cells with correct target (129S4/SvJae) into C57BL/6 blastocysts. The resulting chimeric mice were bred to C57BL/6 mice. After receiving breeder mice from JAX, we have backcrossed our line twice again to C57BL/6J mates. For direct comparisons between wild-type and Atm-/- cells, littermate wild-type mice were used for the control samples. Mice used in this study were maintained and bred in the facility of Division of Laboratory Animal Resources (DLAR), University of Pittsburgh, School of Medicine. Protocols were approved by the Institutional Animal Care and Use Committees in the University of Pittsburgh. Animals were treated in compliance with the Institute for Laboratory Animal Research of the National Academy of Science's Guide for the Care and Use of Laboratory Animals. Genotyping at the Atm locus was done with the recommended PCR primers using the PCR ReadyMix kit (E3004; Sigma-Aldrich) as previously described (Cheng et al., 2018); PGK35: 5′-GGA AAA GCG CCT CCC CTA CCC -3′; Bal AT9: 5′-CCT CCT CAT ATT TGT AAC ACG CTG-3′; and Bal: AT12: 5′-TGT AAT GTG CCT TAA AGA ACC TGG -3′. Colonies were maintained by intercrossing heterozygous Atm+/− males and females.
Reagents and molecular biologicals
The ATM-specific kinase inhibitor, KU-60019, was obtained from Selleckchem (S1570). Etoposide, a topoisomerase inhibitor, was from Sigma-Aldrich (33419-42-0). Rapamycin, an mTOR inhibitor, was from Tocris Bioscience. LMB, a nuclear exportin-1 inhibitor, was from MilliporeSigma. GFP-Trex1-shRNA (TL511298) was obtained from Origene. tGFP-Sting-shRNA (TRCN0000346319) was purchased from Sigma, MISSION. mtagBFP- STING (102586) was obtained from Addgene. LysoTracker-Red (L7528) and MitoTracker-Green (M7514) were obtained from Thermo Fisher Scientific.
Primary neuronal culture
Embryonic cortical neurons were isolated following standard procedures. Briefly, cortices were collected from embryonic day (E)16 C57BL/6J wild-type mouse embryos followed by mincing with scissors for 3 min. Both male and female embryos were included in the culture. The cells were plated at a density of 8500 cells/cm2 on poly-L-lysine–coated glass coverslips and cultured for 14 d in vitro (DIV14) in Neurobasal medium (Thermo Fisher Scientific), supplemented with 2% B27 (Thermo Fisher Scientific), 1% Glutamax (Thermo Fisher Scientific), and 1% penicillin/streptomycin (10,000 U/ml; Thermo Fisher Scientific), at 37°C in a 95% air/5% CO2 atmosphere. Once established, cultures consisted of over 85% neurons based on the percentage of MAP2-immunopositive cells. For immunocytochemistry studies, cells were washed with PBS and fixed in 4% PFA for 15 min. After rinsing in PBS, cells were stored at 4°C in 0.1% PFA if longer-term storage was required.
Primary microglial culture
Primary microglia were isolated from C57BL/6J mice using an established protocol (Tamashiro et al., 2012). A mixed glial cell population was obtained from postnatal day (P)5 pups and was cultured for two weeks in T75 flasks with DMEM supplemented with 10% FBS and 1% penicillin/streptomycin (10,000 U/ml; Thermo Fisher Scientific). An enriched microglial cell preparation was obtained by shaking the flasks at 37°C for 2 h. Microglia were plated on poly-L-lysine-coated glass coverslips at a final density of 50,000 cells per well in a 24-well plate or 200,000 cells per well in poly-L-lysine coated six-well plates and grown for 24 h. The purity of the microglial cultures was assessed using immunostaining for the microglia specific marker, Iba1. Cultures with over 90% Iba1-positive cells were used for additional experiments. For all experiments, the medium was changed to serum free media 12 h before any treatment.
Cell culture and transfection
HEK293FT cells (Thermo Fisher Scientific) or MEF were cultured in DMEM separately and both supplemented with 10% FBS and 1% penicillin/streptomycin (10,000 U/ml; Thermo Fisher Scientific) at 37°C in a humidified incubator with 95% air/5% CO2 atmosphere. Cells were plated at a density of 100,000 cells per well into a six-well plate or 20,000 cells per well on 13-mm coverslips in 24-well plates and allowed to grow for 24 h until they reached 65% confluency. Immediately before transfection, the medium was replaced with penicillin/streptomycin-free media. DNA constructs were transfected with Lipofectamine 2000 (Thermo Fisher Scientific). Twelve hours after transfection, the transfection culture medium was replaced with fresh medium supplemented with 10% FBS and 1% penicillin/streptomycin. Cells were cultured for another 48 h to allow recovery and plasmid expression. Before analysis, cells were rinsed once with PBS. For immunocytochemistry studies, cells were then fixed with 4% paraformaldehyde for 15 min at room temperature and stored at 4°C until further use.
Terminal dUTP nick end labeling (TUNEL) assay
The TUNEL assay to detect DNA breaks in both primary microglia and HEK293FT cells was performed using the Click-iT Plus TUNEL Assay kit (C10617, Thermo Fisher Scientific) as previously described (Song et al., 2019). Briefly, both primary cultured microglia and HEK293FT cells were plated on 13-mm coverslips. After washing with PBS, cells were fixed with 4% paraformaldehyde incubation at room temperature for 15 min. After permeabilization at room temperature for 15 min and rinsing once in PBS, TdT reaction buffer was applied to the coverslips for 10 min at 37°C. The TdT reaction mixture was then applied to the slides, which were incubated for another 60 min at 37°C. After blocking, cells were then incubated in the dark for 30 min at 37°C with Click-iT Plus TUNEL reaction cocktail. After washing with PBS, slides were counterstained with DAPI and mounted with Hydromount (HS-106; National Diagnostics) for fluorescent microscope imaging. The intensities of the TUNEL signals in the nucleus and cytoplasm were measured using ImageJ.
Immunocytochemistry and immunofluorescence
Cells were rinsed with PBS and fixed on 13-mm coverslips with 4% paraformaldehyde for 15 min at room temperature, then rinsed once with PBS. Cells were permeabilized and blocked by incubation in PBS with 5% donkey serum and 0.1% Triton X-100 for 1 h at room temperature. Individual primary antibodies in blocking buffer were applied to the cells at 4°C overnight. Coverslips were then rinsed with PBS three times for 10 min each and incubated with secondary antibodies at room temperature for 1 h. After rinsing, cells were counterstained with DAPI for 5 min to label cell nuclei and mounted with Hydromount for fluorescent microscope imaging. Information of antibodies in this study is listed in Table 2.
Table 2.
Antibodies
| Name | Reference number | Source |
|---|---|---|
| dsDNA | MAB1293 | Millipore |
| GAPDH | ab8245 | Abcam |
| MAP2 | ab5392 | Abcam |
| STING | NBP2-24638 | NOVUSBIO |
| γH2AX | ab2893 | Abcam |
| H3K9me3 | ab8898 | Abcam |
| H3K9ac | ab10812 | Abcam |
| Synapsin-I | ab64581 | Abcam |
| TFEB | 13372-I-AP | Proteintech |
| p-TFEB | ABE1971 | Millipore |
| Trex1 | NBP1-76977 | NOVUS |
| LAMP1 | ab25245 | Abcam |
| LC3BII | ab51520 | Abcam |
| SQSTM1/p62 | ab56416 | Abcam |
| Iba1 | ab108539 | Abcam |
| GFAP | ab7260 | Abcam |
| NBS1 | 14956S | Cell Signaling |
| 8-oxoguanine | ab206461 | Abcam |
| p-p65 (S536) | 3033S | Cell Signaling |
| IL1- β | ab9722 | Abcam |
Immunoprecipitation, SDS-PAGE, and Western blot analysis
Cultured cells were harvested with ice-cold RIPA buffer (EMD Millipore) with 1× PhosSTOP phosphatase inhibitor mixture (Roche Applied Science) and 1× complete protease inhibitor cocktail (Roche Applied Science). The homogenate was then centrifuged at 4°C for 20 min at 15,000 rpm. The aqueous phase containing protein was collected. Protein concentration was determined using the Bradford assay (Bio-Rad). For Western blottings, a total of 10-μg protein was separated by SDS-PAGE and transferred to Immuno-Blot PVDF membranes (Bio-Rad). Membranes were incubated in 5% non-fat milk for 1 h at room temperature to block nonspecific binding. Primary antibodies were applied at room temperature overnight at the determined concentration. After rinsing three times with TBST, membranes were incubated with secondary antibodies for 1 h at room temperature. Signals were visualized with SuperSignal West Pico, Dura, or Femto chemiluminescent substrate (Thermo Fisher Scientific).
Flow cytometry analysis
HEK293FT cells were fixed in 80% methanol in PBS for 15 min at room temperature. Cells were pelleted by centrifugation (800 × g, 5 min) and resuspended in blocking buffer (PBS with 0.1% Triton X-100 and 5% donkey serum). After blocking for 1 h at room temperature, primary antibodies were applied to the cell suspension and incubated for 2 h at 4°C. After washing, secondary antibodies were applied for another 1 h at 4°C. FACS analysis was performed and analyzed on a Becton Dickinson FACS Aria IIIu flow cytometer equipped with 405-, 488-, 561-, and 631-nm lasers using a 70-μm nozzle. Data were analyzed with FlowJo v10.
Purification of cytoDNA
Cytoplasmic DNA was isolated as previously described with minor modifications (Yang et al., 2007). Briefly, primary cultured microglia were lysed in a lysis buffer containing 10 mm HEPES (pH 7.9), 10 mm KCl, 1.5 mm MgCl2, 0.34 m sucrose, 10% (v/v) glycerol, 0.1% (v/v) Triton X-100 plus protease inhibitors for 5 min on ice. Cell nuclei were removed by low-speed centrifugation (1500 × g, 10 min). Cytoplasmic extracts were treated with 1 mg/ml Proteinase K at 56°C for 2 h. The aqueous supernatant was incubated with 500 mg/ml DNase-free RNase A (QIAGEN) for 30 min at 37°C and followed by phenol/chloroform extraction. The DNA-containing aqueous phase was precipitated and resuspended in TE buffer. DNA concentrations were adjusted according to the protein concentration of cytoplasmic fractions and analyzed on a 2% agarose gel infused with ethidium bromide. The DNA concentrations were determined by Qubit Assays on a Qubit 4 Fluorometer.
CytoDNA sequencing
CytoDNA sequencing was performed on two biological replicates. Library preparation for cytoplasmic DNA was performed according to the KAPA Hyper Prep kit (KR0961, v6.17, KAPA biosystems) protocol, omitting the library amplification step to avoid sequence enrichment bias. The cytoplasmic DNA library was then analyzed on the Advanced Analytical Technologies Fragment Analyzer Automated CE System using an Agilent HS NGS Fragment kit (part DNF-474-0500), and size selected using AMPure XP beads (Beckman Coulter) for fragment sizes between 200 and 700 base pairs. All libraries were sequenced on the Illumina Nextseq 500 platform. All sequencing datasets from this study have been deposited to the Gene Expression Omnibus (GEO) under the accession GSE164337.
Statistical analysis for imaging and protein quantification
All imaging and protein quantification data were obtained from at least three independent biological replicates. Quantifications were performed in a blinded manner. Differences between groups were measured using the unpaired t test, one-way ANOVA, or multiple t tests. Two-way ANOVA was used to determine the difference of two predicted variables. These statistical analyses were performed with GraphPad Prism 7; p ≤ 0.05 was considered significant; *p < 0.05, **p < 0.01, ***p < 0.001, ****p < 0.0001. Results are reported as mean ± SEM.
GSAT_MM qPCR
GSAT_MM was quantified by real-time PCR (TB Green Premix Ex Taq II, Takara Bio). Total GSAT_MM quantity was adjusted to reflect total amount in cytoplasmic DNA, then normalized to control, since the number of microglia was normalized before cytoDNA extraction for each control and KU-60019-treated replicate pair. Information of the primers in this study is listed in Table 1.
Table 1.
Primers sequence for cytoDNA analyzed by RT-qPCR
| Oligonucleotides | Sequences | Source |
|---|---|---|
| GSAT_MM-forward | TGGAATATGGCGAGAAAACTG | Velazquez Camacho et al. (2017) |
| GSAT_MM-reverse | AGTCGTCAAGTGGATGTTTCTCAT | This article |
| Oct4 promoter-forward | ACCCGGCCCAAAGTGACTCTTAAAG | This article |
| Oct4 promoter-reverse | GGCCTTGAACTCACAGAGATCCACC | This article |
| Mitochondrial ND1-forward | CTAGCAGAAACAAACCGGGC | Quiros et al. (2017) |
| Mitochondrial ND1-reverse | CCGGCTGCGTATTCTACGTT | Quiros et al. (2017) |
| Mitochondrial 16S rRNA-forward | CCGCAAGGGAAAGATGAAAGAC | Quiros et al. (2017) |
| Mitochondrial 16S rRNA-reverse | TCGTTTGGTTTCGGGGTTTC | Quiros et al. (2017) |
Telomeric and mitochondrial read quantification
To identify reads with mouse telomere consensus sequence, each quality-trimmed read from fastq files (see cytoDNA data analysis) was scanned for telomeric sequence TTAGGG. Mitochondrial read percentages were calculated by number of reads mapped to chrM regions over total uniquely mapped read numbers.
CytoDNA data analysis
Reads were quality trimmed using Trim Galore with parameters –phred33. Trimmed reads were then aligned to GRCm38/mm10 using Bowtie with parameters -v 3 -m 1 –best –strata. Reads which were multialigned but mapped to the same subfamily were rescued by our in-house pipeline (Jiang et al., 2020). CytoDNA regions were defined by 100-bp bins with reads per kilobase per million reads (RPKM) over 10× that of the genome average. Bins that overlapped [using BEDtools (Quinlan and Hall, 2010) intersect] with ENCODE-defined blacklist regions (https://www.encodeproject.org/; ENCODE Project Consortium, 2012; datasets: ENCFF226BDM, ENCFF790DJT, ENCFF999QPV) or chromatin immunoprecipitation input peaks (called by MACS2 callpeak -g 2.43e + 09 –keep-dup all; unpublished datasets) were disregarded. The remaining bins that were within 100 base pairs apart were merged (BEDtools merge -d 100). For all subsequent analysis, chrUn regions were excluded unless explicitly mentioned. Size-matched and number-matched shuffled regions were generated using BEDtools shuffle. Distance between cytoDNA regions were calculated using BEDtools closest (parameters: -d -t first -io). For distance analysis, cytoDNA or shuffled regions that did not have a neighboring region were excluded (Analyzed regions: control = 68, control shuffle = 88; KU-60019 = 1291, KU-60019 shuffle = 1295). Base composition p value was calculated by one-sided t test based on 300 shuffled regions. For genomic features pie chart, gene regions were extracted from GENCODE mm10 vM15. Repeat subfamily enrichment was obtained from the number of Repeatmasker elements overlapped with cytoDNA regions. Percentage for each subfamily over the total number of overlapped elements was compared with the genomic percentage, keeping those with over 1.5-fold enrichment; p value was calculated by hypergeometric test. Compartmentalization score data were obtained from mouse embryonic stem cells J1 Hi-C data (Jiang et al., 2020). Briefly, A/B compartments were called by cooltools v0.3.2 call-compartments (Sergey et al., 2020) at 100-kbp resolution. Compartment A was defined based on negative correlation with H3K9me2 data. hypergeometric optimization of motif enrichment (HOMER; Heinz et al., 2010) findMotifsGenome. pl was used for motif enrichment, where both chrUn and non-chrUn regions were analyzed together.
RPKM clustering
RPKM for merged regions was k-means clustered (k = 20 for nonchrUn, k = 10 for chrUn) using Cluster 3.0 (city-block distance) and visualized by JavaTreeView (de Hoon et al., 2004).
Circos plot
Circos plot was visualized using circos v0.69.9 (Krzywinski et al., 2009), where the RPKM scale was set to 0–500.
Results
ATM inhibition induces DNA export from the nucleus to cytoplasm
We previously reported that cytoDNA accumulates in microglial cells after inhibition of DNA repair. Specifically, treatment with the ATM inhibitor, KU-60019 (1 μM), led to an increase in cytoDNA immunostaining signal, coupled with a decrease of nuclear DNA content, as detected by DAPI staining assay (Song et al., 2019). While these findings suggest a nuclear origin for cytoDNA, we sought to further validate this conclusion. We first confirmed the increase in DNA damage after inhibition of repair by blocking ATM kinase activity both in vitro and in vivo. Wild-type microglial cultures were treated with etoposide, a topoisomerase inhibitor, to trigger DNA double-stranded breaks. Etoposide treatment significantly increased the formation of MRN (MRE11-RAD50-NBS1) complexes as indicated by immunostained foci of NBS1 (Fig. 1A). With normal ATM function, we also observed the co-localization of phosphorylated histone variant H2AX, γH2AX, with NBS1 (Fig. 1A, upper panel), indicating the initiation of DNA damage repair process. In Atm knock-out microglia, however, etoposide only induced formation of the MRN complex, but not the foci of γH2AX (Fig. 1A, lower panel). Western blottings of microglial cultures exposed to the same conditions, and immunostaining of wild-type and Atm-/- mouse brains confirmed this finding (Fig. 1B–D). ATM deficient microglia exhibit a more active morphology with round soma and retracted processes (Fig. 1E). This is also true for cultured microglia where application of an ATM inhibitor increased the percentage of active microglia by >4-fold (data not shown). Moreover, when we stained Atm-/- mouse brain sections with an antibody that specifically binds to the blunt ends of dsDNA, we observed a significant increase in the amount cytoplasmic DNA fragments in resident microglia coupled with the appearance of an active morphology in brains (Fig. 1E).
Figure 1.

ATM inhibition induces DNA export from nucleus to cytoplasm. A, Microglia from both wild-type (WT) mice (upper panel) and Atm knock-out mice (lower panel) were cultured with or without etoposide for 12 h. Cells were immunolabeled with anti-NBS1 (green), γH2AX (red), and DAPI (blue) for nuclear labeling (scale bar: 20 μm). B, Western blottings of γH2AX in cell lysates of primary cultured microglia from WT mice and Atm knock-out mice. Cells were treated with or without etoposide for 12 h before harvest. GAPDH served as a loading control. C, Quantification of the blots shown in B; n = 2 independent cultures. Error bars indicate SEM; **p < 0.01, by unpaired t test. D, Representative images of microglia, labeled with anti-Iba1 antibody (yellow), NBS1 (green), and γH2AX (red) in cerebellum of wild-type and Atm-/- animals. E, Representative images of microglia, labeled with anti-Iba1 (red) and anti-dsDNA (green) antibodies in cerebellum of wild-type and Atm-/- animals. DAPI (blue) was used for nuclear labeling (scale bar: 20 μm). F, Diagram showing the configuration of the transwell system. G, Quantification of cell number in cultures treated with KU-60019 (n = 3–4 independent cultures). Error bars indicate SEM; ns = no significant difference by unpaired t test. H, Microglia from WT mice were immunolabeled with anti-dsDNA (green) and Hoechst for nuclear labeling (scale bar: 20 μm). I, In situ detection of fragmented DNA using the TUNEL reaction (green) in primary cultured microglia with (right) or without (left) KU-60019 treatment. Nuclei were counterstained with DAPI (blue). J, TUNEL reaction (green) in microglia treated with (right) or without (left) etoposide. K, L, Quantification of both cytoplasmic (K) and nuclear (L) TUNEL intensity was performed by measuring the intensity of the TUNEL signal in nuclei (ROI identified as illustrated with the white dash line). Cytoplasmic intensity was measured in cell profiles (a typical ROI is illustrated by the orange dashed line). Measurements from three to four independent cultures. Error bars indicate SEM; **p < 0.01, ***p < 0.001, by unpaired t test. M, N, Quantification of fluorescence intensity in both cytoplasm (upper) and nucleus (lower) of cells showed in L; ****p < 0.0001, by unpaired t test. O, P, Quantification of TUNEL signal intensity in cytoplasm (O) and nucleus (P) from HEK 293 cells cultured with DMSO, KU-60019, and etoposide, respectively. Error bars indicate SEM; **p < 0.01, ***p < 0.001, by unpaired t test. Q, Microglia from wild-type mice were treated with or without KU-60019 as indicated for 48 h. Cells were then immunolabeled with anti-H3K9me3 (green), anti-dsDNA (red), and DAPI (scale bar: 20 μm). White arrow illustrates the cytoplasmic co-localization of H3K9me3 and dsDNA. R, Representative images of microglia in control and KU-60019-treated cultures. Cells were labeled with H3K9ac (green), anti-dsDNA (red), and DAPI. S, Microglia from both WT mice (upper panel) and Atm knock-out mice (lower panel) were immunolabeled with anti-H3K9me3 (green) and anti-dsDNA (red) antibodies. Nuclei were counterstained with DAPI (blue). White box was showing the selected area with H3K9me3 and dsDNA co-localization. T, Microglia from both wild-type and Atm knock-out mice were stained with MitoTracker (green) and anti-dsDNA antibody (red). DAPI was used to indicate cell nucleus (scale bar: 10 μm). U, MitoTracker-Green and TUNEL (red) double labeling of wild-type microglia treated with KU-60019 (lower panel) for 48. An untreated control cell is showed in upper panel; all cells were counterstained with DAPI. White box selected area was showed with higher magnification on the right.
To eliminate the possibility that cytoDNA originated from fragments scavenged from surrounding dead cells by phagocytosis, we employed a transwell system. Microglia stained with Hoechst dye were plated in the upper well, while the bottom well contained only unlabeled microglia (Fig. 1F). The entire culture system was then treated with KU-60019. Consistent with our previous observations (Song et al., 2019), a 48-h treatment with KU-60019 resulted in a significant increase of double stranded (ds) cytoDNA with no significant cell death (Fig. 1G). Yet when we assayed the unlabeled cells in the bottom well, we found no detectable Hoechst signal in the cytoDNA, which would be expected if any cytoDNA had come from cells in the upper well (Fig. 1H). To further test whether cytoDNA resulted from the accumulated nuclear DNA damage, we employed the TUNEL assay. After ATM inhibition, the TUNEL signal increased in both cytoplasmic and nuclear locations (Fig. 1I,K,L). DNA damage induced with the genotoxic reagent etoposide yielded analogous effects (Fig. 1J,M,N). Intriguingly, this result was also observed in other dividing cell types such as HEK293 cells (Fig. 1O,P). Meanwhile, some of the cytoDNA found in microglia treated with KU-60019 was located in puncta that were enriched with histone H3 lysine 9 tri-methylation (H3K9me3), a repressive histone modification (Fig. 1Q), and γH2AX (data not shown). By contrast, no histone H3 lysine 9 acetylation (H3K9ac; a histone modification associated with activation) was detected in the cytoplasm (Fig. 1R). This is also true in cultured microglia from ATM knock-out mice (Fig. 1S).
ATM dysfunction results in the maldevelopment of mitochondria and cytoplasmic DNA can also result from mitochondrial damage (Kim et al., 2019). This opens the possibility that the mitochondria, as well as the nucleus contribute to the accumulation of cytoDNA in ATM-deficient conditions. To test this, we examined wild-type microglial cultures after inhibition of ATM and detected no obvious morphologic abnormalities in the mitochondria in cells with KU-60019. Further, cytoDNA as revealed by TUNEL (Fig. 1Q, red), only occasionally overlapped with mitochondrial dyes (Fig. 1Q, green). We pursued this question further by culturing microglia from Atm-/- mice. We observe an altered tubular and dynamic network of mitochondria in ATM deficient microglia (Fig. 1R, green) along with an increase of mitochondrial fusion in the absence of ATM. Yet, even in these more challenged cells, cytoDNA staining only rarely overlapped with mitochondria. In the aggregate the data strongly support the predominantly nuclear origin of cytoDNA.
CytoDNA consists of linear AT-rich genomic sequences
We confirmed earlier findings (Xu et al., 2014; Berger et al., 2017) that DNA oxidation is more prevalent in the absence of ATM (Fig. 2A,B). Given that this oxidized DNA could lead to the production of extrachromosomal circular DNA molecules (Ain et al., 2020; Moller, 2020), we sought to determine whether the KU-60019-induced cytoDNA was linear or circular in structure. The nuclear and cytoplasmic fractions of control and KU-60019-treated microglia were isolated and DNA from each compartment was purified and digested with Exonuclease V (RecBCD), which is only able to cleave linear DNA molecules. While control circular plasmid DNA was unaffected, both the nuclear and cytoplasmic fractions from control and KU-60019-treated cells were completely digested (Fig. 2C). We conclude from this that cytoDNA consists of mostly linear DNA fragments.
Figure 2.

Distribution and characteristics of cytoDNA. A, Microglia in control and KU-60019-treated cultures were stained with 8-oxoguanine (left). The histogram represents the quantification of total fluorescent intensity of cells shown in the left panel. Error bars indicate SEM; ****p < 0.0001, by unpaired t test. B, Oxidative stress was measured in microglia from control and KU-60019-treated cultures using CellRox. Quantification of CellRox intensity (right panel). Error bars indicate SEM; ****p < 0.0001, by unpaired t test. C, Quantification of nuclear DNA (nuDNA) and cytoDNA concentrations after Exonuclease V (RecBCD) digestion. Oligomers and circular plasmid DNA were used as positive and negative control, respectively. Error bars indicate SEM. D, Schematic for cytoDNA purification and sequencing. Cultured microglia were lysed, and low-speed centrifugation was used to separate the organelles (pellet) from the cytoplasmic fraction (supernatant). Both fractions are digested with RNase A and Proteinase K before DNA purification by phenol-chloroform extraction. PCR for nuclear gene Oct4 and mitochondrial genes ND1 and 16S rRNA were performed for the organelle fraction validation. CytoDNA gel shows a smear of fragment sizes, with a large proportion of fragments around 100 bp. CytoDNA is then prepped for sequencing (far right).
Next, to ask what the genomic origins of the linear fragments might be, we characterized the sequence features of cytoDNA using a whole-genome approach. After quantification and size distribution analyses, we constructed libraries for NGS. To avoid amplification bias, we prepared PCR-free libraries, which all had high mapping rates (>80%) to the mouse genome. We termed this approach cytoDNA-seq (Fig. 2D). Previous reports have demonstrated that the depletion of ATM leads to mitochondrial dysfunctions and extra-chromosomal telomeric DNA (Hande et al., 2001; Valentin-Vega et al., 2012). Therefore, despite the morphologic data (Fig. 1T,U), we first asked whether any mitochondrial DNA (mtDNA) contributed to cytoDNA accumulation induced by KU-60019 treatment. Given the separation protocol employed, intact mitochondria and their constituent DNA was expected to be present in the nuclear fraction, which we confirmed by PCR (Fig. 2D). By contrast, of total cytoDNA reads, only a small percentage mapped to mtDNA (<0.25%), which was in line with the preservation of mitochondrial integrity (Fig. 1J). Scanning for the telomeric TTAGGG motif (Meyne et al., 1989) among the cytoDNA reads revealed that only a small percentage of reads contained mouse telomeric sequences (control replicates = 1.00% and 1.11% and KU-60019-treated replicates = 0.85% and 0.97%). Taken together, the results indicated that mitochondria and telomeres were unlikely to be the sources of cytoDNA in our system.
To delineate the precise sequence and origins of these molecules, genome-wide cytoDNA-seq normalized enrichment was calculated. Segmenting the genome into 100-bp bins, we focused on those bins with >10 times higher RPKM values than the global mean, which we define as enriched with cytoDNA-seq signal. It is worth noting that a considerable percentage of bins (control replicates = 69% and 72%; KU-60019-treated replicates = 39% and 44%) fell within blacklist regions as defined by the Encyclopedia of DNA elements (ENCODE; ENCODE Project Consortium, 2012). As these regions are prone to alignment artefacts, bins with this potential issue were filtered out. Interestingly, we also discovered enrichment on many parts of the “unassigned chromosome” (ChrUn), which is a pseudo-chromosome with concatenated contigs that cannot be confidently mapped to a single site in the genome. Although their exact location is unknown, their relative position within the contigs is accurate (Mouse Genome Sequencing Consortium et al., 2002). Strikingly, while ∼70% of bins enriched with signal from control samples were located on ChrUn, only ∼11% from KU-60019-treated samples were similarly aligned. Therefore, our subsequent analyses separated the ChrUn and assigned parts of the genome.
As we have noted, KU-60019 treatment led to a 3-fold increase in cytoDNA production. In line with this finding, we found a substantial increase in the number of regions with cytoDNA-seq signal on KU-60019 treatment. These 100-bp bins were distributed across all chromosomes and showed similar patterns among experimental replicates (Fig. 3A). Intriguingly, while regions aligning to ChrUn showed enrichment in both control and KU-60019-treated samples, the signal in the rest of the genome appeared specific to KU-60019-treated cells (Fig. 3B,C). Base composition analysis in these regions showed a significant enrichment for A and T nucleotides (Fig. 3D), compared with shuffled genomic regions (Fig. 3E,F). This was especially evident in KU-60019-treated regions and less so in control, possibly because of the low number of control regions. Previously, it was reported that AT-rich DNA was associated with fragile sites in the human genome, owing to its ability to form secondary hairpin structures (Lukusa and Fryns, 2008). These results suggested that cytoDNA originated from genomic loci that are more prone to DNA damage
Figure 3.

A, Circos plot shows distribution of cytoDNA regions in a control and KU-60019-treated samples from two replicates. Outermost ring shows karyotype banding, followed by compartment A (pink) and B (green) definition. Innermost ring shows control (blue) and KU-treated (red) cytoDNA-seq signal (RPKM), where the scale is set to 0–500. B, Heatmap visualization of non-chrUn cytoDNA region RPKM in two sets of replicates. C, Heatmap visualization of chrUn cytoDNA region RPKM in two sets of replicates. D, Base composition analysis showing enrichment of A and T bases in merged KU-treated cytoDNA replicates. E, F, Line plots showing -log10 p values for A (E) and T (F) base enrichment over 300 shuffled regions; p value was calculated by one-tail t test.
Excised cytoDNA is enriched with repetitive elements and repressive epigenomic features
In dissecting the genomic features of cytoDNA, we merged adjacent bins with cytoDNA-seq signal to produce merged regions or peak definitions. While we observed that most cytoDNA regions ranged from 100 to 300 base pairs (Fig. 4A), the actual cytoDNA signal was often much shorter (∼80 bp) but overlapped two adjacent 100-bp bins. We also observed that cytoDNA merged peaks were significantly closer in linear distance to one another as compared with distance for shuffled control regions (Fig. 4B). These data supported the notion that specific clustered genomic regions were more susceptible to excision and that cytoDNA release was not a random event. Intriguingly, up to 99% of the merged peaks overlapped with repetitive elements (RepeatMasker v4.0.7; Fig. 4C). We found simple repeat elements were enriched in both control and KU-60019-treated regions, with retrotransposons differentially enriched. Control regions showed distinct enrichment of L1 LINE elements whereas regions induced by KU-60019 treatment were significantly enriched for ERVL-MaLR elements (Fig. 4D,E). Collectively, these results revealed that cytoDNA consisted of specific classes of repetitive sequences. Upon DNA damage repair inhibition, the increase in number of cytoDNA regions was accompanied by changes in enriched repeat subfamilies.
Figure 4.
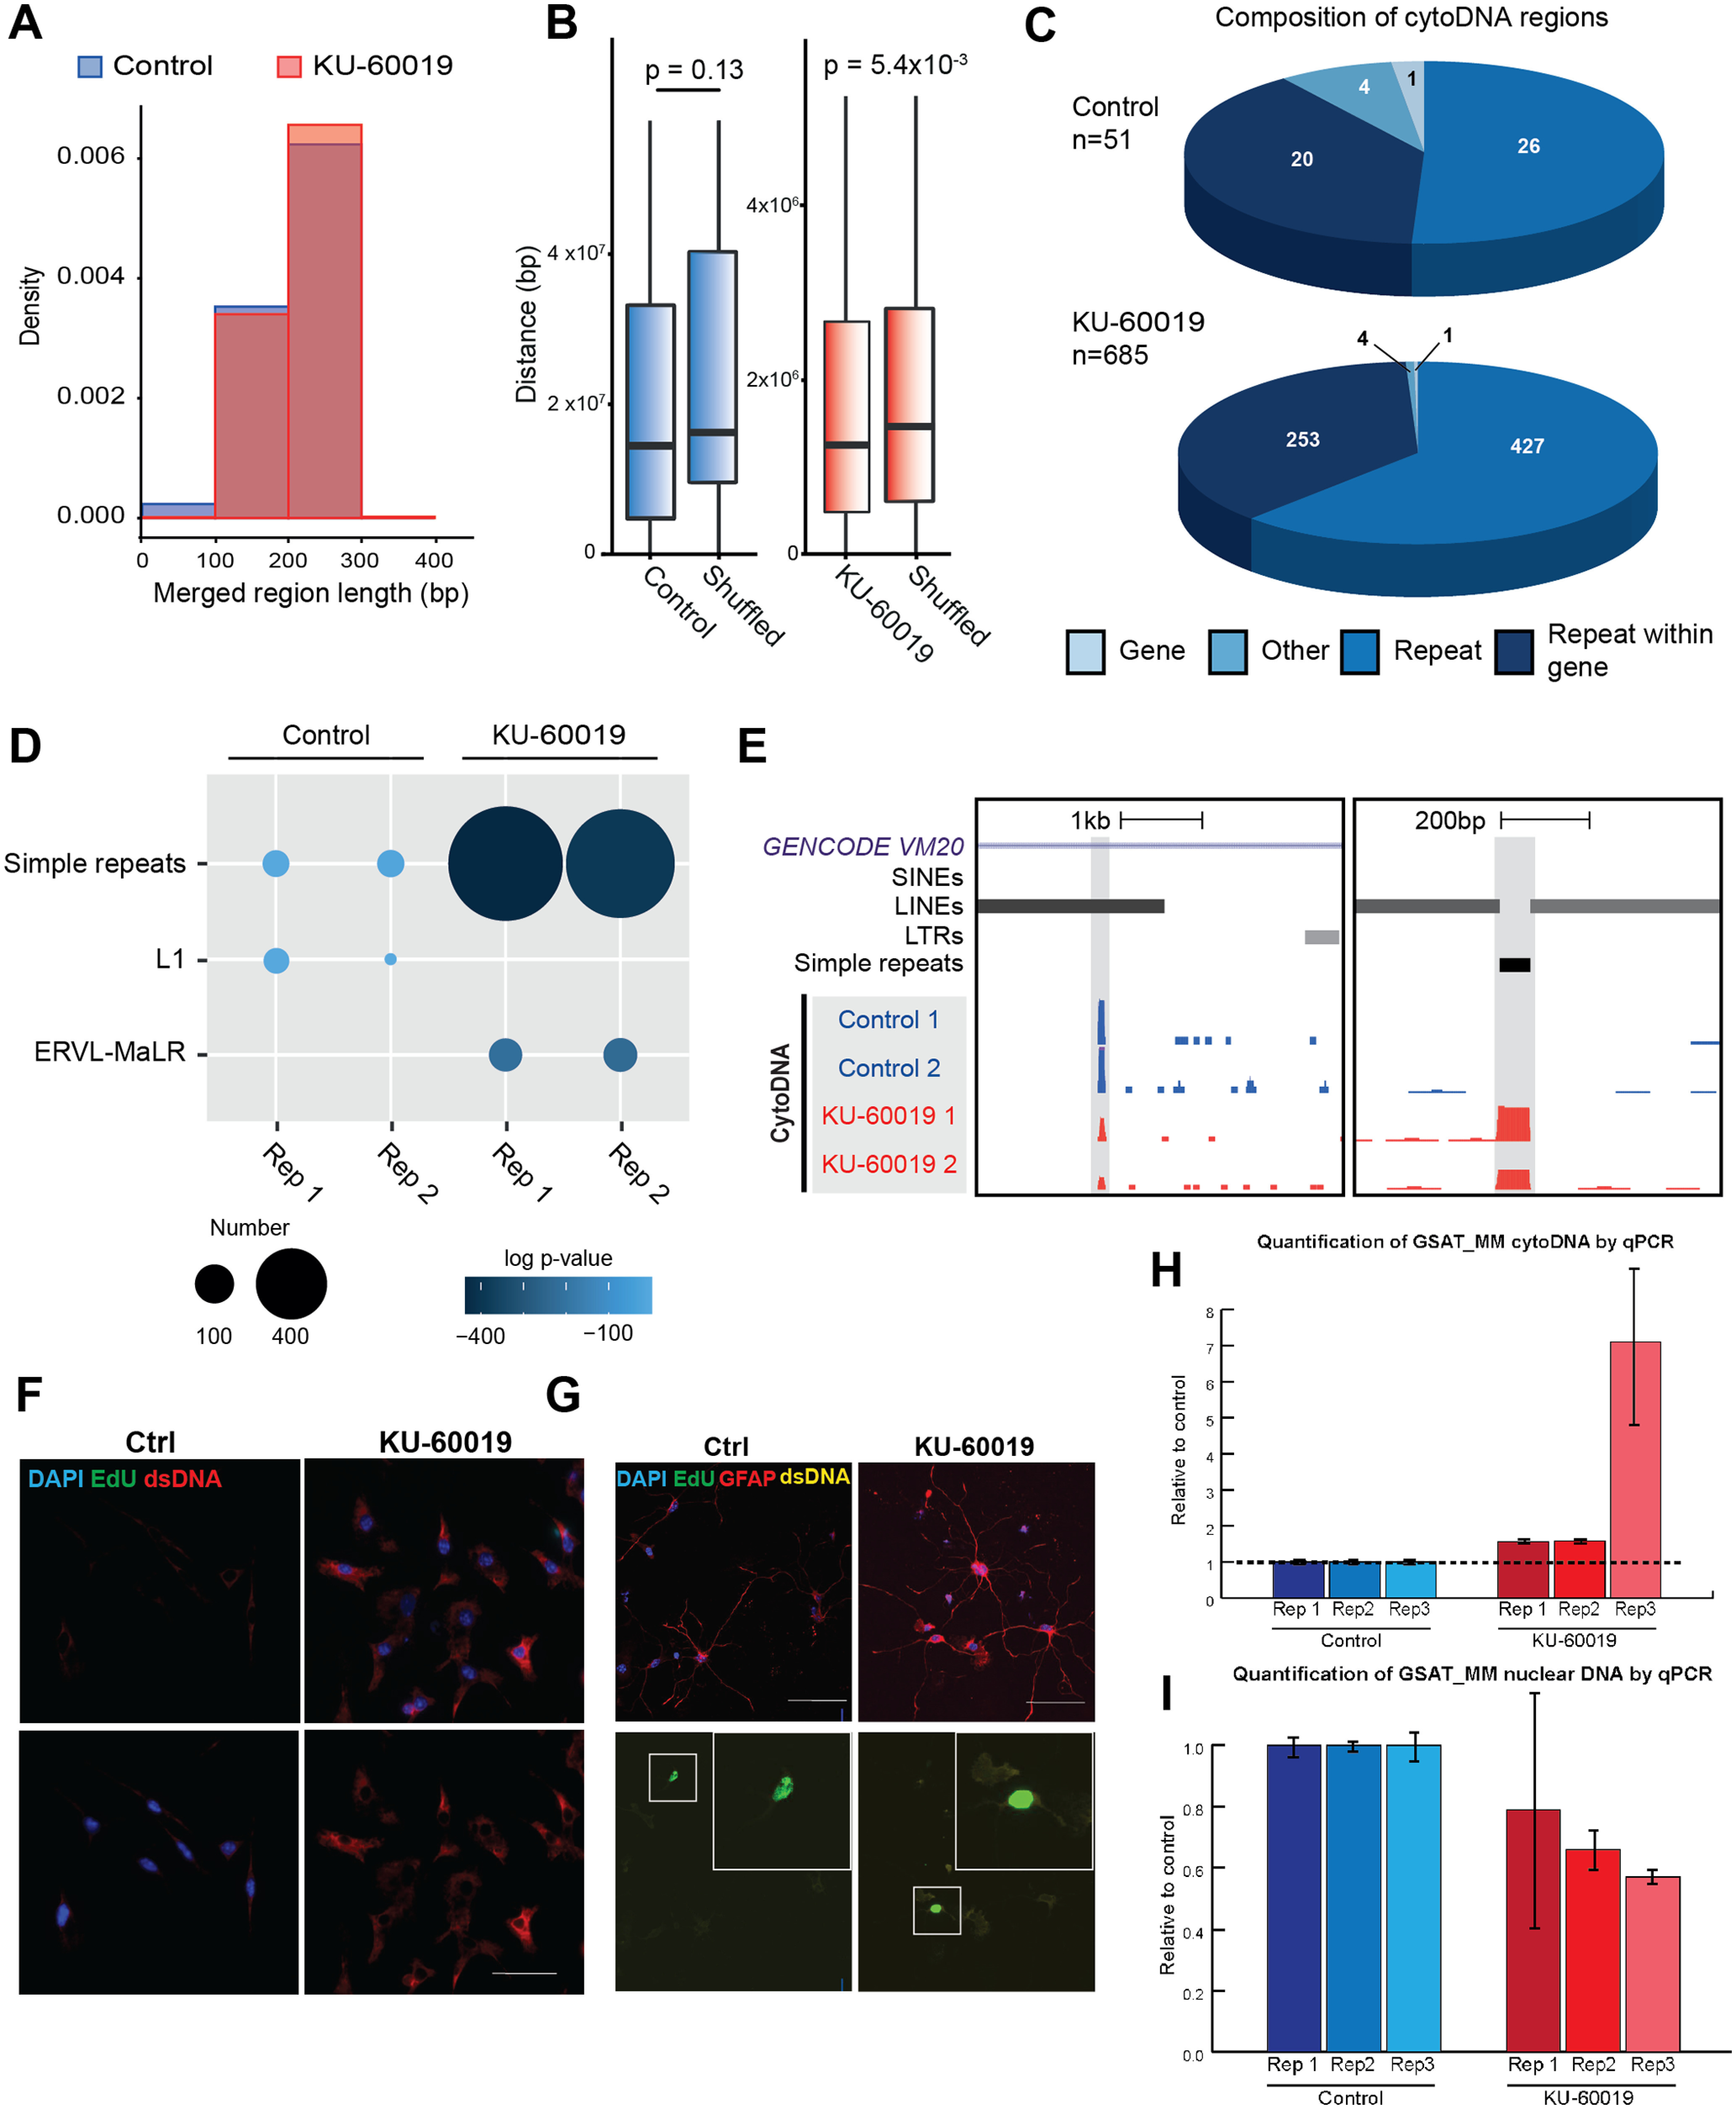
Genomic features of cytoDNA. A, Frequency density histogram showing length of merged cytoDNA regions in control (blue) and KU-treated (red). B, Boxplot showing linear distance analysis for each cytoDNA bin compared with other regions in the sample or to randomly shuffled regions; p value was calculated by Wilcoxon test. C, Pie charts visualizing genomic features that overlap with cytoDNA regions for a single replicate. D, Bubble plot representing enrichment of repetitive subfamilies in control and KU-treated. Size of the dot represents the number of elements and the color shows log p value calculated by hypergeometric test. E, Genome browser screenshots displaying examples of a cytoDNA bin called in control and KU-treated samples, respectively, from two regions (left: chr1:107,919,327–107,931,928 and right: chr1:109,563,239–109,563,886). Y-axis for cytoDNA tracks show raw signal. Left: 1–13; right: 1–31. Gray boxes show defined cytoDNA regions. F, Primary cultured microglia treated with or without KU-60019 was labeled with Iba1 (red) and EdU (green). Scale bar: 50 μm. G, Primary cultured mouse astrocytes are treated with or without KU-60019. Cells were labeled with Iba1 (GFAP) and EdU (green). Scale bar: 50 μm. H, I, Bar plots showing enrichment of GSAT_MM elements in KU-treated cytoDNA by qPCR compared with control (H), and depletion from the nuclear fraction (I). Shown here are three biological replicates, and error bars show SD for technical replicates.
Given that retrotransposons have the capacity to “copy and paste” themselves, new reverse transcription events could potentially be the source of cytoDNA. Hence, we asked whether cytoDNA was excised from genomic DNA or represented newly synthesized sequences using EdU labeling of microglial cultures before KU-60019 treatment. After 48 h, KU-60019-treated microglial cells showed substantial amounts of cytoDNA; however, no nuclear or cytoplasmic EdU signal was detected (Fig. 4F). Serendipitously, our cultures contained a few mitotic astrocytes, which served as internal controls for the EdU labeling. These GFAP-positive cells represented <1% of the total population, yet because they were mitotically active, their nuclei were frequently labeled with EdU (Fig. 4G). Strikingly, KU-60019 induced the appearance of cytoDNA in astrocytes at levels comparable to microglia (Fig. 4F,G), yet no cytoplasmic EdU labeling was detected. Taken together, the data revealed that the fragments that make up cytoDNA were likely excised from genomic DNA and did not represent newly synthesized retrotransposons.
Because of their repetitive nature, it was unsurprising to find a substantial percentage of sequencing reads with multiple alignments. These reads would generally be discarded, as they cannot be uniquely mapped to a single locus. To derive information from the multialigned reads, we employed an iterative mapping pipeline to obtain information for multialigned reads that anchor to specific repeat subfamilies (Jiang et al., 2020). Strikingly, we discovered that GSAT_MM, a satellite repeat, was the top enriched repeat among control and KU-60019-treated samples. Quantitative PCR was conducted to validate the presence of GSAT_MM sequences in cytoDNA alongside corresponding nuclear DNA (Fig. 4H,I). Consistent with the EdU staining results that indicated cytoDNA originated from the nuclear genome, increased GSAT_MM was detected in KU-60019-treated cytoDNA and was concordantly depleted from the nuclear fraction. This provided additional evidence that cytoDNA molecules were not newly synthesized after ATM inhibition.
In line with the enrichment of repetitive elements, cytoDNA-seq peaks were associated with epigenomic and chromatin state features of inactive genomic regions. Nuclear compartment A and B are higher-order chromatin structures defined from Hi-C (high-throughput chromatin conformation capture) data. These regions are associated with active and repressive epigenetic features, respectively. In particular, genomic regions in compartment B are associated with the nuclear periphery and a number of repressive epigenetic modifications. Although some compartments differ between cell types, most definitions remain cell type invariant. Using published high throughput Hi-C data from mouse embryonic stem cells, we demarcated compartments A/B and analyzed where cytoDNA peaks resided. In both control and KU-60019-treated cells, we found that cytoDNA tended to be located in the inactive compartment B (Fig. 5A). Furthermore, integrating epigenomic datasets revealed that cytoDNA loci, especially those on ChrUn, were significantly enriched with the repressive heterochromatic H3K9me3 modification (P0 mouse forebrain; He et al., 2020; Fig. 5B), consistent with our immunocytochemistry results (Fig. 1I). Remarkably, low to no enrichment was detected for all other analyzed histone modifications (Fig. 5C,D). These findings were in line with previous literature showing heterochromatic or inactive regions of the genome to be more prone to DNA damage (Schuster-Böckler and Lehner, 2012) where ATM serves a major repair function (Goodarzi et al., 2008). Finally, HOMER analysis of control and KU-60019-treated cytoDNA reads showed differential enrichment of transcription factor binding motifs. In control peaks, immune-signaling related (Macián et al., 2001; Park et al., 2020) NFAT motifs were significantly enriched, whereas KU-60019-treated peaks were enriched with Oct6, Zac1, and Smad4 motifs, which are reported to be involved in DNA damage responses (Fig. 5E; p.1 in Huang et al., 2001; p.4 in Zhao et al., 2018; p.6 in Fionda et al., 2019). Taken together, our analyses revealed that cytoDNA originated from inactive parts of the genome associated with the nuclear periphery.
Figure 5.

Epigenetic features of cytoDNA. A, Bar plot representing percentage overlap (in base pairs) of cytoDNA regions with compartment A and B compared with randomly shuffled regions; p value was calculated by hypergeometric test (****p ≤ 0.0001). B, Boxplots show H3K9me3 input-subtracted RPKM values for non-chrUn chromosomes (left) and chrUn chromosomes (right). Control and KU-treated regions were compared with random shuffled; p value was calculated by Wilcoxon test. C, D, Boxplots show various histone-modification input-subtracted RPKM values for non-chrUn chromosomes (C) and chrUn chromosomes (D). Control and KU-treated regions were compared with random shuffled regions; p value was calculated by Wilcoxon test. E, Results from motif analysis for control (left) and KU-treated (right) regions. The tables display motifs with q value (Benjamini) < 0.05 for both replicates.
Excised cytoDNA is actively exported from the nucleus
We then asked how cytoDNA finds its way to the cytoplasm. While it is possible that some fragments passively leak out, we found that most are actively exported. Pretreating the cells with LMB, a nuclear export inhibitor that blocks CRM1 activity (Kudo et al., 1998, 1999), virtually abolished the accumulation of cytoDNA on KU-60019 treatment (Fig. 6A,D). We had shown previously that conditioned media from KU-60019-treated microglia had neurotoxic effects when applied to established neuronal cultures (Song et al., 2019). Strikingly, along with the decrease in cytoDNA, the neurotoxicity of the conditioned medium was significantly attenuated by LMB pretreatment. In particular, the atrophic appearance of the neurons (cell density and dendritic branching complexity) after exposure to medium from KU-60019-treated microglia was largely, but not completely, blocked by pretreatment with LMB (Fig. 6B). Moreover, the reduced number of synapses (puncta of synapsin-I labeling) caused by KU-60019 conditioned medium was also prevented (Fig. 6C,E). These observations demonstrate that CRM1 is important for exporting cytoDNA from the nucleus and that it is most likely cytoDNA itself, rather than some other side effect of ATM deficiency, that plays the dominant role in inducing the neurotoxic phenotype of the microglial conditioned medium.
Figure 6.

cytoDNA was exported to the cytoplasm in a CRM1-dependent manner. A, Microglial cultures were pretreated with LMB 30 min before applying KU-60019 or DMSO (ctrl). Cells were immunostained for dsDNA (red) and counterstained with DAPI (scale bar: 20 μm). B, Cortical neurons treated with microglial conditioned media. Microglia were treated with KU-60019 and/or LMB for 48 h, after which their medium was withdrawn and added to previously established neuronal cultures (DIV14) for an additional 24 h, then fixed and immunostained. Neurons were labeled with anti-MAP2 (red), and plus DAPI (blue) for nucleus. C, Presynaptic terminals were immunolabeled with synapsin-I (green); dendrites were immunolabeled with MAP2 (red). DAPI was used as a nuclear counterstain (scale bar: 100 μm). D, Quantification of dsDNA signal intensity of individual microglia from the cultures illustrated in panel A; n = 100 microglia from three independent cultures. Error bars indicate SEM; **p < 0.01, by unpaired t test. E, Quantification of synapsin-I puncta in neurons such as those illustrated in panel C; n = 20–30 neurons from three batches of neuronal cultures. Error bars indicate SEM; ***p < 0.001, by unpaired t test.
CytoDNA is degraded by the Trex1 exonuclease
Given the potency of accumulated cytoDNA in triggering microglial immune response and the following neurotoxicity, we ask whether targeting cytoDNA clearance could be a promising strategy for dampening sterile inflammation and its consequences. One potential candidate for catalyzing the degradation of cytoDNA is Trex1, a well-described cytoplasmic 3′→5′ DNA exonuclease. Consistent with previous studies showing that mutation of Trex1 triggered a DNA dependent innate immune response, Trex1 knock-down in microglia resulted in a significant increase of cytoDNA accumulation, even in the absence of KU-60019 treatment (Fig. 7A). This result not only demonstrated that excess cytoDNA can be degraded by Trex1, it also strongly implied that in wild-type microglia, there must be a low level of constitutive cytoDNA production. In performing these experiments, we noticed that when ATM was inhibited, Trex1 immunoreactivity coalesced into distinct puncta that largely overlapped with the cytoDNA signals (Fig. 7B). A similar response was noted after etoposide treatment (Fig. 7C). The change in Trex1 localization occurred despite little change in the absolute amounts of Trex1 protein (Fig. 7D). To further demonstrate the importance of Trex1 for cytoDNA degradation, we cultured both wild-type and Atm-/- mouse embryonic fibroblasts (MEFs). As expected, cytoDNA accumulated in Atm-/- MEFs, but Trex1 overexpression completely eliminated its presence (Fig. 7E,F). Together, these findings suggest that Trex1 is responsible for the clearance of cytoDNA.
Figure 7.

CytoDNA is degraded by the Trex1 exonuclease. A, Microglia were transfected with GFP-tagged scrambled shRNA (left panel) or GFP-tagged shRNA against Trex1 (right panel, shTrex1). The transfected cells showed GFP signals. After 48 h, cultures were fixed and immunostained for dsDNA (red) and DAPI (blue) for nucleus. B, Wild-type microglia treated with KU-60019, then immunolabeled for dsDNA (red) and Trex1 (green) plus DAPI. C, Primary cultured microglia from etoposide treated and untreated cultures were immunolabeled with anti-dsDNA (red) and Trex1 (green) and counterstained with DAPI. D, Western blottings (left panel) of Trex1 in cell lysates of microglia control cultures (ctrl) or cultures treated with KU-60019. Quantification of blots (right panel); n = 4 independent cultures. Error bars indicate SEM; ns = no significant difference by unpaired t test. E, Wild-type (upper) or Atm-/- (lower) MEFs were transfected with a control GFP-expressing plasmid (left panel, green) or a Trex1-expressing plasmid (right panel, green). Cells were immunostained with antibodies against dsDNA (red). DAPI (blue) counterstain. F, Quantification of the dsDNA signal intensity of individual fibroblasts; n = 100 fibroblasts from three independent experiments. Error bars indicate SEM; ns = not significant, *p < 0.05, **p < 0.01, ***p < 0.001, by unpaired t test. G, Flow cytometry (FACS) analysis of NFκB pathway measured by phospho-p65, in HEK293 cells. Cells were transfected with scrambled shRNA (lower box) or mtagBFP-tagged STING-expressing plasmid (upper box) in addition to KU-60019 treatment for 48 h. The histogram shows the FACS data from 100,000 cells from left panel. H, Microglia transfected with GFP-tagged scrambled shRNA (left) or GFP-tagged shRNA against Trex1 (right) were immunostained for p65 (red) and counterstained with DAPI. I, Flow cytometry (FACS) analysis of NFκB pathway measured by phospho-p65, in HEK293 cells. Cells were transfected with expressing (1) GFP-tagged scrambled (lower box) or Trex1 (upper box) plus (2) STING expression plasmids. After transfection, cells were treated with KU-60019 for another 48 h. J, Histogram of the FACS data from 100,000 of the cells shown in I. K, Western blottings of Trex1 and IL-1β in cell lysates of primary cultured microglia. GAPDH served as a loading control. L, Quantification of the blots shown in H; n = 3 independent cultures. Error bars indicate SEM; ns = not significant; **p < 0.01, by unpaired t test.
ATM deficiency induces the accumulation of cytoDNA and the STING-dependent activation of the NFκB pathway, including nuclear translocation of the NFκB subunit, p65 (Song et al., 2019; Fig. 7G). To test the role of Trex1 in this response we first used shRNA to reduce its levels. We found that in otherwise unstimulated cells, knock-down of Trex1 alone resulted in the nuclear translocation of p65 (Fig. 7H). Conversely, Trex1 overexpression in KU-60019-treated cells rescued both the accumulation of cytoDNA as well as the NFκB response (Fig. 7I,J), including the production of the proinflammatory cytokine, IL-1β (Fig. 7K,L). Thus, Trex1, by ensuring the timely degradation of cytoDNA production, is able to negatively regulate the NFκB inflammatory response.
ATM inhibition stimulates the lysosome-autophagy pathway
In addition to Trex1, cells can also degrade DNA in the lysosome where DNase2α can be found. As activation of lysosome-autophagy pathway is observed after ATM inhibition we wished to test whether this alternative pathway was also used to rid the cell of cytoDNA. We previously reported that, in cortical neurons, treatment with KU-60019 for 24 h increased the levels of both LAMP1 and LC3-II, lysosomal and autophagosomal markers, respectively (Cheng et al., 2018, 2021). We found that this response also occurred in microglia. Treating microglial cultures with KU-60019 led to increased protein levels of both LAMP1 and LC3-II (Fig. 8A), and the clustering of lysosomes in the perinuclear region of the cell (Fig. 8B,C). While in control cells, lysosomes showed an even distribution pattern across the whole cell, KU-60019 treatment significantly increased the aggregation near the nucleus (Fig. 8C, the location of the nucleus is indicated by the blue box). This result is consistent with our earlier findings and the lysosomal activation found with ATM dysfunction by others (Ba et al., 2018; Cabukusta and Neefjes, 2018). Rapamycin, an inhibitor of the mTOR pathway, was used as a positive control (Fig. 8B). KU-60019-treated microglia also demonstrated greatly enlarged puncta of the autophagy adaptor protein, p62, which is involved in shuttling cargo to the lysosome (Liu et al., 2016; Aparicio et al., 2019; Fig. 8D). Although KU-60019 treatment did not lead to significant change of total p62 intensity (data not shown), it caused the formation of p62 puncta in microglia (Fig. 8D). These biochemical and morphologic changes were typical of those found after the activation of autophagy. Consistent with an important role for the lysosome-autophagy pathway, we observed co-staining of dsDNA and both LAMP1 and LC3-II in the perinuclear regions of microglial cells after ATM inhibition with KU-60019 (Fig. 8E). We observed the same change of LAMP1 and p62 in vivo from the brains of the Atm-/- mouse (Fig. 8F), where microglia showed perinuclear re-localization of both LAMP1 and p62 (Fig. 8F). The data therefore suggest that the lysosomal pathway acts in parallel with Trex1 to ensure the degradation of cytoDNA.
Figure 8.
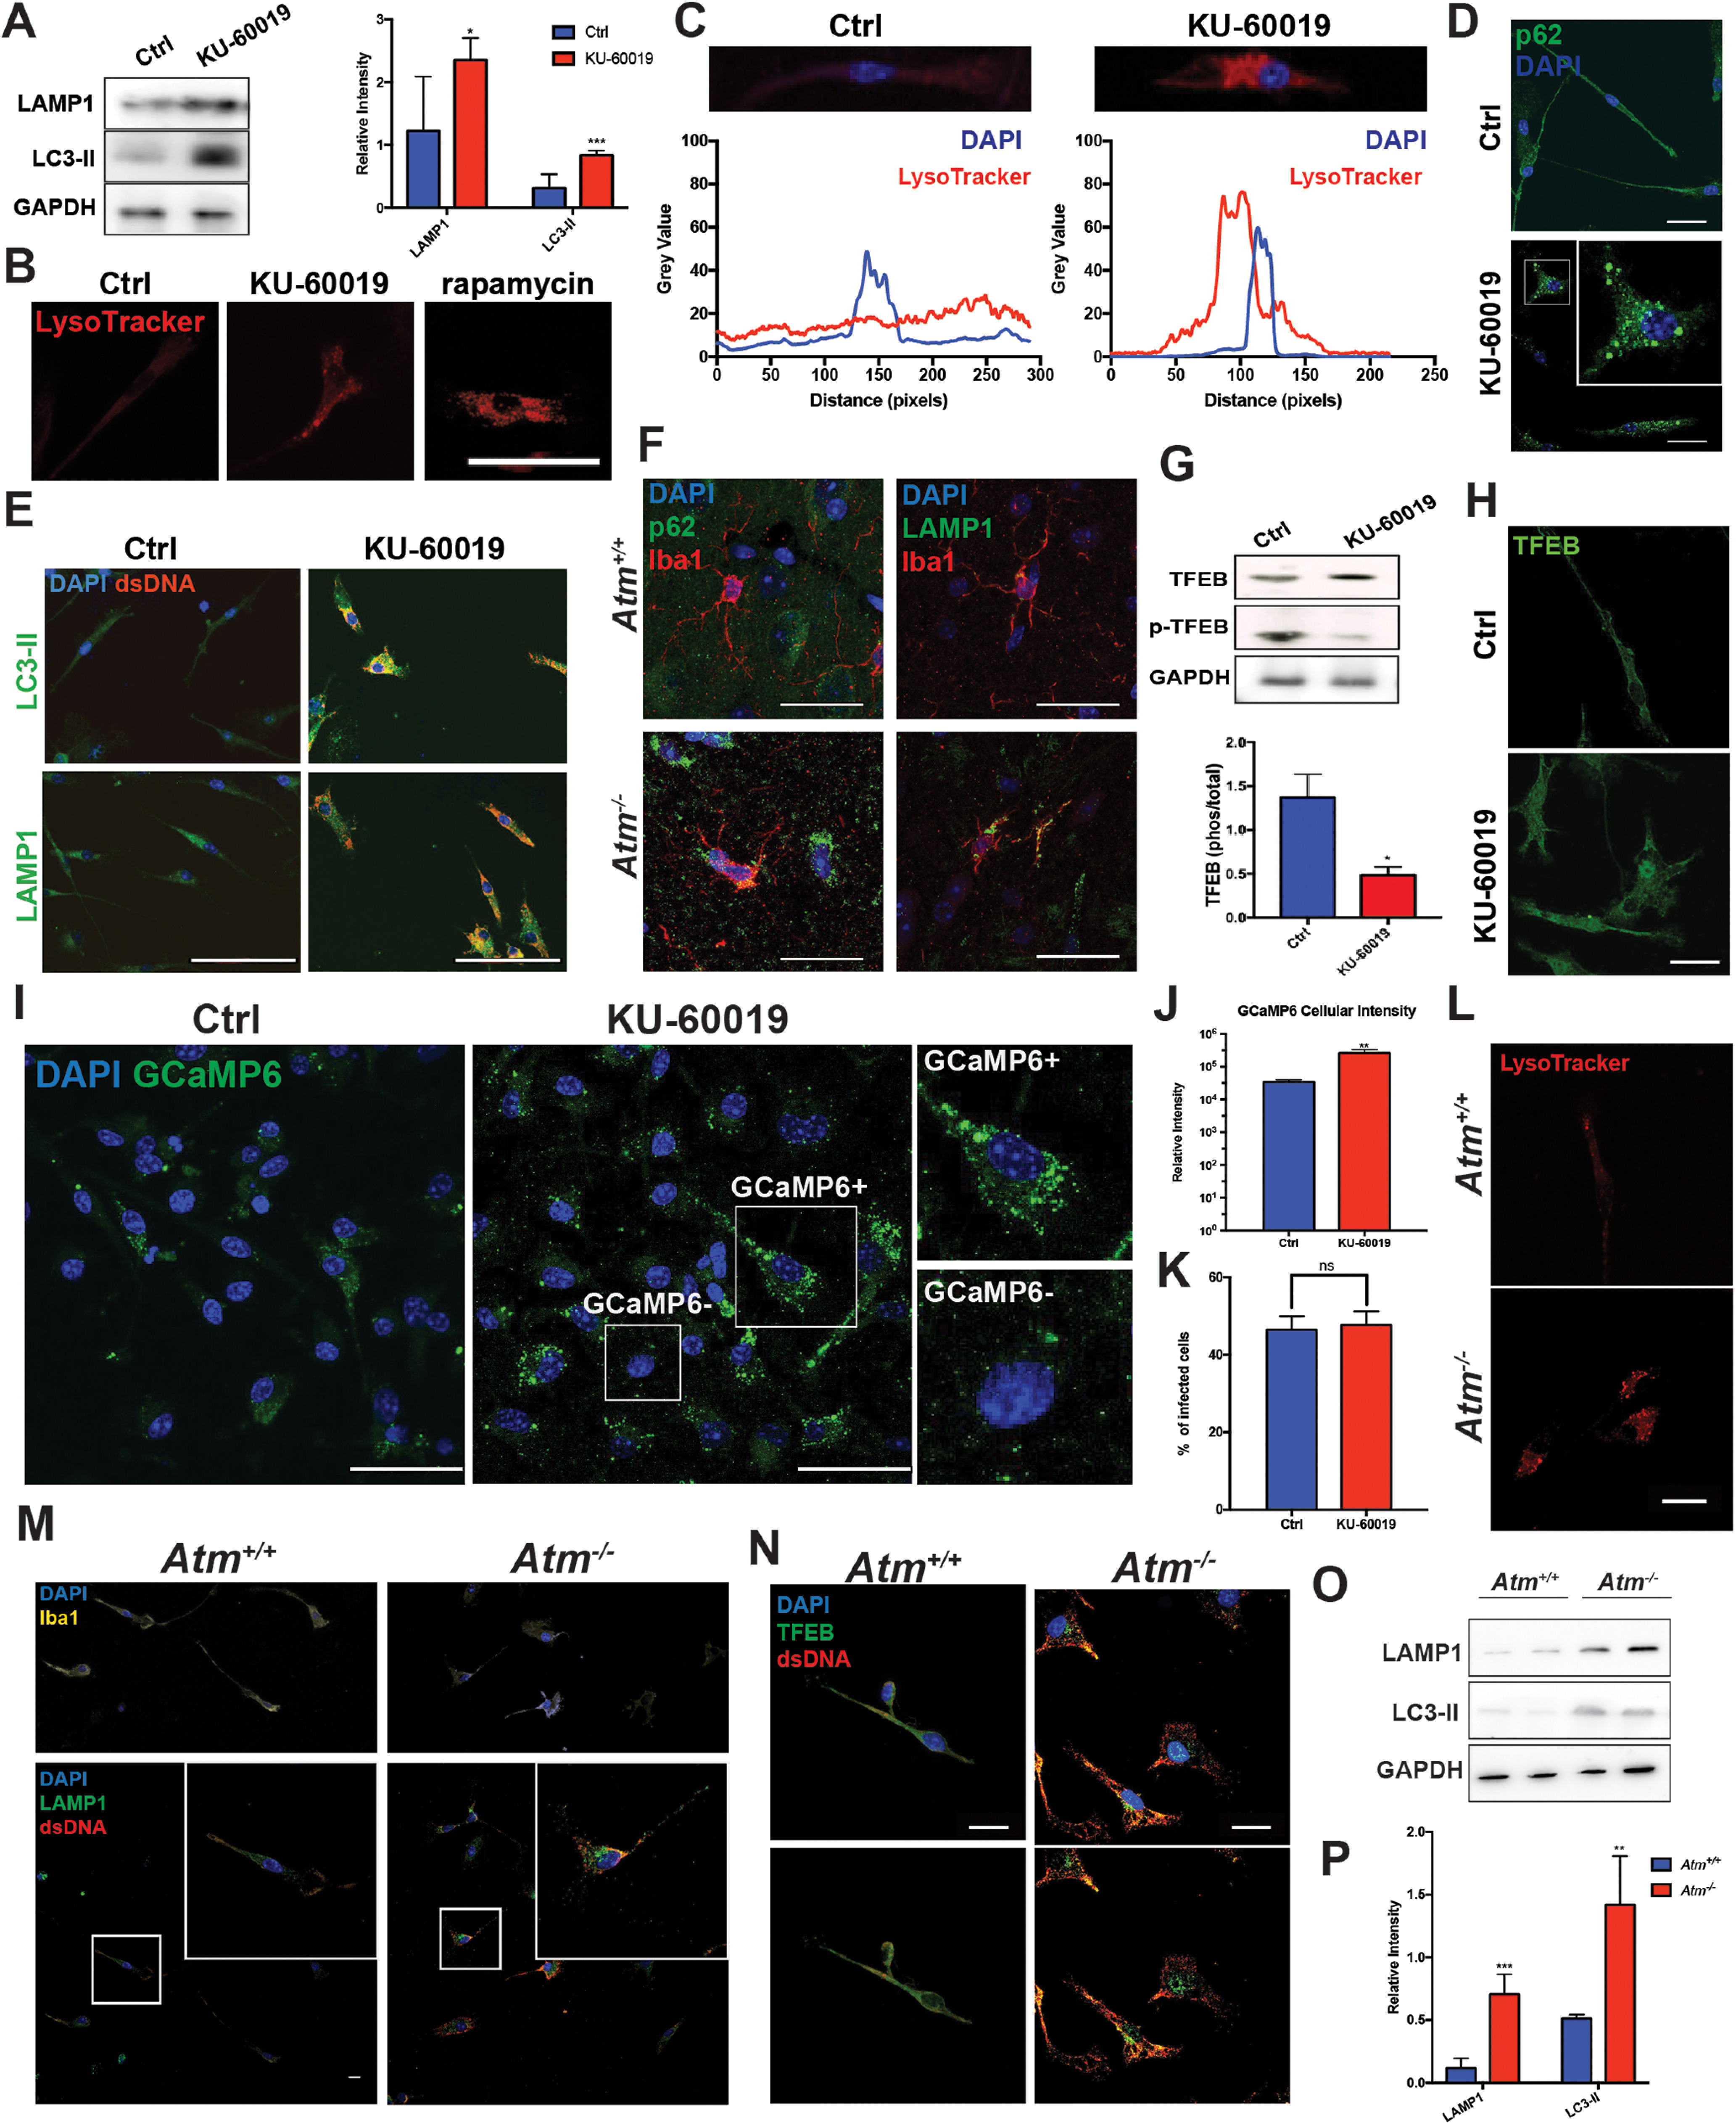
ATM inhibition stimulates the lysosome-autophagy pathway. A, Western blottings (left panel) of LAMP1and LC3-II in cell lysates of primary cultured microglia with or without KU-60019 treatment. The histogram (right panel) shows the quantification of the blots on the left. GAPDH served as a loading control. Error bars indicate SEM; n = 3 independent microglial cultures; *p < 0.05, ***p < 0.001, by unpaired t test. B, LysoTracker-Red staining of wild-type microglia, control (ctrl) or treated with KU-60019. Rapamycin treatment was used as positive control (scale bar: 20 μm). C, Quantification of LysoTracker signals in microglia treated with DMSO or KU-60019 in B. Gray values of both LysoTracker and DAPI signal were measured within the ROI as indicated in the top. D, Wild-type microglia were immunostained for p62 (green) and counterstained with DAPI (scale bar: 20 μm). E, Microglial cells were immunostained for LAMP1 (lower panel) or LC3-II (upper panel) and dsDNA (red) in both KU-60019-treated and untreated controls (scale bar: 20 μm). F, Representative images of microglia from cerebellum in wild-type and Atm-/- animals. Cells labeled with anti-p62 (left panel) or anti-LAMP1 (right panel) antibodies. Iba1 (red) was used as a microglial marker in both panels. G, Western blottings (upper panel) of total TFEB and phosphorylated TFEB (p-TFEB) in cell lysates of primary microglia cultures treated with KU-60019 or controls. Quantification (lower panel) of p-TFEB/TFEB ratio from the blots shown in F. Error bars indicate SEM; n = 4 independent cultures; *p < 0.05, by unpaired t test. H, Immunostaining of primary microglia with antibody against TFEB in KU-60019-treated and untreated cultures (scale bar: 20 μm). I, Primary cultured microglia, transduced with lentiviral vectors encoding GCaMP6, were treated with KU-60019 or left untreated as controls (ctrl). The levels of free calcium in individual cells were measured with GCaMP6 signal intensity (scale bar: 20 μm). J, Quantification of fluorescent signals of individual microglia such as those shown in I. Error bars indicate SEM. A total of 60 microglia were measured from three independent cultures; **p < 0.01 measured by unpaired t test. K, Ratio of GCaMP6 expressing cells from control and KU-60019-treated cultures showed in I. A typical expressing cell in a KU-60019 culture is illustrated in the white box labeled “GCaMP6+.” A typical non-expressing cell in the same culture is labeled “GCaMP6–”; ns = not significant as determined by unpaired t test. L, LysoTracker-Red staining of microglia from either wild-type (upper panel) or ATM knock-out mice (lower panel; scale bar: 20 μm). M, Microglial cells from both wild-type and Atm-/- mice were immunostained for LAMP1 (green), dsDNA (red), and DAPI for nuclei. Iba1 (yellow) was used in both cultures to indicate the morphology of microglia (scale bar: 20 μm). N, Microglia were cultured from either wild-type or Atm-/- mice. Cells were immunostained for TFEB (green) and dsDNA (red; scale bar: 20 μm). O, Western blotting of LAMP1, LC3-II, p-TFEB, and in cell lysates of primary cultured microglia from wild-type and Atm knock-out mice. GAPDH served as a loading control. P, Quantification of the blots in O. GAPDH served as a loading control. Error bars indicate SEM; n = 6 independent microglial cultures from six animals; **p < 0.01, ***p < 0.001, by unpaired t test.
To determine whether these responses represented short-term repositioning of proteins and organelles or a longer-term synthetic response, we examined the impact of ATM inhibition on TFEB, a transcription factor that regulates genes controlling lysosomal biogenesis (Settembre et al., 2011; Zhao and Czaja, 2012; Martini-Stoica et al., 2016; Cortes and La Spada, 2019; Di Malta et al., 2019). TFEB is dephosphorylated by the calcium sensitive phosphatase calcineurin (Tong and Song, 2015), which triggers its nuclear translocation and stimulation of lysosomal and autophagy genes (Medina et al., 2015; Tong and Song, 2015). After KU-60019 treatment, we found that phosphorylated TFEB was significantly decreased, while no significant change was observed in total TFEB protein (Fig. 8G). The dephosphorylation of TFEB was accompanied by an increase in its nuclear translocation, a requirement for its regulation of gene expression (Fig. 8H). As increased calcium is usually coupled with lysosomal activation (Morgan et al., 2015; Garrity et al., 2016), we sought to determine whether changes in intracellular calcium were involved. We measured calcium levels in microglia after KU-60019 treatment using the fluorescent calcium sensor GCaMP6 (Nakai et al., 2001; Dana et al., 2019). Following infection with lentiviral vectors encoding GCaMP6, we found a stronger fluorescent signal in KU-60019-treated microglia (Fig. 8I,J); the rate of infection of GCaMP6 (percentage of infected cells) was not altered by ATM inhibition (Fig. 8K). The altered calcium levels would be expected to activate calcineurin, which in turn would dephosphorylate TFEB leading to its nuclear localization (Medina et al., 2015). Microglia cultured from Atm-/- brain gave similar results to KU-60019 treatment. The mutant cells had a perinuclear clustering of lysosomes (Fig. 8L), an activated appearing morphology (Fig. 8M, upper panel) as well as increased cytoDNA (Fig. 8M, lower panel). Consistent with the previous finding, genetic loss of ATM induced the activation of lysosomal pathway (Fig. 8M) and TFEB-mediated lysosomal biogenesis (Fig. 8N–P).
To determine whether the lysosome/autophagy response was linked to cytoDNA accumulation and not to other features of ATM deficiency, we employed alternative methods to induce cytoDNA accumulation. Similar to ATM inhibition (Fig. 8B,C), etoposide treatment caused accumulation of cytoDNA coupled with perinuclear lysosome aggregation (Fig. 9A) and an increase in TFEB nuclear translocation (Fig. 9B,C). Likewise, Trex1 knock-down, which also triggers increased cytoDNA (Fig. 7A), led to an altered p62 distribution (Fig. 9D) as well as dephosphorylation of TFEB (Fig. 9E,H) and its nuclear translocation (Fig. 9G). Increased levels of LAMP1 and LC3-II protein were also observed (Fig. 9E,F). Finally, as predicted, Trex1 overexpression in KU-60019-treated cultures blocked the increase in both LAMP1 and LC3-II proteins levels (Fig. 9I,J). Together, these data demonstrated that the activation of the lysosomal pathway is a direct response to cytoDNA accumulation rather than an altered biological process caused by ATM deficiency.
Figure 9.

Lysosomal activation was induced by cytoDNA. A, Primary cultured microglia in control and etoposide-treated cultures were immunostained for dsDNA (red) and LAMP1 (green). DAPI (blue) counterstain (scale bar: 20 μm). B, Microglia in control and etoposide-treated cultures were immunostained for dsDNA (red) and TFEB (green). DAPI (blue) counterstain (scale bar: 20 μm). C, Quantification of images showed in B. The percentage of cells with nuclear translocation of TFEB was calculated from three independent cultures. Error bars indicate SEM; ****p < 0.0001, by unpaired t test. D, Microglia were transfected with GFP-tagged scrambled-shRNA (left panel) or GFP-tagged shRNA against Trex1 (right panel) and immunostained for p62 (red). DAPI (blue) counterstain (scale bar: 20 μm). E, Western blotting of Trex1, LAMP1, LC3-II, TFEB, and p-TFEB in cell lysates of primary cultured microglia transfected with GFP-tagged scrambled shRNA or GFP-tagged shRNA against Trex1. GAPDH served as a loading control. F, Quantification of the blots showed in D; n = 3 independent cultures. Error bars indicate SEM; *p < 0.05, ***p < 0.001, by unpaired t test. G, Microglia, transfected with GFP-tagged scrambled shRNA (left panel) or GFP-tagged shRNA against Trex1 (right panel), were immunolabeled with antibody against TFEB (scale bar: 20 μm). H, Quantification of p-TFEB/TFEB ratio shown in F. Error bars indicate SEM; *p < 0.05, by unpaired t test. I, Western blottings of Trex1, LAMP1, LC3-II, and p-TFEB in cell lysates of primary cultured microglia. GAPDH served as a loading control. J, Quantification of the blots showed in H; n = 3 independent microglial cultures were used for analysis. Error bars indicate SEM; *p < 0.05, **p < 0.01, ****p < 0.0001, by unpaired t test.
Autophagy-lysosomal pathway negatively regulates DNA-mediated immune response
Given the induction of the lysosomal/autophagy pathway in the presence of cytoDNA, we asked whether stimulating autophagy would lead to the clearing of existing cytoDNA thus attenuate the inflammatory response in microglia. As previously shown in neurons (Alexander et al., 2010; Cheng et al., 2021), rapamycin activates the autophagy/lysosomal pathway causing lysosomes to shift to the perinuclear region (Fig. 8B). Consistent with the idea that autophagy can clear cytoDNA, we found that the accumulation of microglial cytoDNA induced by KU-60019 was eliminated by co-treatment with rapamycin (Fig. 10A,B). It is noteworthy that the activation of the autophagy/lysosomal system was not associated with any change in the protein levels of the lysosomal DNase, DNase2α (Fig. 10C,D), suggesting that it is the uptake of cytoDNA rather than increased lysosomal exonuclease that is the critical step in removing DNA from the cytoplasm.
Figure 10.
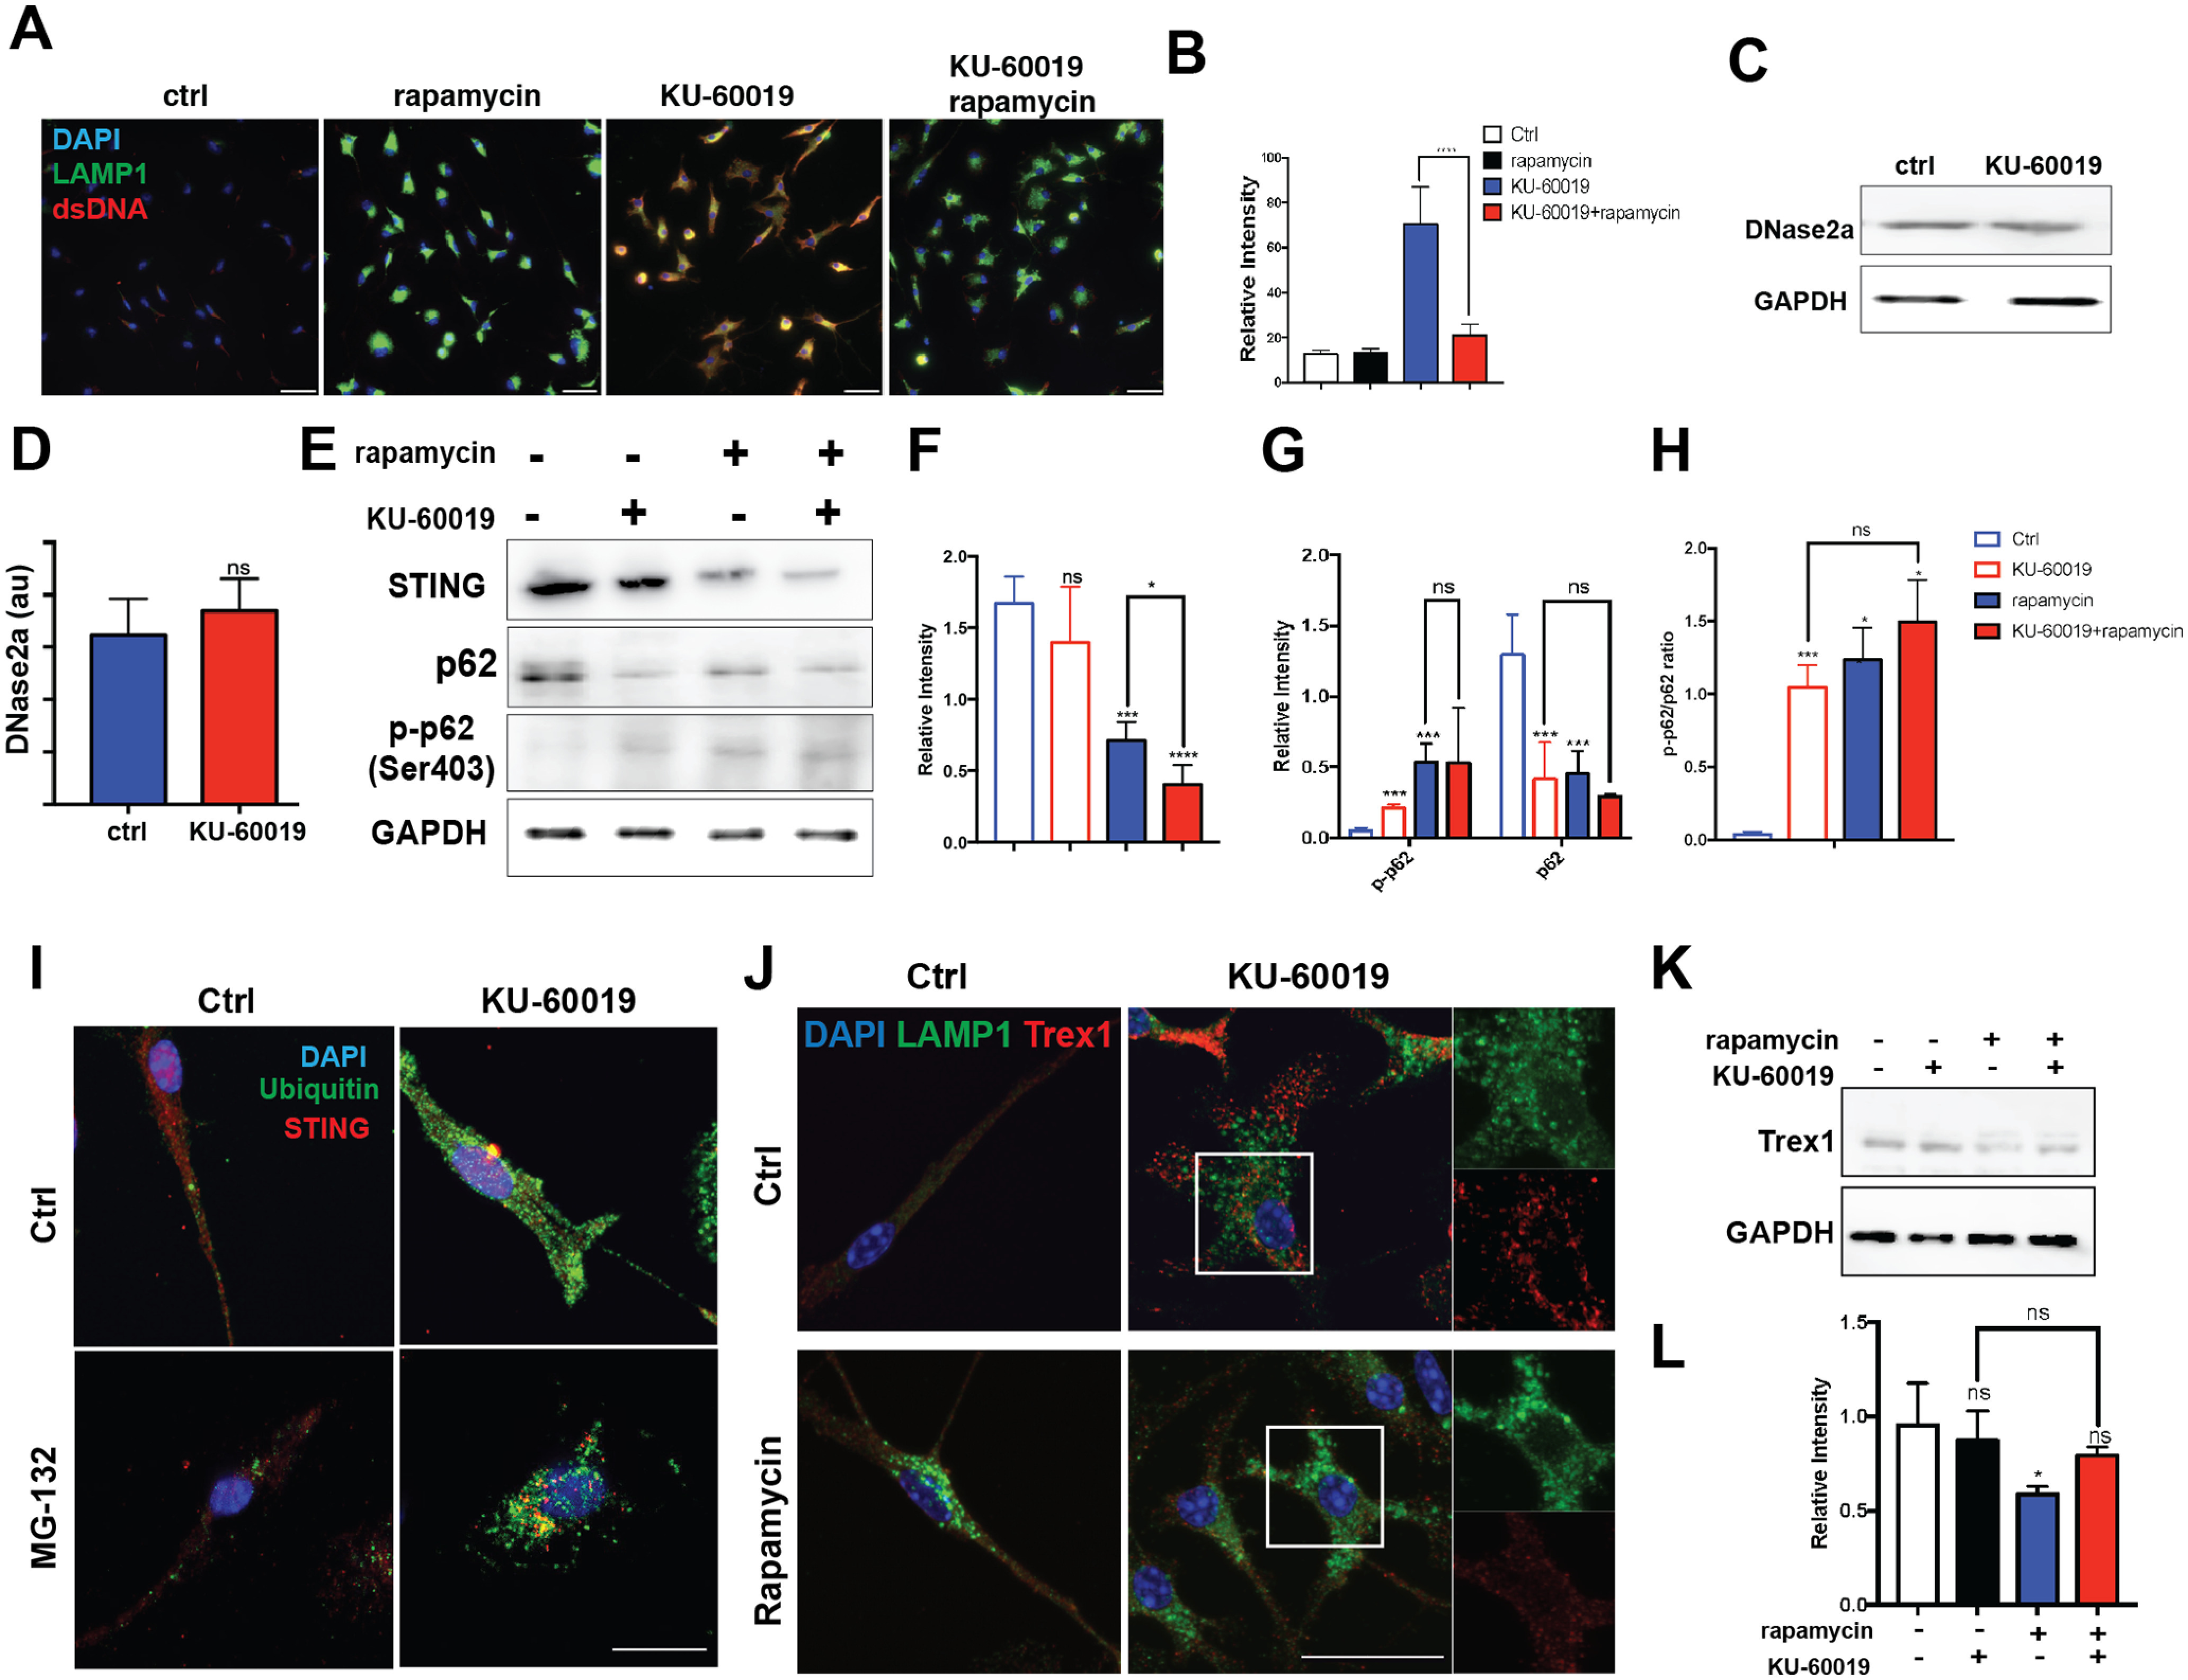
Autophagy-lysosomal pathway negatively regulates DNA-mediated immune response. A, Primary cultured microglia in different conditions were immunostained for dsDNA (red), LAMP1 (green), and counterstained with DAPI (scale bar: 20 μm). B, Quantification of dsDNA intensity shown in panel A. A total of 60 microglia were examined from three independent cultures. Error bars indicate SEM; ****p < 0.0001, by unpaired t test. C, Western blottings (left panel) of DNase2a in cell lysates of microglia from control cultures or cultures treated with KU-60019 for 48 h. GAPDH served as a loading control. D, Quantification of the DNase2 band intensity relative to the GAPDH control. Error bars indicate SEM; ns = not significant by unpaired t test. E, Western blottings of STING, p62, and phospho-p62 in cell lysates of primary cultured microglia. GAPDH served as a loading control. F–H, Quantification of relative intensity of STING, p62, phospho-p62, and the ratio of p-p62/p62 from blots shown in panel E. Error bars indicate SEM; ns = not significant; *p < 0.05, ***p < 0.001, by unpaired t test. I, Primary microglial cultures were either untreated (ctrl) or treated with MG-132 for 24 h, were treated KU-60019 or left untreated. Cells were immunolabeled with antibodies against STING (red), Ubiquitin (green) and counterstained with DAPI (scale bar: 20 μm). J, Cultured microglia were stained with antibodies against LAMP1 (green) and Trex1 (red). Rapamycin was added to the culture 6 h before a 48-h KU-60019 treatment (scale bar: 10 μm). K, Western blottings of Trex1 from microglia cell lysates. L, Quantification of blots shown in panel B; n = 3 independent cultures. Error bars indicate SEM; ns = not significant; *p < 0.05, by unpaired t test.
In addition to degrading cytoDNA, the autophagy-lysosomal pathway directly downregulates the immune response by reducing the protein levels of the cytosolic DNA sensor, STING. Stimulating microglia with KU-60019 alone resulted in little or no change in the levels of STING protein (Fig. 10E). By contrast, when we stimulated autophagy with rapamycin, STING levels were substantially reduced. The decrease in STING protein after KU-60019 treatment was not because of the actions of proteosome. While we observed a significant change in immunolabeling for ubiquitin in the cytoplasm of KU-60019-treated cells (Fig. 5H), blocking the proteosome with MG-132 had no effect on the levels or distribution of STING, confirming that its degradation is primarily through autophagy-lysosomal pathway. Lysosomal activation was also observed by the induction of autophagy by measuring the levels of p62 phosphorylation (Fig. 10E–H). Surprisingly, we uncovered a negative correlation between lysosomal activation and cytosolic Trex1. Trex1 and lysosomes are spatially separated in the microglial cytoplasm (Fig. 10H) which further supports the idea of the parallel function of these two systems in cytoDNA degradation. Rapamycin treatment significantly reduced Trex1 protein levels, while KU-60019 treatment resulted in no change (Fig. 10J,K), suggesting a complementary function of cytosolic and lysosomal DNA degradation.
dsDNA-induced inflammation in astrocyte contributes to neuronal damage
The fibroblast data shown above illustrated that the presence of cytosolic DNA induced by deficient DNA repair was not specific to microglia. We therefore asked whether brain astrocytes, another key player in neuroinflammation, also contributed to the neuronal cell damage caused by ATM dysfunction. In the Atm-/- mouse brain, we detected higher activation of astrocytes (elevated GFAP expression) and an increase in astrocyte number (data not shown). Blocking ATM activity in vitro resulted in a significant increase of cytoDNA accumulation in astrocytes, consistent with the finding in other cell types (Fig. 11A). Along with the increase of cytoDNA, conditioned medium from KU-60019-treated astrocytes (KM) proved to be neurotoxic. We observed significant structural atrophy in KM-treated neuronal cultures, compared with conditioned medium from untreated astrocytes (CM). The effect on the neurons could be seen in both MAP2 immunostaining intensity as well as in the total length of the dendrites (Fig. 11B,C,E). Replacing the normal neuronal culture medium with 20% or 50% astrocyte conditioned medium reduced both MAP2 intensity and dendritic length by half compared with control cultures. The number of synapses (synapsin-I puncta) also was significantly reduced (Fig. 11B,D). Conditioned medium from untreated astrocytes (CM) was also able to cause neuronal cell damage, as indicated by the decreased MAP2 intensity and number of synapsin-I (p value = 0.0554), but higher concentrations were needed (Fig. 11C,D). These findings demonstrate that, after DNA damage, cytoDNA induces a neurotoxic inflammatory response in both microglia and astrocytes. This suggests that the inflammatory environment of the brain during a sterile inflammation is complex and that multiple cell types contributed to the subsequent neuronal damage.
Figure 11.

dsDNA induced inflammation in astrocytes and contributes to neuronal damage. A, Primary cultured astrocytes in control and KU-60019-treated conditions were immunostained for dsDNA (green) and counterstained with DAPI (scale bar: 20 μm). B, Cortical neurons treated with astrocytes conditioned media. Astrocytes were treated with KU-60019 for 48 h, after which their medium was withdrawn and added to previously established neuronal cultures (DIV14) for an additional 24 h with 10%, 20%, and 50% concentration (volume/volume), respectively. Neurons were then fixed and immunostained. Neurons were labeled with anti-MAP2 (red), anti-synapsin-I (green) plus DAPI (blue) for nucleus. C, Quantification of MAP2 intensity of individual neurons from cultures illustrated in B. Three independent cultures were used. Error bars indicate SEM; **p < 0.01, ***p < 0.001, ****p < 0.0001, by unpaired t test. D, Quantification of synapsin-I puncta in neurons such as those illustrated in B. Error bars indicate SEM; *p < 0.05, by unpaired t test. Individual p values were showed. E, Quantification of total dendritic length of individual neurons from cultures showed in B. Error bars indicate SEM; *p < 0.05, **p < 0.01, by unpaired t test.
Discussion
Our data reveal several fascinating new features concerning the origins and fates of cytoplasmic DNA in microglia. Given that a sustained, chronic neuroinflammation is a key component of the progression of neurodegenerative conditions such as Alzheimer's disease, our results have important clinical implications. We showed that cytoDNA alone can trigger a robust inflammatory response in microglia, which strongly suggests that reducing cytoDNA is a therapeutic strategy with considerable potential. In this context, it is encouraging that cytoDNA can be reduced in several ways, any one of which will reduce the resulting microglial response and its neurotoxic consequences. The nuclear origins of cytoDNA and its export to the cytoplasm in a CRM1-dependent process means that its accumulation can be inhibited by blocking nuclear export. When this is done, not only do the levels of cytoDNA drop dramatically, but the microglia also no longer release neurotoxic substances into their medium (Fig. 6E). Thus, it is the cytoDNA itself that is responsible for the sterile immune response triggered by increased DNA damage. After it is exported to the cytoplasm, cytoDNA can be reduced by elevating the levels of the Trex1 exonuclease. Once again, when this strategy is applied to KU-60019-treated microglial cells, not only do their levels of cytoDNA drop, their inflammatory response is also blocked (Fig. 7L). While the role of cytoDNA in stimulating sterile inflammation has been recognized in other cell types, little was known about its role in brain. Our findings from both microglia and astrocytes establish that cytoDNA is a direct and potent neuroinflammation signal. This connection gains added significance from the fact that DNA damage (and hence presumably cytoDNA) is known to increase with age as well as in many chronic diseases.
The cytoDNA that accumulates after DNA repair inhibition in microglia is predominantly nuclear in origin. Microglia are active phagocytes and clear all types of cellular debris from the brain parenchyma. Despite the fact that this would represent a potential source of cytoDNA, our results show that, at least in our in vitro model system, it does not originate from the fragmented nuclei of nearby dying cells. We also showed that cytoDNA largely consists of linear DNA molecules that are not produced from new endoreduplication or reverse transcription events. These observations are particularly important as transposable elements are capable of self-replicating and previous reports have documented their dysregulation in response to aging and stress (Sun et al., 2018). Given that we found cytoDNA-seq signal at such elements, especially on KU-60019 treatment, the absence of microglial cytoDNA labeling with EdU is important evidence that retrotransposon dysregulation was not a key contributor to cytoDNA accumulation.
We also eliminated mtDNA and telomeric sequences as sources of cytoDNA. Using cytoDNA-seq, we demonstrated that the cytoDNA in ATM deficient microglia consists of many repetitive elements originating from specific sites across the genome but with virtually no representation of either mitochondrial or telomeric sequences. Studies have shown that damaged mtDNA and telomeric sequences in the cytoplasm are potent triggers of cGAS self-DNA activation. The presence of extrachromosomal telomeric DNA in cytoplasm has also been reported in ATM deficient mouse and human fibroblasts by fluorescent in situ hybridization (Hande et al., 2001). We did not detect these sequences among the shorter cytoDNA fragments we analyzed. It is possible that the use of distinct cell types, as well as the difference between acute inhibition as opposed to genetic depletion may explain the different phenotypes observed. It would be interesting to interrogate different cell types and their response to ATM inhibition in terms of the sequence composition of cytoDNA.
In defining the mechanism of their biogenesis, we discovered that a critical step in the formation of cytoDNA is its active export from the nucleus by a CRM1-dependent process. Preincubation of microglia with LMB before exposure to KU-60019 blocked cytoDNA accumulation. While these observations identify an active process, the involvement of the CRM1 system implies that the cytoDNA is not exported alone. CRM1 is involved in the export of RNA as well as proteins with nuclear export signals (NES) in their sequence (Rodriguez et al., 2004). This suggests that cytoDNA may exit the nucleus either as a DNA:RNA hybrid, or, more likely, by binding to an NES-containing protein. One possible candidate would be cGAS itself. In cells at rest, cGAS is predominantly located in the nucleus where it binds to inactive DNA (Gentili et al., 2019; Volkman et al., 2019). The online tool, LocNES (Xu et al., 2015), predicts two candidate NES regions, one of which appears to be essential for its response to cytoDNA (Sun et al., 2021). The association of cGAS with centromeric and pericentromeric heterochromatin, coupled with our own finding of the AT-rich nature of cytoDNA, are all consistent with this model. Taken together with our observation that cytoDNA-seq regions significantly overlap with H3K9me3 peaks that include elements such as GSAT_MM, it would be worthwhile to test whether cGAS possesses multiple roles in the production and transport of cytoDNA.
Once in the cytoplasm, cytoDNA is degraded by two parallel systems: the cytoplasmic DNase, Trex1, and the autophagic/lysosomal DNase, DNase1α. Both systems are induced by the presence of cytoDNA, and both have basal levels of cytoDNA degrading function, even in unstimulated microglial cells. The constitutive presence of cytoDNA under normal conditions can be inferred from its accumulation following Trex1 inhibition. Previous studies have proposed that under normal conditions, basal amounts of DNA stimulate cGAS activity at low levels and this activity is required for constitutive expression of interferon-stimulated genes (Gough et al., 2012; Schoggins et al., 2014; Gentili et al., 2019). Notably, our analysis shows NFAT motif enrichment for control but not KU-60019-treated cytoDNA regions. NFAT is a component of the mechanism responsible for immune-related gene transcription (Macián et al., 2001; Park et al., 2020). While a low level of constitutive cytoDNA production fits with our results, the rationale for, and consequences of, this ongoing degradation of the genome are difficult to imagine.
Taken together, we postulate that repetitive elements, especially in inactive regions near the nuclear periphery are used as a buffer for DNA damage and are subsequently released as cytoDNA on ATM inhibition. Given the abundance of these repetitive elements, which are presumably non-functional in transcriptional or epigenomic regulation, it makes evolutionary sense for them to be “sacrificed” in the event of insults to genome. Moreover, repetitive elements can contain motifs for protein binding which may play a role in DNA damage repair responses. In addition, our findings show that cytoDNA is itself a potent trigger of a sterile inflammatory response. By linking DNA damage to inflammation, the data offer a compelling conceptual link to the process of aging, where DNA damage relentlessly accumulates. Finally, the discovery that the production of cytoDNA, which induces sterile inflammation can come from multiple different cell types underscores the complexity of the brain environment in which neurodegenerative conditions such as Alzheimer's disease emerge.
Footnotes
This work was supported by Lo Ka Chung Charitable Foundation (The Hong Kong Epigenome Project); Ming Wai Lau Center for Reparative Medicine Associate Member Program; The Hong Kong University of Science and Technology Grant R9321; and Research Grants Council of the Hong Kong SAR Grants 26104216, 16101315, 16124916, C6009-17G, and AoE/M-604/16. Additional support came from the University of Pittsburgh School of Medicine. We thank Dr. Hei-Man Chow and Dr. Kai-Hei Tse for discussions and Dr. Aifang Cheng and Dr. Beika Zhu for technical guidance.
The authors declare no competing financial interests.
References
- Ahn J, Gutman D, Saijo S, Barber GN (2012) STING manifests self DNA-dependent inflammatory disease. Proc Natl Acad Sci USA 109:19386–19391. 10.1073/pnas.1215006109 [DOI] [PMC free article] [PubMed] [Google Scholar]
- Ain Q, Schmeer C, Wengerodt D, Witte OW, Kretz A (2020) Extrachromosomal circular DNA: current knowledge and implications for CNS aging and neurodegeneration. Int J Mol Sci 21:2477. [DOI] [PMC free article] [PubMed] [Google Scholar]
- Alexander A, Kim J, Walker CL (2010) ATM engages the TSC2/mTORC1 signaling node to regulate autophagy. Autophagy 6:672–673. 10.4161/auto.6.5.12509 [DOI] [PMC free article] [PubMed] [Google Scholar]
- Aparicio R, Rana A, Walker DW (2019) Upregulation of the autophagy adaptor p62/SQSTM1 prolongs health and lifespan in middle-aged Drosophila. Cell reports 28:1029–1040. 10.1016/j.celrep.2019.06.070 [DOI] [PMC free article] [PubMed] [Google Scholar]
- Arsenis C, Gordon JS, Touster O (1970) Degradation of nucleic acids by lysosomal extracts of rat liver and Ehrlich ascites tumor cells. J Biol Chem 245:205–211. 10.1016/S0021-9258(18)63440-4 [DOI] [PubMed] [Google Scholar]
- Ba Q, Raghavan G, Kiselyov K, Yang G (2018) Whole-cell scale dynamic organization of lysosomes revealed by spatial statistical analysis. Cell Rep 23:3591–3606. 10.1016/j.celrep.2018.05.079 [DOI] [PMC free article] [PubMed] [Google Scholar]
- Balka KR, Louis C, Saunders TL, Smith AM, Calleja DJ, D'Silva DB, Moghaddas F, Tailler M, Lawlor KE, Zhan Y, Burns CJ, Wicks IP, Miner JJ, Kile BT, Masters SL, De Nardo D (2020) TBK1 and IKKepsilon act redundantly to mediate STING-induced NF-kappaB responses in myeloid cells. Cell Rep 31:107492. 10.1016/j.celrep.2020.03.056 [DOI] [PubMed] [Google Scholar]
- Berger ND, Stanley FKT, Moore S, Goodarzi AA (2017) ATM-dependent pathways of chromatin remodelling and oxidative DNA damage responses. Philos Trans R Soc Lond B Biol Sci 372:20160283. [DOI] [PMC free article] [PubMed] [Google Scholar]
- Bradshaw EM, Chibnik LB, Keenan BT, Ottoboni L, Raj T, Tang A, Rosenkrantz LL, Imboywa S, Lee M, Von Korff A, Morris MC, Evans DA, Johnson K, Sperling RA, Schneider JA, Bennett DA, De Jager PL, Alzheimer Disease Neuroimaging Initiative; Morris MC, Evans DA, et al. (2013) CD33 Alzheimer's disease locus: altered monocyte function and amyloid biology. Nat Neurosci 16:848–850. 10.1038/nn.3435 [DOI] [PMC free article] [PubMed] [Google Scholar]
- Cabukusta B, Neefjes J (2018) Mechanisms of lysosomal positioning and movement. Traffic 19:761–769. 10.1111/tra.12587 [DOI] [PMC free article] [PubMed] [Google Scholar]
- Cheng A, Zhao T, Tse KH, Chow HM, Cui Y, Jiang L, Du S, Loy MM, Herrup K (2018) ATM and ATR play complementary roles in the behavior of excitatory and inhibitory vesicle populations. Proc Natl Acad Sci USA 115:E292–E301. [DOI] [PMC free article] [PubMed] [Google Scholar]
- Cheng A, Tse KH, Chow HM, Gan Y, Song X, Ma F, Qian YXY, She W, Herrup K (2021) ATM loss disrupts the autophagy-lysosomal pathway. Autophagy 17:1998–2010. [DOI] [PMC free article] [PubMed] [Google Scholar]
- Chow HM, Herrup K (2015) Genomic integrity and the ageing brain. Nat Rev Neurosci 16:672–684. 10.1038/nrn4020 [DOI] [PubMed] [Google Scholar]
- ENCODE Project Consortium (2012) An integrated encyclopedia of DNA elements in the human genome. Nature 489:57–74. [DOI] [PMC free article] [PubMed] [Google Scholar]
- Cortes CJ, La Spada AR (2019) TFEB dysregulation as a driver of autophagy dysfunction in neurodegenerative disease: molecular mechanisms, cellular processes, and emerging therapeutic opportunities. Neurobiol Dis 122:83–93. 10.1016/j.nbd.2018.05.012 [DOI] [PMC free article] [PubMed] [Google Scholar]
- Dana H, Sun Y, Mohar B, Hulse BK, Kerlin AM, Hasseman JP, Tsegaye G, Tsang A, Wong A, Patel R, Macklin JJ, Chen Y, Konnerth A, Jayaraman V, Looger LL, Schreiter ER, Svoboda K, Kim DS (2019) High-performance calcium sensors for imaging activity in neuronal populations and microcompartments. Nat Methods 16:649–657. 10.1038/s41592-019-0435-6 [DOI] [PubMed] [Google Scholar]
- de Hoon MJL, Imoto S, Nolan J, Miyano S (2004) Open source clustering software. Bioinformatics 20:1453–1454. 10.1093/bioinformatics/bth078 [DOI] [PubMed] [Google Scholar]
- Di Malta C, Cinque L, Settembre C (2019) Transcriptional regulation of autophagy: mechanisms and diseases. Front Cell Dev Biol 7:114. [DOI] [PMC free article] [PubMed] [Google Scholar]
- Feldman N, Rotter-Maskowitz A, Okun E (2015) DAMPs as mediators of sterile inflammation in aging-related pathologies. Ageing Res Rev 24:29–39. 10.1016/j.arr.2015.01.003 [DOI] [PubMed] [Google Scholar]
- Ferro A, Sheeler C, Cvetanovic M (2019) Microglial self-recognition STINGs in AT neurodegeneration. Trends Neurosci 42:753–755. 10.1016/j.tins.2019.09.005 [DOI] [PMC free article] [PubMed] [Google Scholar]
- Fionda C, D Bona D, Kosta A, Stabile H, Santoni A, Cippitelli M (2019) The POU-domain transcription factor Oct-6/POU3F1 as a regulator of cellular response to genotoxic stress. Cancers (Basel) 11:810. [DOI] [PMC free article] [PubMed] [Google Scholar]
- Fujiwara Y, Kikuchi H, Aizawa S, Furuta A, Hatanaka Y, Konya C, Uchida K, Wada K, Kabuta T (2013) Direct uptake and degradation of DNA by lysosomes. Autophagy 9:1167–1171. 10.4161/auto.24880 [DOI] [PMC free article] [PubMed] [Google Scholar]
- Fujiwara Y, Wada K, Kabuta T (2017) Lysosomal degradation of intracellular nucleic acids—multiple autophagic pathways. J Biochem 161:145–154. [DOI] [PubMed] [Google Scholar]
- Gao D, Li T, Li X-D, Chen X, Li Q-Z, Wight-Carter M, Chen ZJ (2015) Activation of cyclic GMP-AMP synthase by self-DNA causes autoimmune diseases. Proc Natl Acad Sci USA 112:E5699–E5705. [DOI] [PMC free article] [PubMed] [Google Scholar]
- Garrity AG, Wang W, Collier CMLevey SA, Gao Q, Xu H (2016) The endoplasmic reticulum, not the pH gradient, drives calcium refilling of lysosomes. Elife 5:e15887. [DOI] [PMC free article] [PubMed] [Google Scholar]
- Gentili M, Lahaye X, Nadalin F, Nader GPF, Puig Lombardi E, Herve S, De Silva NS, Rookhuizen DC, Zueva E, Goudot C, Maurin M, Bochnakian A, Amigorena S, Piel M, Fachinetti D, Londono-Vallejo A, Manel N (2019) The N-terminal domain of cGAS determines preferential association with centromeric DNA and innate immune activation in the nucleus. Cell Rep 26:2377–2393.e13. 10.1016/j.celrep.2019.01.105 [DOI] [PMC free article] [PubMed] [Google Scholar]
- Goodarzi AA, Noon AT, Deckbar D, Ziv Y, Shiloh Y, Lobrich M, Jeggo PA (2008) ATM signaling facilitates repair of DNA double-strand breaks associated with heterochromatin. Mol Cell 31:167–177. 10.1016/j.molcel.2008.05.017 [DOI] [PubMed] [Google Scholar]
- Gough DJ, Messina Nicole L, Christopher C, Johnstone JP, Ricky W, Levy David E (2012) Constitutive type I interferon modulates homeostatic balance through tonic signaling. Immunity 36:166–174. 10.1016/j.immuni.2012.01.011 [DOI] [PMC free article] [PubMed] [Google Scholar]
- Guerreiro R, Wojtas A, Bras J, Carrasquillo M, Rogaeva E, Majounie E, Cruchaga C, Sassi C, Kauwe JSK, Younkin S, Hazrati L, Collinge J, Pocock J, Lashley T, Williams J, Lambert JC, Amouyel P, Goate A, Rademakers R, et al. (2013) TREM2 variants in Alzheimer's disease. N Engl J Med 368:117–127. 10.1056/NEJMoa1211851 [DOI] [PMC free article] [PubMed] [Google Scholar]
- Hande MP, Balajee AS, Tchirkov A, Wynshaw-Boris A, Lansdorp PM (2001) Extra-chromosomal telomeric DNA in cells from Atm(-/-) mice and patients with ataxia-telangiectasia. Hum Mol Genet 10:519–528. 10.1093/hmg/10.5.519 [DOI] [PubMed] [Google Scholar]
- Hasan M, Yan N (2014) Safeguard against DNA sensing: the role of TREX1 in HIV-1 infection and autoimmune diseases. Front Microbiol 5:193. 10.3389/fmicb.2014.00193 [DOI] [PMC free article] [PubMed] [Google Scholar]
- Hasan M, Koch J, Rakheja D, Pattnaik AK, Brugarolas J, Dozmorov I, Levine B, Wakeland EK, Lee-Kirsch MA, Yan N (2013) Trex1 regulates lysosomal biogenesis and interferon-independent activation of antiviral genes. Nat Immunol 14:61–71. 10.1038/ni.2475 [DOI] [PMC free article] [PubMed] [Google Scholar]
- He Y, Hariharan M, Gorkin DU, Dickel DE, Luo C, Castanon RG, Nery JR, Lee AY, Zhao Y, Huang H, Williams BA, Trout D, Amrhein H, Fang R, Chen H, Li B, Visel A, Pennacchio LA, Ren B, Ecker JR (2020) Spatiotemporal DNA methylome dynamics of the developing mouse fetus. Nature 583:752–759. 10.1038/s41586-020-2119-x [DOI] [PMC free article] [PubMed] [Google Scholar]
- Heinz S, Benner C, Spann N, Bertolino E, Lin YC, Laslo P, Cheng JX, Murre C, Singh H, Glass CK (2010) Simple combinations of lineage-determining transcription factors prime cis-regulatory elements required for macrophage and B cell identities. Mol Cell 38:576–589. 10.1016/j.molcel.2010.05.004 [DOI] [PMC free article] [PubMed] [Google Scholar]
- Heneka MT, Carson MJ, Khoury JE, Landreth GE, Brosseron F, Feinstein DL, Jacobs AH, Wyss-Coray T, Vitorica J, Ransohoff RM, Herrup K, Frautschy SA, Finsen B, Brown GC, Verkhratsky A, Yamanaka K, Koistinaho J, Latz E, Halle A, Petzold GC, et al. (2015) Neuroinflammation in Alzheimer's disease. Lancet Neurol 14:388–405. 10.1016/S1474-4422(15)70016-5 [DOI] [PMC free article] [PubMed] [Google Scholar]
- Herrup K, Li J, Chen J (2013) The role of ATM and DNA damage in neurons: upstream and downstream connections. DNA Repair (Amst) 12:600–604. 10.1016/j.dnarep.2013.04.012 [DOI] [PMC free article] [PubMed] [Google Scholar]
- Hou Y, Song H, Croteau DL, Akbari M, Bohr VA (2017) Genome instability in Alzheimer disease. Mech Ageing Dev 161:83–94. 10.1016/j.mad.2016.04.005 [DOI] [PMC free article] [PubMed] [Google Scholar]
- Hu MM, Shu HB (2020) Innate immune response to cytoplasmic DNA: mechanisms and diseases. Annu Rev Immunol 38:79–98. 10.1146/annurev-immunol-070119-115052 [DOI] [PubMed] [Google Scholar]
- Huang SM, Schonthal AH, Stallcup MR (2001) Enhancement of p53-dependent gene activation by the transcriptional coactivator Zac1. Oncogene 20:2134–2143. 10.1038/sj.onc.1204298 [DOI] [PubMed] [Google Scholar]
- Jiang Q, Ang JYJ, Lee AY, Cao Q, Li KY, Yip KY, Leung DCY (2020) G9a plays distinct roles in maintaining DNA methylation, retrotransposon silencing, and chromatin looping. Cell Rep 33:108315. 10.1016/j.celrep.2020.108315 [DOI] [PubMed] [Google Scholar]
- Katyal S, McKinnon PJ (2008) DNA strand breaks, neurodegeneration and aging in the brain. Mech Ageing Dev 129:483–491. 10.1016/j.mad.2008.03.008 [DOI] [PMC free article] [PubMed] [Google Scholar]
- Kawane K, Ohtani M, Miwa K, Kizawa T, Kanbara Y, Yoshioka Y, Yoshikawa H, Nagata S (2006) Chronic polyarthritis caused by mammalian DNA that escapes from degradation in macrophages. Nature 443:998–1002. 10.1038/nature05245 [DOI] [PubMed] [Google Scholar]
- Kim J, Gupta R, Blanco LP, Yang S, Shteinfer-Kuzmine A, Wang K, Zhu J, Yoon HE, Wang X, Kerkhofs M, Kang H, Brown AL, Park SJ, Xu X, Zandee van Rilland E, Kim MK, Cohen JI, Kaplan MJ, Shoshan-Barmatz V, Chung JH (2019) VDAC oligomers form mitochondrial pores to release mtDNA fragments and promote lupus-like disease. Science 366:1531–1536. 10.1126/science.aav4011 [DOI] [PMC free article] [PubMed] [Google Scholar]
- Krzywinski MI, Schein JE, Birol I, Connors J, Gascoyne R, Horsman D, Jones SJ, Marra MA (2009) Circos: an information aesthetic for comparative genomics. Genome Res 19:1639–1645. 10.1101/gr.092759.109 [DOI] [PMC free article] [PubMed] [Google Scholar]
- Kudo N, Wolff B, Sekimoto T, Schreiner EP, Yoneda Y, Yanagida M, Horinouchi S, Yoshida M (1998) Leptomycin B inhibition of signal-mediated nuclear export by direct binding to CRM1. Exp Cell Res 242:540–547. 10.1006/excr.1998.4136 [DOI] [PubMed] [Google Scholar]
- Kudo N, Matsumori N, Taoka H, Fujiwara D, Schreiner EP, Wolff B, Yoshida M, Horinouchi S (1999) Leptomycin B inactivates CRM1/exportin 1 by covalent modification at a cysteine residue in the central conserved region. Proc Natl Acad Sci USA 96:9112–9117. [DOI] [PMC free article] [PubMed] [Google Scholar]
- Kwon J, Bakhoum SF (2020) The cytosolic DNA-sensing cGAS–sting pathway in cancer. Cancer Discov 10:26–39. 10.1158/2159-8290.CD-19-0761 [DOI] [PMC free article] [PubMed] [Google Scholar]
- Liu WJ, Ye L, Huang WF, Guo LJ, Xu ZG, Wu HL, Yang C, Liu HF (2016) p62 links the autophagy pathway and the ubiqutin–proteasome system upon ubiquitinated protein degradation. Cell Mol Biol Lett 21:29. 10.1186/s11658-016-0031-z [DOI] [PMC free article] [PubMed] [Google Scholar]
- Lukusa T, Fryns JP (2008) Human chromosome fragility. Biochim Biophys Acta 1779:3–16. 10.1016/j.bbagrm.2007.10.005 [DOI] [PubMed] [Google Scholar]
- Macián F, López-Rodríguez C, Rao A (2001) Partners in transcription: NFAT and AP-1. Oncogene 20:2476–2489. 10.1038/sj.onc.1204386 [DOI] [PubMed] [Google Scholar]
- Martini-Stoica H, Xu Y, Ballabio A, Zheng H (2016) The autophagy–lysosomal pathway in neurodegeneration: a TFEB perspective. Trends Neurosci 39:221–234. 10.1016/j.tins.2016.02.002 [DOI] [PMC free article] [PubMed] [Google Scholar]
- McCool KW, Miyamoto S (2012) DNA damage-dependent NF-κB activation: NEMO turns nuclear signaling inside out. Immunol Rev 246:311–326. 10.1111/j.1600-065X.2012.01101.x [DOI] [PMC free article] [PubMed] [Google Scholar]
- Medina DL, Di Paola S, Peluso I, Armani A, De Stefani D, Venditti R, Montefusco S, Scotto-Rosato A, Prezioso C, Forrester A, Settembre C, Wang W, Gao Q, Xu H, Sandri M, Rizzuto R, De Matteis MA, Ballabio A (2015) Lysosomal calcium signalling regulates autophagy through calcineurin and TFEB. Nat Cell Biol 17:288–299. 10.1038/ncb3114 [DOI] [PMC free article] [PubMed] [Google Scholar]
- Meyne J, Ratliff RL, Moyzis RK (1989) Conservation of the human telomere sequence (TTAGGG)n among vertebrates. Proc Natl Acad Sci USA 86:7049–7053. 10.1073/pnas.86.18.7049 [DOI] [PMC free article] [PubMed] [Google Scholar]
- Moller HD (2020) Circle-Seq: isolation and sequencing of chromosome-derived circular DNA elements in cells. Methods Mol Biol 2119:165–181. [DOI] [PubMed] [Google Scholar]
- Morgan AJ, Davis LC, Galione A (2015) Imaging approaches to measuring lysosomal calcium. Methods Cell Biol 126:159–195. 10.1016/bs.mcb.2014.10.031 [DOI] [PubMed] [Google Scholar]
- Mouse Genome Sequencing Consortium, Waterston RH, Lindblad-Toh K, Birney E, Rogers J, Abril JF, Agarwal P, Agarwala R, Ainscough R, Alexandersson M, An P, Antonarakis SE, Attwood J, Baertsch R, Bailey J, Barlow K, Beck S, Berry E, Birren B, Bloom T, et al. (2002) Initial sequencing and comparative analysis of the mouse genome. Nature 420:520–562. 10.1038/nature01262 [DOI] [PubMed] [Google Scholar]
- Nakai J, Ohkura M, Imoto K (2001) A high signal-to-noise Ca 2+ probe composed of a single green fluorescent protein. Nat Biotechnol 19:137–141. 10.1038/84397 [DOI] [PubMed] [Google Scholar]
- Odaka C, Mizuochi T (1999) Role of macrophage lysosomal enzymes in the degradation of nucleosomes of apoptotic cells. J Immunol 163:5346–5352. [PubMed] [Google Scholar]
- Paludan SR, Bowie AG (2013) Immune sensing of DNA. Immunity 38:870–880. 10.1016/j.immuni.2013.05.004 [DOI] [PMC free article] [PubMed] [Google Scholar]
- Pao PC, Patnaik D, Watson LA, Gao F, Pan L, Wang J, Adaikkan C, Penney J, Cam HP, Huang WC, Pantano L, Lee A, Nott A, Phan TX, Gjoneska E, Elmsaouri S, Haggarty SJ, Tsai LH (2020) HDAC1 modulates OGG1-initiated oxidative DNA damage repair in the aging brain and Alzheimer's disease. Nat Commun 11:2484. 10.1038/s41467-020-16361-y [DOI] [PMC free article] [PubMed] [Google Scholar]
- Park YJ, Yoo SA, Kim M, Kim WU (2020) The role of calcium-calcineurin-NFAT signaling pathway in health and autoimmune diseases. Front Immunol 11:195. 10.3389/fimmu.2020.00195 [DOI] [PMC free article] [PubMed] [Google Scholar]
- Perrino FW, Mazur DJ, Ward H, Harvey S (1999) Exonucleases and the incorporation of aranucleotides into DNA. Cell Biochem Biophys 30:331–352. 10.1007/BF02738118 [DOI] [PubMed] [Google Scholar]
- Quek H, Luff J, Cheung K, Kozlov S, Gatei M, Lee CS, Bellingham MC, Noakes PG, Lim YC, Barnett NL, Dingwall S, Wolvetang E, Mashimo T, Roberts TL, Lavin MF (2017a) Rats with a missense mutation in Atm display neuroinflammation and neurodegeneration subsequent to accumulation of cytosolic DNA following unrepaired DNA damage. J Leukoc Biol 101:927–947. 10.1189/jlb.4VMA0716-316R [DOI] [PubMed] [Google Scholar]
- Quek H, Luff J, Cheung K, Kozlov S, Gatei M, Lee CS, Bellingham MC, Noakes PG, Lim YC, Barnett NL, Dingwall S, Wolvetang E, Mashimo T, Roberts TL, Lavin MF (2017b) A rat model of ataxia-telangiectasia: evidence for a neurodegenerative phenotype. Hum Mol Genet 26:109–123. 10.1093/hmg/ddw371 [DOI] [PubMed] [Google Scholar]
- Quinlan AR, Hall IM (2010) BEDTools: a flexible suite of utilities for comparing genomic features. Bioinformatics 26:841–842. 10.1093/bioinformatics/btq033 [DOI] [PMC free article] [PubMed] [Google Scholar]
- Quiros PM, Goyal A, Jha P, Auwerx J (2017) Analysis of mtDNA/nDNA ratio in mice. Curr Protoc Mouse Biol 7:47–54. 10.1002/cpmo.21 [DOI] [PMC free article] [PubMed] [Google Scholar]
- Rego SL, Harvey S, Simpson SR, Hemphill WO, McIver ZA, Grayson JM, Perrino FW (2018) TREX1 D18N mice fail to process erythroblast DNA resulting in inflammation and dysfunctional erythropoiesis. Autoimmunity 51:333–344. 10.1080/08916934.2018.1522305 [DOI] [PMC free article] [PubMed] [Google Scholar]
- Rodriguez MS, Dargemont C, Stutz F (2004) Nuclear export of RNA. Biol Cell 96:639–655. 10.1016/j.biolcel.2004.04.014 [DOI] [PubMed] [Google Scholar]
- Schoggins JW, MacDuff DA, Imanaka N, Gainey MD, Shrestha B, Eitson JL, Mar KB, Richardson RB, Ratushny AV, Litvak V, Dabelic R, Manicassamy B, Aitchison JD, Aderem A, Elliott RM, García-Sastre A, Racaniello V, Snijder EJ, Yokoyama WM, Diamond MS, et al. (2014) Pan-viral specificity of IFN-induced genes reveals new roles for cGAS in innate immunity. Nature 505:691–695. 10.1038/nature12862 [DOI] [PMC free article] [PubMed] [Google Scholar]
- Schuster-Böckler B, Lehner B (2012) Chromatin organization is a major influence on regional mutation rates in human cancer cells. Nature 488:504–507. 10.1038/nature11273 [DOI] [PubMed] [Google Scholar]
- Sergey V, Nezar A, Anton G, Ilya F, Geoffrey F, Johannes N, Aleksandra G, Betul A, Sameer A, Peter K, Maksim I (2020) mirnylab/cooltools: v0.3.2. Zenodo. [Google Scholar]
- Settembre C, Di Malta C, Polito VA, Garcia Arencibia M, Vetrini F, Erdin S, Erdin SU, Huynh T, Medina D, Colella P, Sardiello M, Rubinsztein DC, Ballabio A (2011) TFEB links autophagy to lysosomal biogenesis. science 332:1429–1433. 10.1126/science.1204592 [DOI] [PMC free article] [PubMed] [Google Scholar]
- Simpson SR, Hemphill WO, Hudson T, Perrino FW (2020) TREX1–Apex predator of cytosolic DNA metabolism. DNA Repair (Amst) 94:102894. 10.1016/j.dnarep.2020.102894 [DOI] [PMC free article] [PubMed] [Google Scholar]
- Song X, Ma F, Herrup K (2019) Accumulation of cytoplasmic DNA due to ATM deficiency activates the microglial viral response system with neurotoxic consequences. J Neurosci 39:6378–6394. 10.1523/JNEUROSCI.0774-19.2019 [DOI] [PMC free article] [PubMed] [Google Scholar]
- Stetson DB, Ko JS, Heidmann T, Medzhitov R (2008) Trex1 prevents cell-intrinsic initiation of autoimmunity. Cell 134:587–598. 10.1016/j.cell.2008.06.032 [DOI] [PMC free article] [PubMed] [Google Scholar]
- Sun H, Huang Y, Mei S, Xu F, Liu X, Zhao F, Yin L, Zhang D, Wei L, Wu C, Ma S, Wang J, Cen S, Liang C, Hu S, Guo F (2021) A nuclear export signal is required for cGAS to sense cytosolic DNA. Cell Rep 34:108586. 10.1016/j.celrep.2020.108586 [DOI] [PubMed] [Google Scholar]
- Sun W, Samimi H, Gamez M, Zare H, Frost B (2018) Pathogenic tau-induced piRNA depletion promotes neuronal death through transposable element dysregulation in neurodegenerative tauopathies. Nat Neurosci 21:1038–1048. 10.1038/s41593-018-0194-1 [DOI] [PMC free article] [PubMed] [Google Scholar]
- Tamashiro TT, Dalgard CL, Byrnes KR (2012) Primary microglia isolation from mixed glial cell cultures of neonatal rat brain tissue. J Vis Exp (66):e3814. [DOI] [PMC free article] [PubMed] [Google Scholar]
- Tong Y, Song F (2015) Intracellular calcium signaling regulates autophagy via calcineurin-mediated TFEB dephosphorylation. Autophagy 11:1192–1195. 10.1080/15548627.2015.1054594 [DOI] [PMC free article] [PubMed] [Google Scholar]
- Tse KH, Cheng A, Ma F, Herrup K (2018) DNA damage-associated oligodendrocyte degeneration precedes amyloid pathology and contributes to Alzheimer's disease and dementia. Alzheimers Dement 14:664–679. 10.1016/j.jalz.2017.11.010 [DOI] [PMC free article] [PubMed] [Google Scholar]
- Valentin-Vega YA, Maclean KH, Tait-Mulder J, Milasta S, Steeves M, Dorsey FC, Cleveland JL, Green DR, Kastan MB (2012) Mitochondrial dysfunction in ataxia-telangiectasia. Blood 119:1490–1500. 10.1182/blood-2011-08-373639 [DOI] [PMC free article] [PubMed] [Google Scholar]
- Vanpouille-Box C, Demaria S, Formenti SC, Galluzzi L (2018) Cytosolic DNA sensing in organismal tumor control. Cancer Cell 34:361–378. 10.1016/j.ccell.2018.05.013 [DOI] [PubMed] [Google Scholar]
- Velazquez Camacho O, Galan C, Swist-Rosowska K, Ching R, Gamalinda M, Karabiber F, De L, Rosa-Velazquez I, Engist B, Koschorz B, Shukeir N, Onishi-Seebacher M, van de Nobelen S, Jenuwein T (2017) Major satellite repeat RNA stabilize heterochromatin retention of Suv39h enzymes by RNA-nucleosome association and RNA: DNA hybrid formation. Elife 4:e25293. [DOI] [PMC free article] [PubMed] [Google Scholar]
- Vizioli MG, Liu T, Miller KN, Robertson NA, Gilroy K, Lagnado AB, Perez-Garcia A, Kiourtis C, Dasgupta N, Lei X, Kruger PJ, Nixon C, Clark W, Jurk D, Bird TG, Passos JF, Berger SL, Dou Z, Adams PD (2020) Mitochondria-to-nucleus retrograde signaling drives formation of cytoplasmic chromatin and inflammation in senescence. Genes Dev 34:428–445. 10.1101/gad.331272.119 [DOI] [PMC free article] [PubMed] [Google Scholar]
- Volkman HE, Cambier S, Gray EE, Stetson DB (2019) Tight nuclear tethering of cGAS is essential for preventing autoreactivity. Elife 8:e47491. [DOI] [PMC free article] [PubMed] [Google Scholar]
- West AP, Khoury-Hanold W, Staron M, Tal MC, Pineda CM, Lang SM, Bestwick M, Duguay BA, Raimundo N, MacDuff DA, Kaech SM, Smiley JR, Means RE, Iwasaki A, Shadel GS (2015) Mitochondrial DNA stress primes the antiviral innate immune response. Nature 520:553–557. 10.1038/nature14156 [DOI] [PMC free article] [PubMed] [Google Scholar]
- Xu B, Wang W, Guo H, Sun Z, Wei Z, Zhang X, Liu Z, Tischfield JA, Gong Y, Shao C (2014) Oxidative stress preferentially induces a subtype of micronuclei and mediates the genomic instability caused by p53 dysfunction. Mutat Res 770:1–8. 10.1016/j.mrfmmm.2014.08.004 [DOI] [PMC free article] [PubMed] [Google Scholar]
- Xu D, Marquis K, Pei J, Fu S-C, Cağatay T, Grishin NV, Chook YM (2015) LocNES: a computational tool for locating classical NESs in CRM1 cargo proteins. Bioinformatics 31:1357–1365. 10.1093/bioinformatics/btu826 [DOI] [PMC free article] [PubMed] [Google Scholar]
- Yang YG, Lindahl T, Barnes DE (2007) Trex1 exonuclease degrades ssDNA to prevent chronic checkpoint activation and autoimmune disease. Cell 131:873–886. 10.1016/j.cell.2007.10.017 [DOI] [PubMed] [Google Scholar]
- Zhao E, Czaja MJ (2012) TFEB: a central regulator of both the autophagosome and lysosome. Hepatology 55:1632–1634. [DOI] [PMC free article] [PubMed] [Google Scholar]
- Zhao M, Mishra L, Deng CX (2018) The role of TGF-beta/SMAD4 signaling in cancer. Int J Biol Sci 14:111–123. 10.7150/ijbs.23230 [DOI] [PMC free article] [PubMed] [Google Scholar]