

Abstract
The exquisite capacity of primates to detect and recognize faces is crucial for social interactions. Although disentangling the neural basis of human face recognition remains a key goal in neuroscience, direct evidence at the single-neuron level is limited. We recorded from face-selective neurons in human visual cortex in a region characterized by functional magnetic resonance imaging (fMRI) activations for faces compared with objects. The majority of visually responsive neurons in this fMRI activation showed strong selectivity at short latencies for faces compared with objects. Feature-scrambled faces and face-like objects could also drive these neurons, suggesting that this region is not tightly tuned to the visual attributes that typically define whole human faces. These single-cell recordings within the human face processing system provide vital experimental evidence linking previous imaging studies in humans and invasive studies in animal models.
SIGNIFICANCE STATEMENT We present the first recordings of face-selective neurons in or near an fMRI-defined patch in human visual cortex. Our unbiased multielectrode array recordings (i.e., no selection of neurons based on a search strategy) confirmed the validity of the BOLD contrast (faces–objects) in humans, a finding with implications for all human imaging studies. By presenting faces, feature-scrambled faces, and face-pareidolia (perceiving faces in inanimate objects) stimuli, we demonstrate that neurons at this level of the visual hierarchy are broadly tuned to the features of a face, independent of spatial configuration and low-level visual attributes.
Keywords: extrastriate cortex, face patch, face processing, occipital face area, ventral visual stream, visual cortex
Introduction
Functional magnetic resonance imaging (fMRI) studies have identified a network of brain regions in occipitotemporal cortex that is activated by faces (Kanwisher et al., 1997; McCarthy et al., 1997; Grill-Spector et al., 2004, 2017; Tsao et al., 2008). The fusiform face area (FFA; Kanwisher et al., 1997; Grill-Spector et al., 2004) and the occipital face area (OFA; Gauthier et al., 2000; Pitcher et al., 2007) are considered key components of the human face processing network (Grill-Spector et al., 2017), yet the exact role of these areas in face perception is only partially understood.
Electrical stimulation over face-selective cortex perturbs face perception (Jonas et al., 2012; Parvizi et al., 2012), suggesting a causal contribution of these areas to face processing. Intracranial recordings using electrocorticography and depth electrodes (Allison et al., 1999; McCarthy et al., 1999; Puce et al., 1999; Liu et al., 2009; Davidesco et al., 2014; Sato et al., 2014; Jacques et al., 2016; Jonas et al., 2016) in face-selective areas have confirmed a preference for faces in these regions. Such recordings have improved temporal resolution compared with fMRI, but the signal recorded from macro contacts still reflects the activity of thousands of neurons and can therefore not determine the face versus object selectivity of individual neurons, nor any other property of single neurons such as within-category face selectivity, response latencies, or receptive fields.
Face processing in humans may share many similarities with the macaque face processing network, which has been studied extensively at high spatiotemporal resolution using fMRI, single-cell recordings, and causal perturbation methods (Afraz et al., 2006, 2015; Tsao et al., 2006; Tsao and Livingstone, 2008; Chang and Tsao, 2017). Electrophysiological recordings targeting the center of fMRI-defined face patches [middle lateral (ML) and middle frontal (MF)] revealed that almost all (97%) visually responsive neurons were face selective (Tsao et al., 2006). Aparicio et al. (2016) investigated the spatial extent of face patch MF and found a very high fraction of face-preferring sites (93%) near the center with a monotonic decrease along any radial spatial axis. As individual cells respond differently to different faces, studies focusing on deciphering face coding in these face patches have demonstrated that face neurons were tuned to face-feature parameters and that the responses of a group of neurons allow predicting the response to a novel face (Chang and Tsao, 2017). By creating abstract synthetic images from the responses to a large set of images, which provoked a higher neural response, Ponce et al. (2019) showed that face neurons responded to visual features present in faces but not to faces per se.
The face patch system of the macaque monkey is currently considered the best understood system for high-level object representation (Hesse and Tsao, 2020). Yet, direct single-cell evidence on face selectivity in humans is extremely rare (Axelrod et al., 2019; Khuvis et al., 2021). We previously reported the first single-cell study on the shape selectivity of single neurons in human visual cortex (Decramer et al., 2019). The current study aims to investigate the neural representation of faces at the level of single-unit activity (SUA) and multiunit activity (MUA) in a cortical region sensitive to faces.
Materials and Methods
Ethical approval was obtained for microelectrode recordings with the Utah array in patients with epilepsy (study number s53126). Study protocol s53126 was approved by the ethical committee (Ethische Commissie Onderzoek UZ/KU Leuven) and was conducted in compliance with the principles of the Declaration of Helsinki, the principles of good clinical practice, and in accordance with all applicable regulatory requirements. Strict adherence to all imposed safety measures, including case report forms and in-detail reports on (serious) adverse events, was required. All human data were encrypted and stored at the University Hospitals Leuven.
Clinical information
The patient, a 28-year old female, underwent a surgical resection of a cystic lesion [World Health Organization (WHO) grade I ganglioglioma; Montreal Neurological Institute (MNI) 28–46, −42 to −62, −5 to −27 mm] in the right occipitotemporal region 7 years before this study at age 21 (Fig. 1), with late seizure recurrence after initial seizure freedom for several years. She was therefore referred for invasive intracranial recordings; she was on brivaracetam, 50 mg twice daily, and perampanel, 8 mg once daily, during this study.
Figure 1.

The patient underwent a resection of a World Health Organisation grade 1 ganglioglioma, located in the right ventral occipitotemporal cortex (arrow), at the age of 21. On the T1 MPRAGE images of the fMRI session, the lesion is delineated with a red border.
A microelectrode array (Utah; Blackrock Microsystems) was implanted to study the microscale dynamics of the epileptic network in the presurgical evaluation according to study protocol s53126. No additional incisions were made for the purpose of the study. The array was placed on the convexity of the brain at the target location of and in combination with clinical electrodes, analogous to previous studies using microelectrode arrays, such as (Truccolo et al., 2011; Smith et al., 2016). Target locations for clinical electrodes were determined by the epileptologist and were based on preoperative electroclinical and advanced imaging investigations [including MRI, PET, SPECT/SISCOM (Subtraction Ictal SPECT Co-registered to MRI)]. The location of the Utah array was at the site of the presumed epileptogenic zone and away from eloquent brain areas, as determined by preoperative task-based motor and language fMRI.
The microelectrode array was implanted in the right occipitotemporal cortex, in an area of cortex with a high probability of resection provided that the presumed ictal onset zone was confirmed. Invasive recordings revealed an anterior temporal epileptic zone. The patient underwent an anterior temporal lobectomy including the mesial temporal structures but not including the recording area several months after this study. After this resection, she was seizure free. We are therefore confident that the area we recorded from did not contribute to seizure activity and could be considered as healthy tissue.
fMRI
fMRI was performed 3 months after array extraction on a 3T scanner (Achieva dStream, Philips) in one session of 60 min. Functional images were acquired using gradient echo planar imaging with the following parameters: 52 horizontal slices (2 mm slice thickness; 0.2 mm gap; multiband acquisition), repetition time, 2 s; time of echo, 30 ms; flip angle, 90°; 112 * 112 matrix with 2 × 2 mm in plane resolution, and sensitivity enhancing reduction factor of 2. Stimuli were projected with a liquid crystal display projector (BarcoReality 6400i, 1024 × 768 pixels, 60 Hz refresh rate) onto a translucent screen positioned in the bore of the magnet (57 cm distance). The patient viewed the stimuli through a mirror tilted at 45° and attached to the head coil. Stimuli were presented for 1000 ms (interstimulus interval, 0 ms) on a gray background, with a stimulus size of 8° and a red fixation square of 0.4°. Two runs of a block-design task using stimuli consisting of human faces (24 s), face pareidolia (24 s), matched control objects (24 s), and fixation (12 s) with four repeats within one run (336 s) were performed.
Data analysis was performed using the SPM12 software package (Wellcome Centre for Human Neuroimaging) running under MATLAB (MathWorks). Preprocessing involved realignment of the images followed by coregistration of the anatomic image and the mean functional image. Before further analysis, the functional data were smoothed with an isotropic Gaussian kernel of 5 mm. For Figure 2 we also performed a 3 mm smoothing and no smoothing. On Figure 2 activations with t > 4.9 (p < 0.05, FWE corrected for multiple comparisons) are shown for the contrast (faces–matched control objects). We calculated the mean percentage signal change (using MarsBaR version 0.41.1) for the two runs for each condition versus fixation and verified the main effect of condition by performing a one-way ANOVA.
Figure 2.

A, Position of the microelectrode array in relation to fMRI activations, t > 4.9 (p < 0.05, FWE corrected for multiple comparisons). The array (black square) is located at the border of the fMRI activation below the lateral occipital sulcus (los) in the inferior occipital gyrus of the right hemisphere. The patient underwent a previous resection of inferior occipitotemporal cortex indicated with a red outline and central asterisk (see above, Materials and Methods; Fig. 1). Inset, The fMRI activations at different degrees of spatial smoothing. An overview of the peak voxel coordinates of the ventral face-selective regions in this patient and of the coordinates of the array in relation to the average OFA and FFA location of previous studies is shown in Table 2. B, Example waveform illustrating a high signal-to-noise ratio. C, Example stimulus for each image category. Movie 1 shows an online demonstration of a face cell.
Microelectrode recordings
The array was interfaced with a digital head stage (Blackrock Microsystems) connected to a 128-channel neural signal processor (Blackrock Microsystems). Spiking activity was high-pass filtered (750 Hz). A multiunit detection trigger was set at 95% of the noise of the signal. Because we recorded in the first week after implantation, the spike waveforms changed markedly from day to day, indicating that we recorded from different neurons on consecutive days. Therefore, we considered the units recorded on each recording day as different neurons. Because not all tests were run on every recording day and because we lost recording channels during the testing period because of a connector issue, the numbers of units differed between the tests (Table 1). Spike sorting was performed offline (Offline Sorter version 4, Plexon). On most channels we could isolate one single unit, on five channels we isolated two visually responsive single units.
Table 1.
Number of responsive single units and MUA sites for the different experiments
| Contrast | Single units | MUA sites | |
|---|---|---|---|
| Categories (Across d2, d4, d6) | Visual responsive | 67 | 96 |
| Within-category face (d6) | Face > object from categories d6 | 10 | 18 |
| Receptive field (d6) | Face > object from categories d6 | 10 | 18 |
| Feature scrambled (d8) | Visual responsive | 6 | 17 |
| Face-like objects (Across d4, d6) | Visual responsive | 44 | 50 |
recording day (d).
Stimuli and tests
Stimuli were presented in a custom-made stereoscope. Images from two LCD monitors were presented to the right and left eyes with the use of customized mirrors at a viewing distance of 56 cm (1 pixel = 0.028°). The patient was instructed to fixate a small red square (0.2 × 0.2°) at the center of the display. Fixation was monitored through continuous eye-movement tracking (left eye, 120 Hz; ISCAN), ensuring fixation in an electronically defined window (3 × 3°). To accurately estimate latencies, a photodiode was used, which was activated by a small white square on the same frame as the stimulus.
Categories experiment
The patient was asked to discriminate between achromatic photographs of birds (target) and other stimuli by button press; distractors were mammals, fruits, bodies (human–monkey), faces (human–monkey), objects (controlled for human bodies and controlled for monkey bodies), and sculptures displayed in the center of the screen (stimulus size, 7°), 20 stimuli per category (Popivanov et al., 2014). Birds appeared randomly in 10% of trials. All stimuli were presented for 800 ms, and only correct trials were included for analysis. We recorded on days 2 (300 correct trials), 4 (300 correct trials), and 6 (204 correct trials) after array implantation and pooled the data over these three sessions. Each image was presented two times during each session.
Within-category face selectivity experiment
The patient passively viewed achromatic images of famous people (n = 10), familiar faces (n = 2; her mother and the senior neurosurgeon, T.T.), and familiar cartoon faces (n = 6) at the center of the screen (duration, 1000 ms; stimulus size, 6°). We recorded on day 6 (200 trials) after array implantation, and each image was presented at least 10 times.
Receptive field test
To map the receptive field (RF), a single famous face stimulus (6°) was presented at 25 different positions in the visual field, covering 50 degrees horizontally and 30 degrees vertically, during passive fixation. We recorded on day 6 (324 correct trials) after array implantation. We monitored eye position in an electronic-defined 3 × 3° visual angle window. Trials in which the patient lost fixation were aborted and were not included in the analysis. Fixation performance was 88%.
Feature-scrambled faces experiment
The patient passively viewed achromatic images of faces (stimulus size, 6°) at four different positions around the fixation point. Feature-scrambled stimuli with the same contour were presented at the same location, and several feature-scrambled stimuli with face components over the visual field were presented. Each stimulus had two exemplars (male and female), rendering 32 individual stimuli. We recorded on day 8 (254 trials) after array implantation. Each individual stimulus was presented ∼8 times.
Face pareidolia experiment
Stimuli consisted of 32 real faces, 32 face-like objects, and 32 matched control objects and measured 8°. The patient had to categorize human faces (1 of three trials, button 1) versus other stimuli (face-like and matched controls; button 2) appearing at the center of the display by a button press at stimulus offset (after 1000 ms of stimulus presentation). Only correct trials were included for analysis. We recorded on day 4 (277 correct trials) and on day 6 (227 correct trials) after array implantation and pooled the data over these two sessions. Each stimulus was presented 2–3 times during each session.
Neurophysiology data analysis
All data analysis was performed using custom-written MATLAB (MathWorks) scripts. Net average spike rate was calculated by subtracting the baseline spike rate (0–200 ms before stimulus onset) in each trial. Next, the spike rate per trial was normalized by dividing by the average maximum response calculated in the 25–250 ms interval after stimulus onset. The significance of visual responses and of response differences between conditions was assessed by permutation tests, in which real data were randomly distributed over different conditions 1000 times. The differences between two conditions were calculated for every permutation and compared with the actual difference between conditions. The signal-to-noise ratio of the example neuron was calculated by dividing the valley-to-peak with the width of the band before the valley. Latencies were determined as the center of the first of two consecutive 20 ms bins with a spike rate higher than the average baseline plus two times the SD. Selectivity latencies were determined as the center of the first of two consecutive 20 ms bins in which the spike rate in one condition exceeded the average spike rate (plus two times the SE) in the other condition. To compare the latencies with the results our previous work (Decramer et al., 2019) and to exclude a firing-rate-dependent effect, we matched the spike rate in the 0–400 ms interval of the categories experiment to the lateral occipital experiment in our previous paper by randomly removing spikes.
We analyzed the neuronal selectivity in the face pareidolia experiment by ranking the average spike rate for each individual face-like stimulus and applying the same ranking to the face-like match stimuli. Responses to face stimuli were ranked as well. The 95% confidence interval for the regression lines are shown in Table 1; those of the matched control did not statistically differ from zero.
For RF mapping, the average SUA and high-gamma power were calculated during stimulus presentation for each stimulus position and filtered with a Gaussian (σ, 0.5). To calculate RF size, we constructed RF maps by interpolating the neuronal responses between all positions tested across the 50 × 30° display area and then calculating the number of pixels in the RF map with a response higher than 50% of the maximum response. An ANOVA between neural response and stimulus position was performed.
Results
We had the unique opportunity to record SUA and MUA with a microelectrode array in an fMRI-defined, face-selective region in occipitotemporal cortex of an epilepsy patient (Fig. 2A). This patient, a 28-year old female, underwent a resection of a lesion (WHO grade I ganglioglioma) in the right ventral occipitotemporal cortex (anterior to the recording area) 7 years earlier (Fig. 1). Based on the CT-MRI coregistration, the array (MNI 55, −71, 1; Talairach 56, −70, 5) was located in the anterior superior part of the fMRI activation (faces compared with objects) in occipitotemporal cortex (peak voxel MNI 48, −78, −6; near the right OFA; Pitcher et al., 2009, 2011; Bona et al., 2015; Schobert et al., 2018). To better assess the location of the array relative to the fMRI activations, we also show the contrast (faces compared with objects) with different degrees of smoothing (Fig. 2A, inset). Table 2 shows a comparison with MNI coordinates of the OFA in previous studies. This face-selective fMRI activation was part of a larger object-selective activation (contrast intact images of objects compared with scrambled images of objects; Decramer et al., 2019), which is usually referred to as the lateral occipital complex. The signal quality of the extracellular recordings was remarkably high as we detected single-unit activity on multiple electrodes per day (14–42 electrodes) with large and easily discriminable waveforms as illustrated by the example waveform (signal-to-noise ratio of 3.7) in Figure 2B. To illustrate the brisk response to faces, a video of an example neuron is provided in Movie 1.
Table 2.
Array location and OFA and FFA peak voxels compared with MNI coordinates from the literature
| MNI coordinates | X | Y | Z |
|---|---|---|---|
| rOFA Bona et al., 2015 | 46 ± 5 | −75 ± 5 | −3 ± 5 |
| rOFA Pitcher et al., 2009 | 45 | −80 | −12 |
| rOFA Schobert et al., 2018 lOFA Schobert et al., 2018 rFFA Schobert et al., 2018 lFFA Schobert et al., 2018 |
39 ± 5 −41 ± 6 40 ± 4 −38 ± 2 |
−79 ± 6 −81 ± 6 −55 ± 8 −58 ± 9 |
−6 ± 5 −4 ± 7 −12 ± 3 −14 ± 3 |
| lOFA pt | −40 | −80 | −12 |
| lFFA pt | −46 | −58 | −20 |
| rOFA pt | 46 | −76 | −14 |
| Microelectrode array | 55 | −71 | 1 |
The MNI coordinates of the right FFA from the literature overlap with the coordinates of the lesion that was resected 7 years earlier. patient (pt); right OFA (rOFA); left OFA (lOFA); right FFA (rFFA); left FFA (lFFA). The patient coordinates are shown in bold.
Online demonstration of face cell. The patient looks into a mirror or looks away. In the background you can see and hear the brisk response of this cell when she sees her own face. When she closes her eyes, there is no spiking activity.
Category-selective responses in human visual cortex
First, we wanted to investigate face selectivity across the microelectrode array. We recorded SUA (N = 67; pooled over three recording sessions on days 2, 4, and 6) and MUA (N = 96; pooled over the same recording sessions) responses to images of different categories (human faces, monkey faces, human bodies, monkey bodies, objects, sculptures, and fruits; Fig. 2C) as in Popivanov et al. (2014). Many of these visually responsive recording sites showed category selectivity for faces versus objects (permutation test, p < 0.05; SUA, 36/67, 54%; mean d' SUA, 0.66; MUA, 57/96, 59%; mean d' MUA, 0.90). The example SUA in Figure 3A responded strongly and at short latencies (∼70 ms) to images of human and monkey faces but almost did not respond to any of the other categories.
Figure 3.
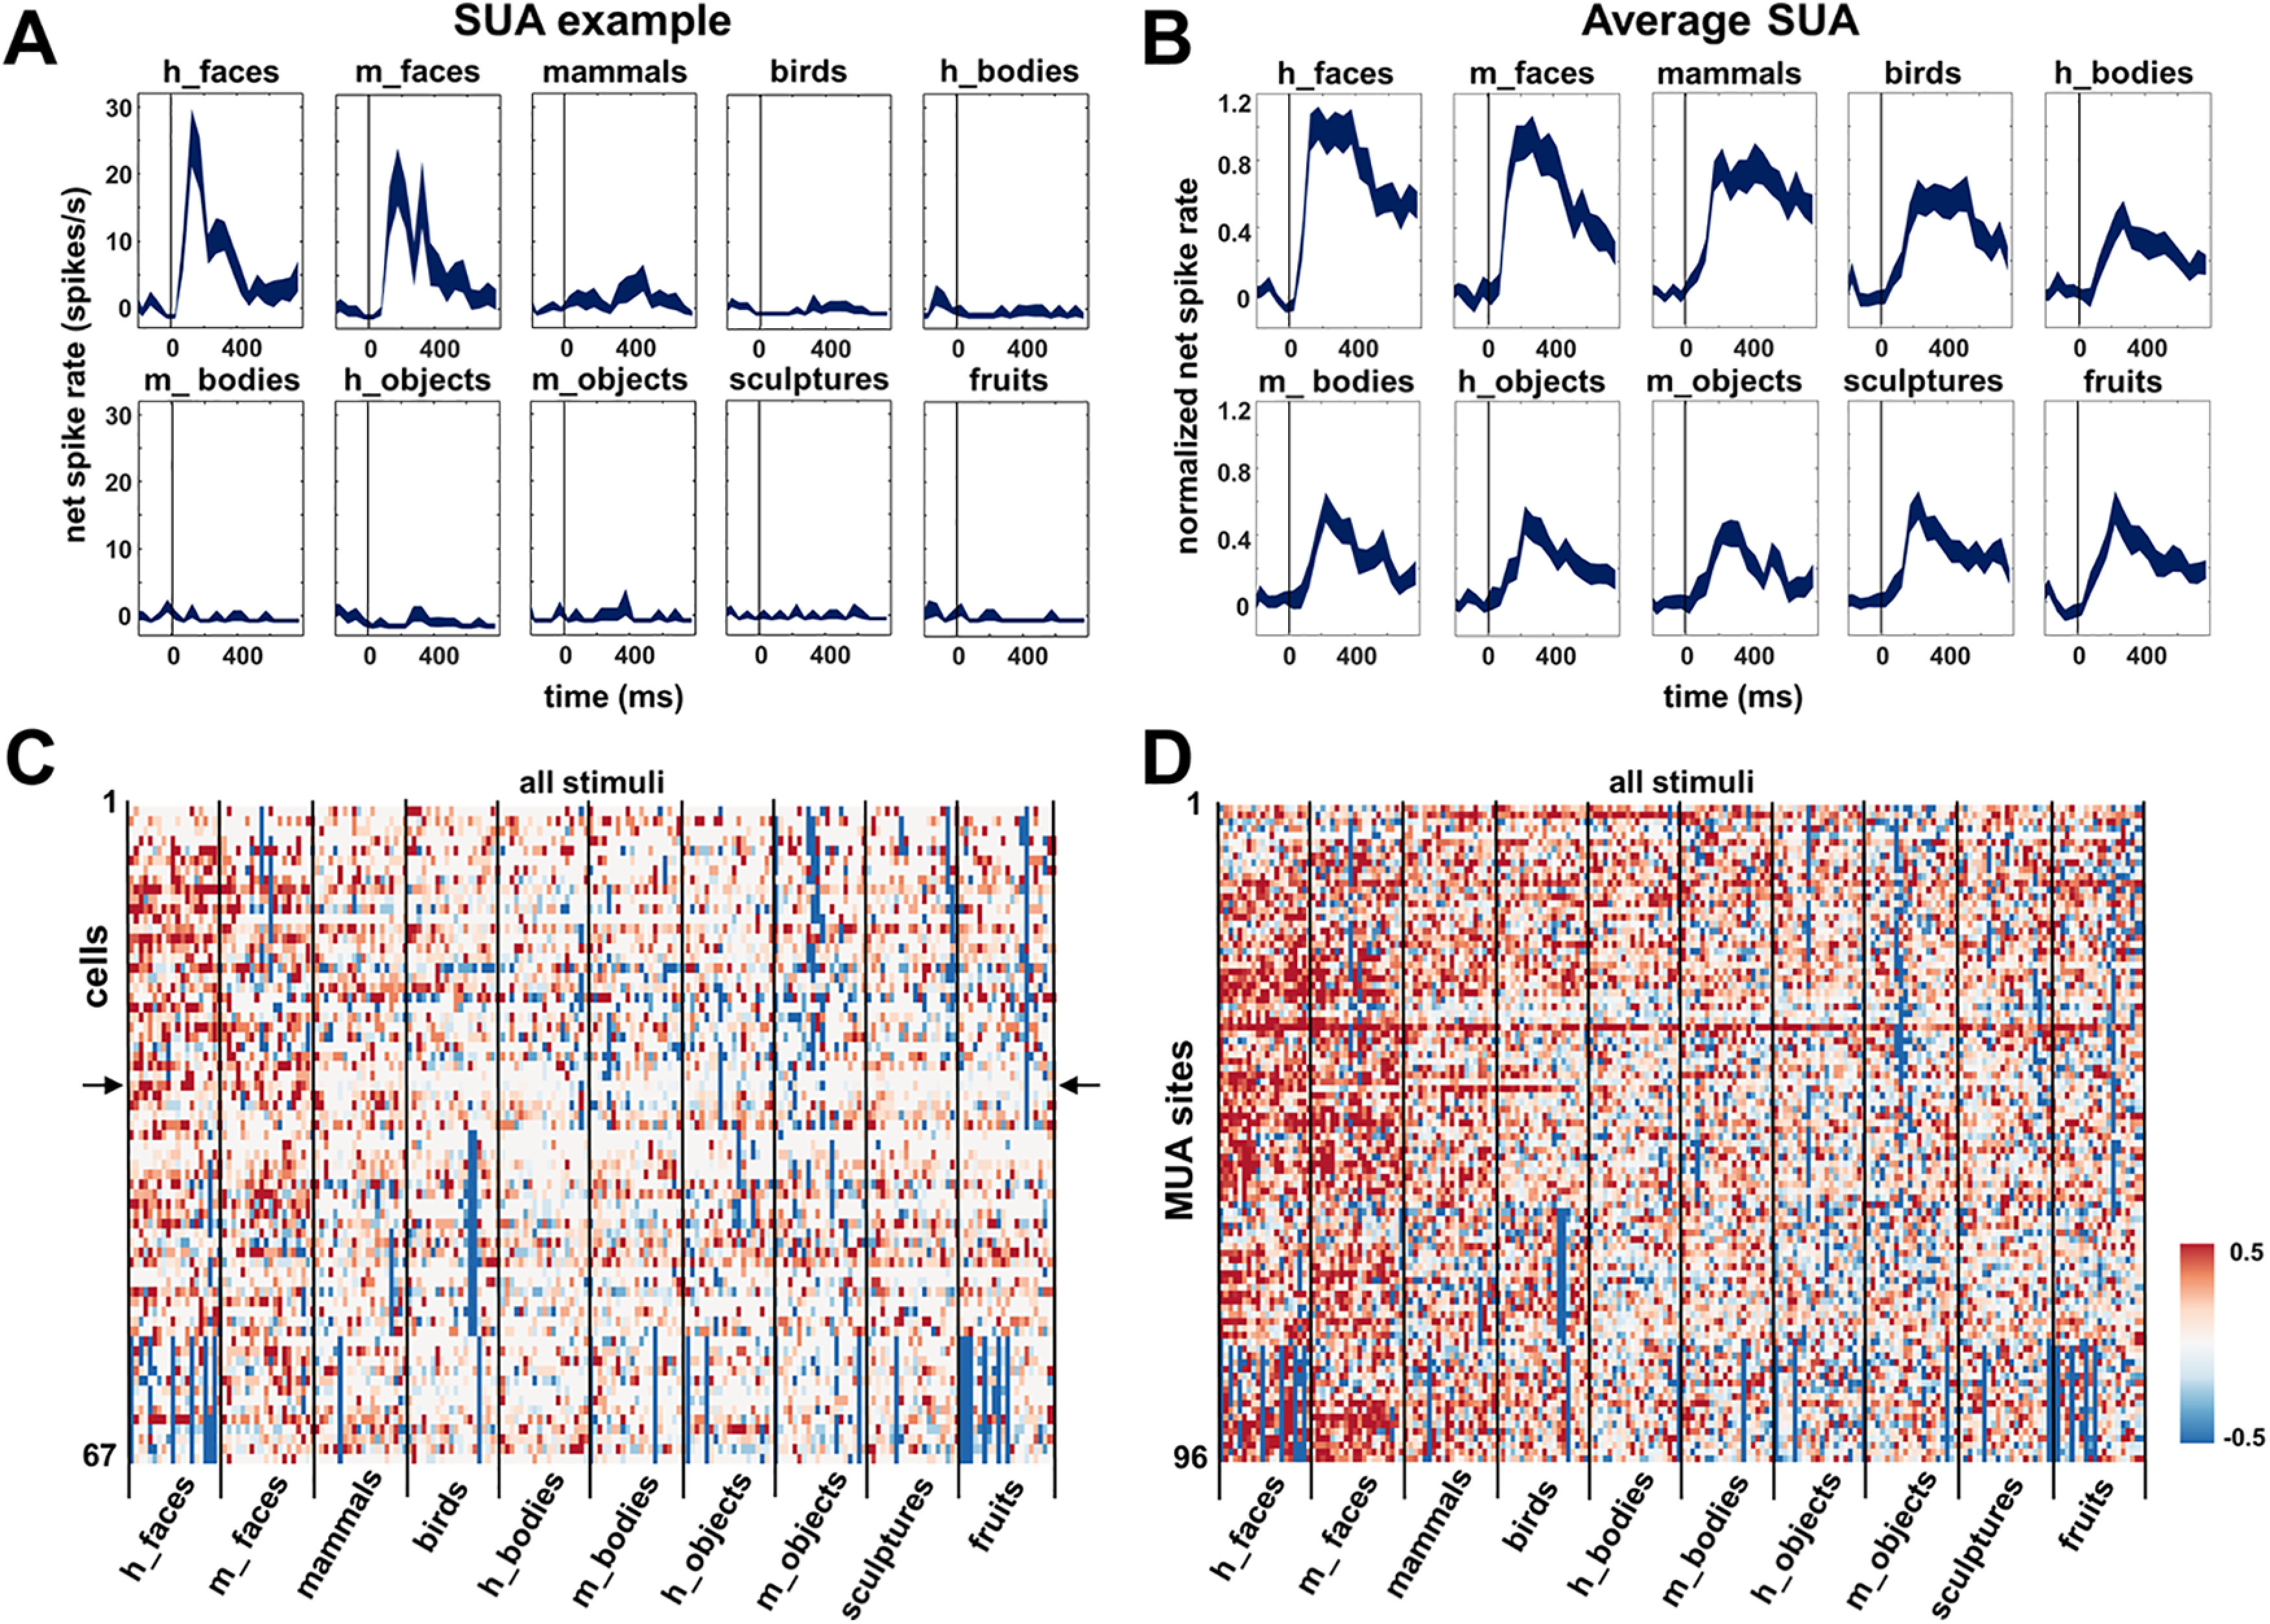
Category selectivity. A, Example SUA, selective responses to faces (both human and monkey) with almost no response to the other categories. B, Average SUA over all visually responsive units (N = 67). C, Net normalized response illustrating between- and within-category selectivity of all visually responsive SUAs (N = 67); the example SUA is depicted with arrows. D, Net normalized responses of all visually responsive MUA sites (N = 96).
The average response of all visually responsive SUA to faces (N = 67; Fig. 3B) emerged very shortly after stimulus onset (70 ms; median response latency of 110 ms for SUA and 70 ms for MUA), whereas the average response to objects and bodies was weaker and later (∼120 ms). Figure 3C illustrates the between- and within-category selectivity of all visually responsive SUA (N = 67) by plotting the net normalized responses to every stimulus in the test. The example neuron from Figure 3A responded exclusively to a subset of the face stimuli (Fig. 3C, arrows). For most single neurons we recorded, it is clear that both the human and the monkey face categories evoked the strongest responses, but individual stimuli from the other categories could activate these neurons as well. The average response to mammals and birds (which also contained faces) was lower than to face stimuli, and the other stimulus categories evoked even weaker responses. Figure 3D illustrates the between- and within-category selectivity of all responsive MUA sites (N = 96), showing similar results.
Many electrodes exhibited strong selectivity for faces compared with bodies (Fig. 4; e.g., on recording day 2, N = 15 with d' > 1), but we also observed a small number of electrodes with stronger responses to bodies than to faces (2 MUA and 2 SUA, Fig. 4A, blue squares; Fig. 4C, example recording site), located at the anterior edge of the array. Thus, although dominated by face-selective responses, this region also contains body-selective sites in close proximity to clusters of neurons preferring faces. Overall, consistent with the fMRI localizer, we recorded in a relatively homogeneous face-selective patch of object-selective visual cortex.
Figure 4.

Face versus body selectivity. A, MUA d' values across the array for the recording session on day 2, illustrating a face (+) and a body (*) selective site. B, Corresponding MUA response profiles of face selective site. C, Corresponding MUA response profile of body-selective site.
Next, we wanted to determine to what extent these face cells (defined as face response > object response from the category experiment, one recording session on day 6; SUA, N = 10; MUA, N = 18) differentiate among human faces, that is, within-category face selectivity. Moreover, we wanted to see whether these face neurons could also be activated by cartoons. We presented images of famous faces (actors, politicians, N = 10), faces of people familiar to the patient (N = 2, her mother and the neurosurgeon), and a set of famous cartoon faces (N = 6). Overall, most face cells (SUA, N = 7/10; MUA, N = 11/18) showed differential responses within the face category (ANOVA p < 0.05, Fig. 5A; 6/10 SUA and 6/18 MUA sites were significantly selective for the human faces, excluding the cartoon faces). To quantify the width of the selectivity, we calculated a selectivity index defined as Swidth = (n − ∑ri/max)/(n − 1; Rainer et al., 1998), which is equal to one if the neuron only fires to a single stimulus in the test and zero if the neuron fires equally to every stimulus. In our face test, the Swidth averaged 0.44 (ranging from 0.73 to 0.26) for MUA and 0.75 (ranging from 1.0 to 0.58) for SUA, indicating that although the face cells in this brain region respond to a wide range of faces, a considerable amount of within-category selectivity was present. The average MUA and SUA (Fig. 5B) responses in this test also indicate that we measured significant responses to every face stimulus in the test, without apparent preference for famous, familiar, or cartoon faces.
Figure 5.
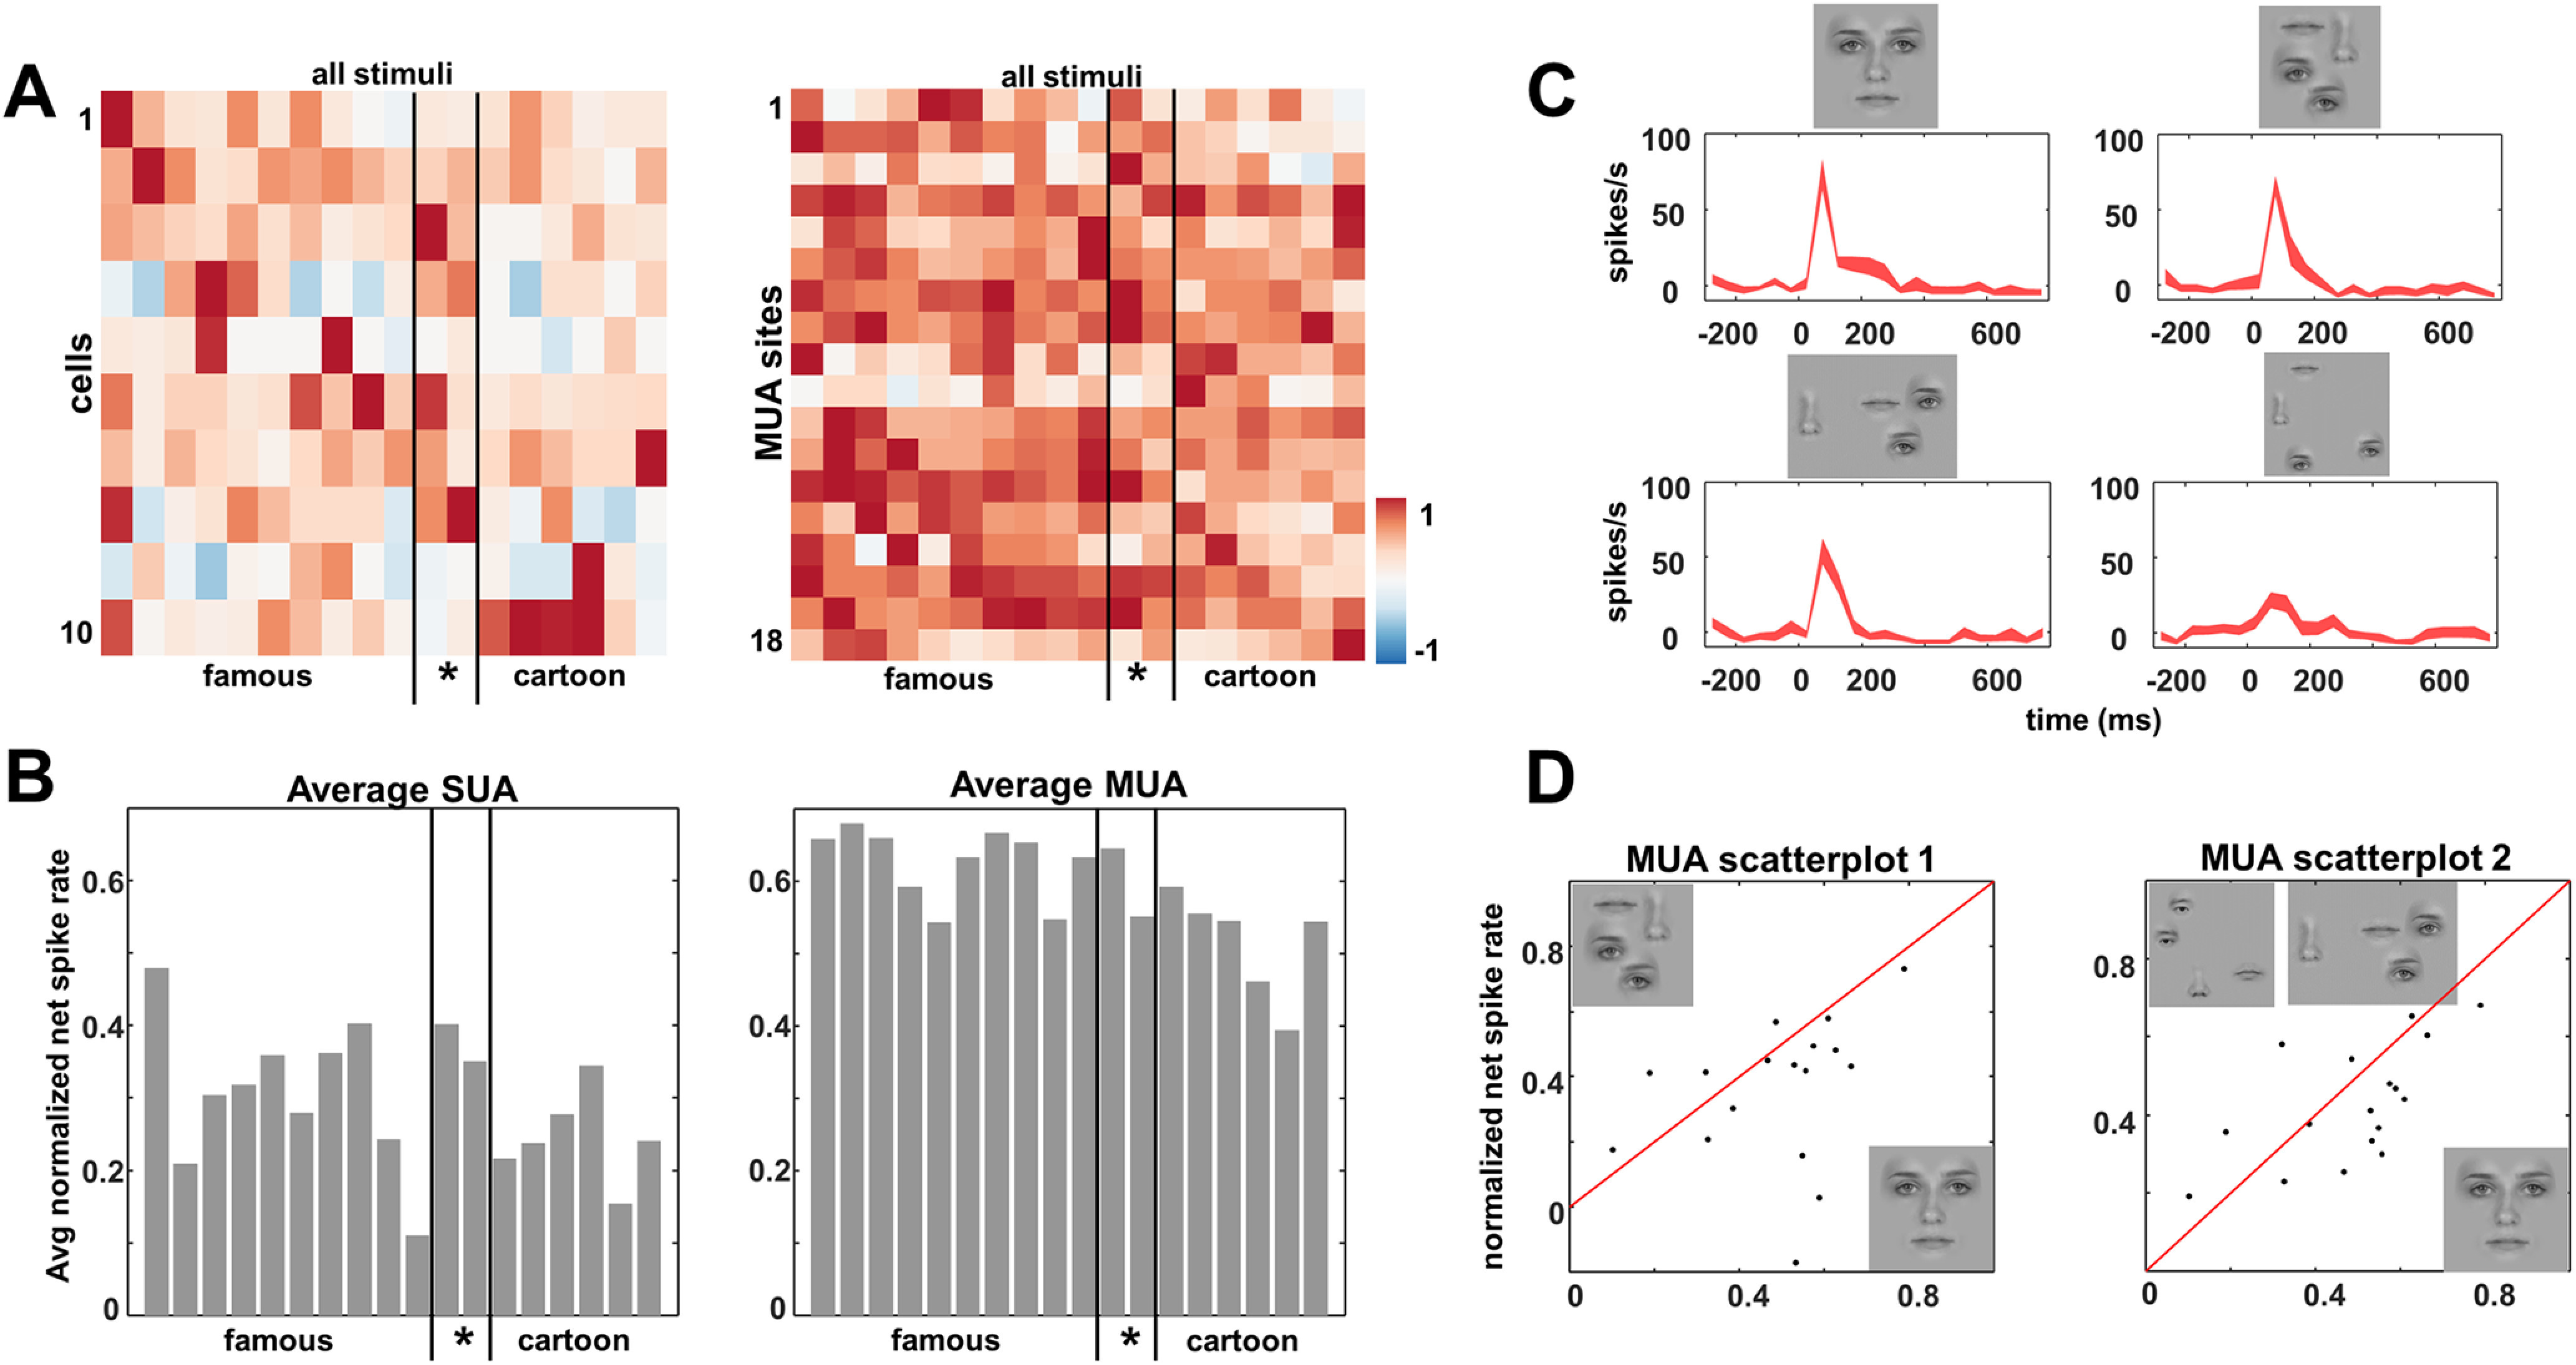
Within-category face selectivity and effect of feature scrambling. A, Normalized SUA (left) and MUA (right) response for each site and stimulus. B, Average normalized net response for all sites per stimulus. C, Example SUA response to feature scrambling; example stimuli are shown in D. D, MUA scatter plot for intact versus feature scrambled faces at same location (left) and for intact versus feature scrambled faces with the face elements farther apart (right).
The results obtained using famous faces demonstrate that the face cells we recorded from in human visual cortex were broadly tuned to face stimuli. Do these neurons respond to discrete facial features or to whole faces? To address this question, we investigated how these neurons responded to feature-scrambled faces, in which the position of the face elements (eyes, nose, lips, and mouth) was altered (Fig. 5C,D). The example neuron fired strongly to the intact face (Fig. 5C, upper left), and the feature-scrambled face at the same location evoked a virtually identical response (Fig. 5C, upper right; t test, p = 0.102), indicating that the spatial configuration of the face elements was not critical for this neuron. However, stimuli in which the face elements were further dispersed in the visual field (Fig. 5C, bottom) evoked significantly lower responses (t test, p = 0.032 and p < 0.001, respectively) compared with the intact face. Overall, most single neurons (4/6, 67%) and MUA sites (14/17, 82%) did not respond more to the preferred intact face than to the corresponding feature-scrambled face in which the face elements occupied the same position in the visual field. The normalized net MUA responses to intact versus feature-scrambled faces for each MUA site are depicted in two scatter plots (Fig. 5D), illustrating that most sites also responded to feature-scrambled faces even when the face elements were farther apart.
To map the RF, we presented one of the famous faces (size, 6°) at 25 positions covering a 30 × 50° area of the visual field. Figure 6A shows an example SUA, selective for faces (as defined in the category experiment with p < 0.05, permutation test immediately after the RF mapping on day 6), illustrating the large RF of this cell. Of 18 MUA sites (defined as face > object; p < 0.05, permutation test) from the category experiment on day 6), 11 sites (61%) showed bilateral (10) or ipsilateral (1) RFs. Six MUA sites responded maximally at the midline (five at the fovea), six maximally in the contralateral hemifield, and six maximally in the ipsilateral hemifield. From these 18 MUA sites, five were selective for position (ANOVA p < 0.05), most likely because we could not optimize the stimulus for each MUA site. From the 34 face-selective high-gamma (80–120 Hz) local field potential sites (defined as face > object; p < 0.05, permutation test) from the category experiment on day 6), 23 (68%) showed bilateral responses. Twenty-seven responded maximally at the midline (24 at the fovea), seven maximally in the contralateral hemifield, and none maximally in the ipsilateral hemifield. From these 34 high-gamma sites, 30 were selective for position (ANOVA p < 0.05). The average MUA RF and average high-gamma RF are shown in Figure 6, B and C. Overall the RFs were large and bilateral with a contralateral preference.
Figure 6.

Receptive field maps. A, Single-unit example plots illustrating responses during the RF test, this neuron has a large contralateral receptive field. B, Average RF for all face-selective MUA and high-gamma sites indicating large mainly contralateral receptive fields. Black dots indicate responses higher than 50% of maximum response.
Face pareidolia
To further define the tuning to facial features at the single-cell level, we capitalized on the phenomenon of face pareidolia (Fig. 7A), the compelling illusion of perceiving illusory facial features in inanimate objects, which is experienced by both humans (Liu et al., 2014; Nihei et al., 2018; Wardle et al., 2020) and macaque monkeys (Taubert et al., 2017). This phenomenon is relevant because, unlike real faces, examples of face pareidolia (hereafter referred to as face-like objects) have facial features that are highly variable in terms of visual attributes. Responses to face-like objects would indicate that these neurons respond to visual features present in faces and not to faces per se. In the fMRI activation (faces–objects), the percent signal change evoked by face-like objects was intermediate between that evoked by faces and by objects (Fig. 7C).
Figure 7.
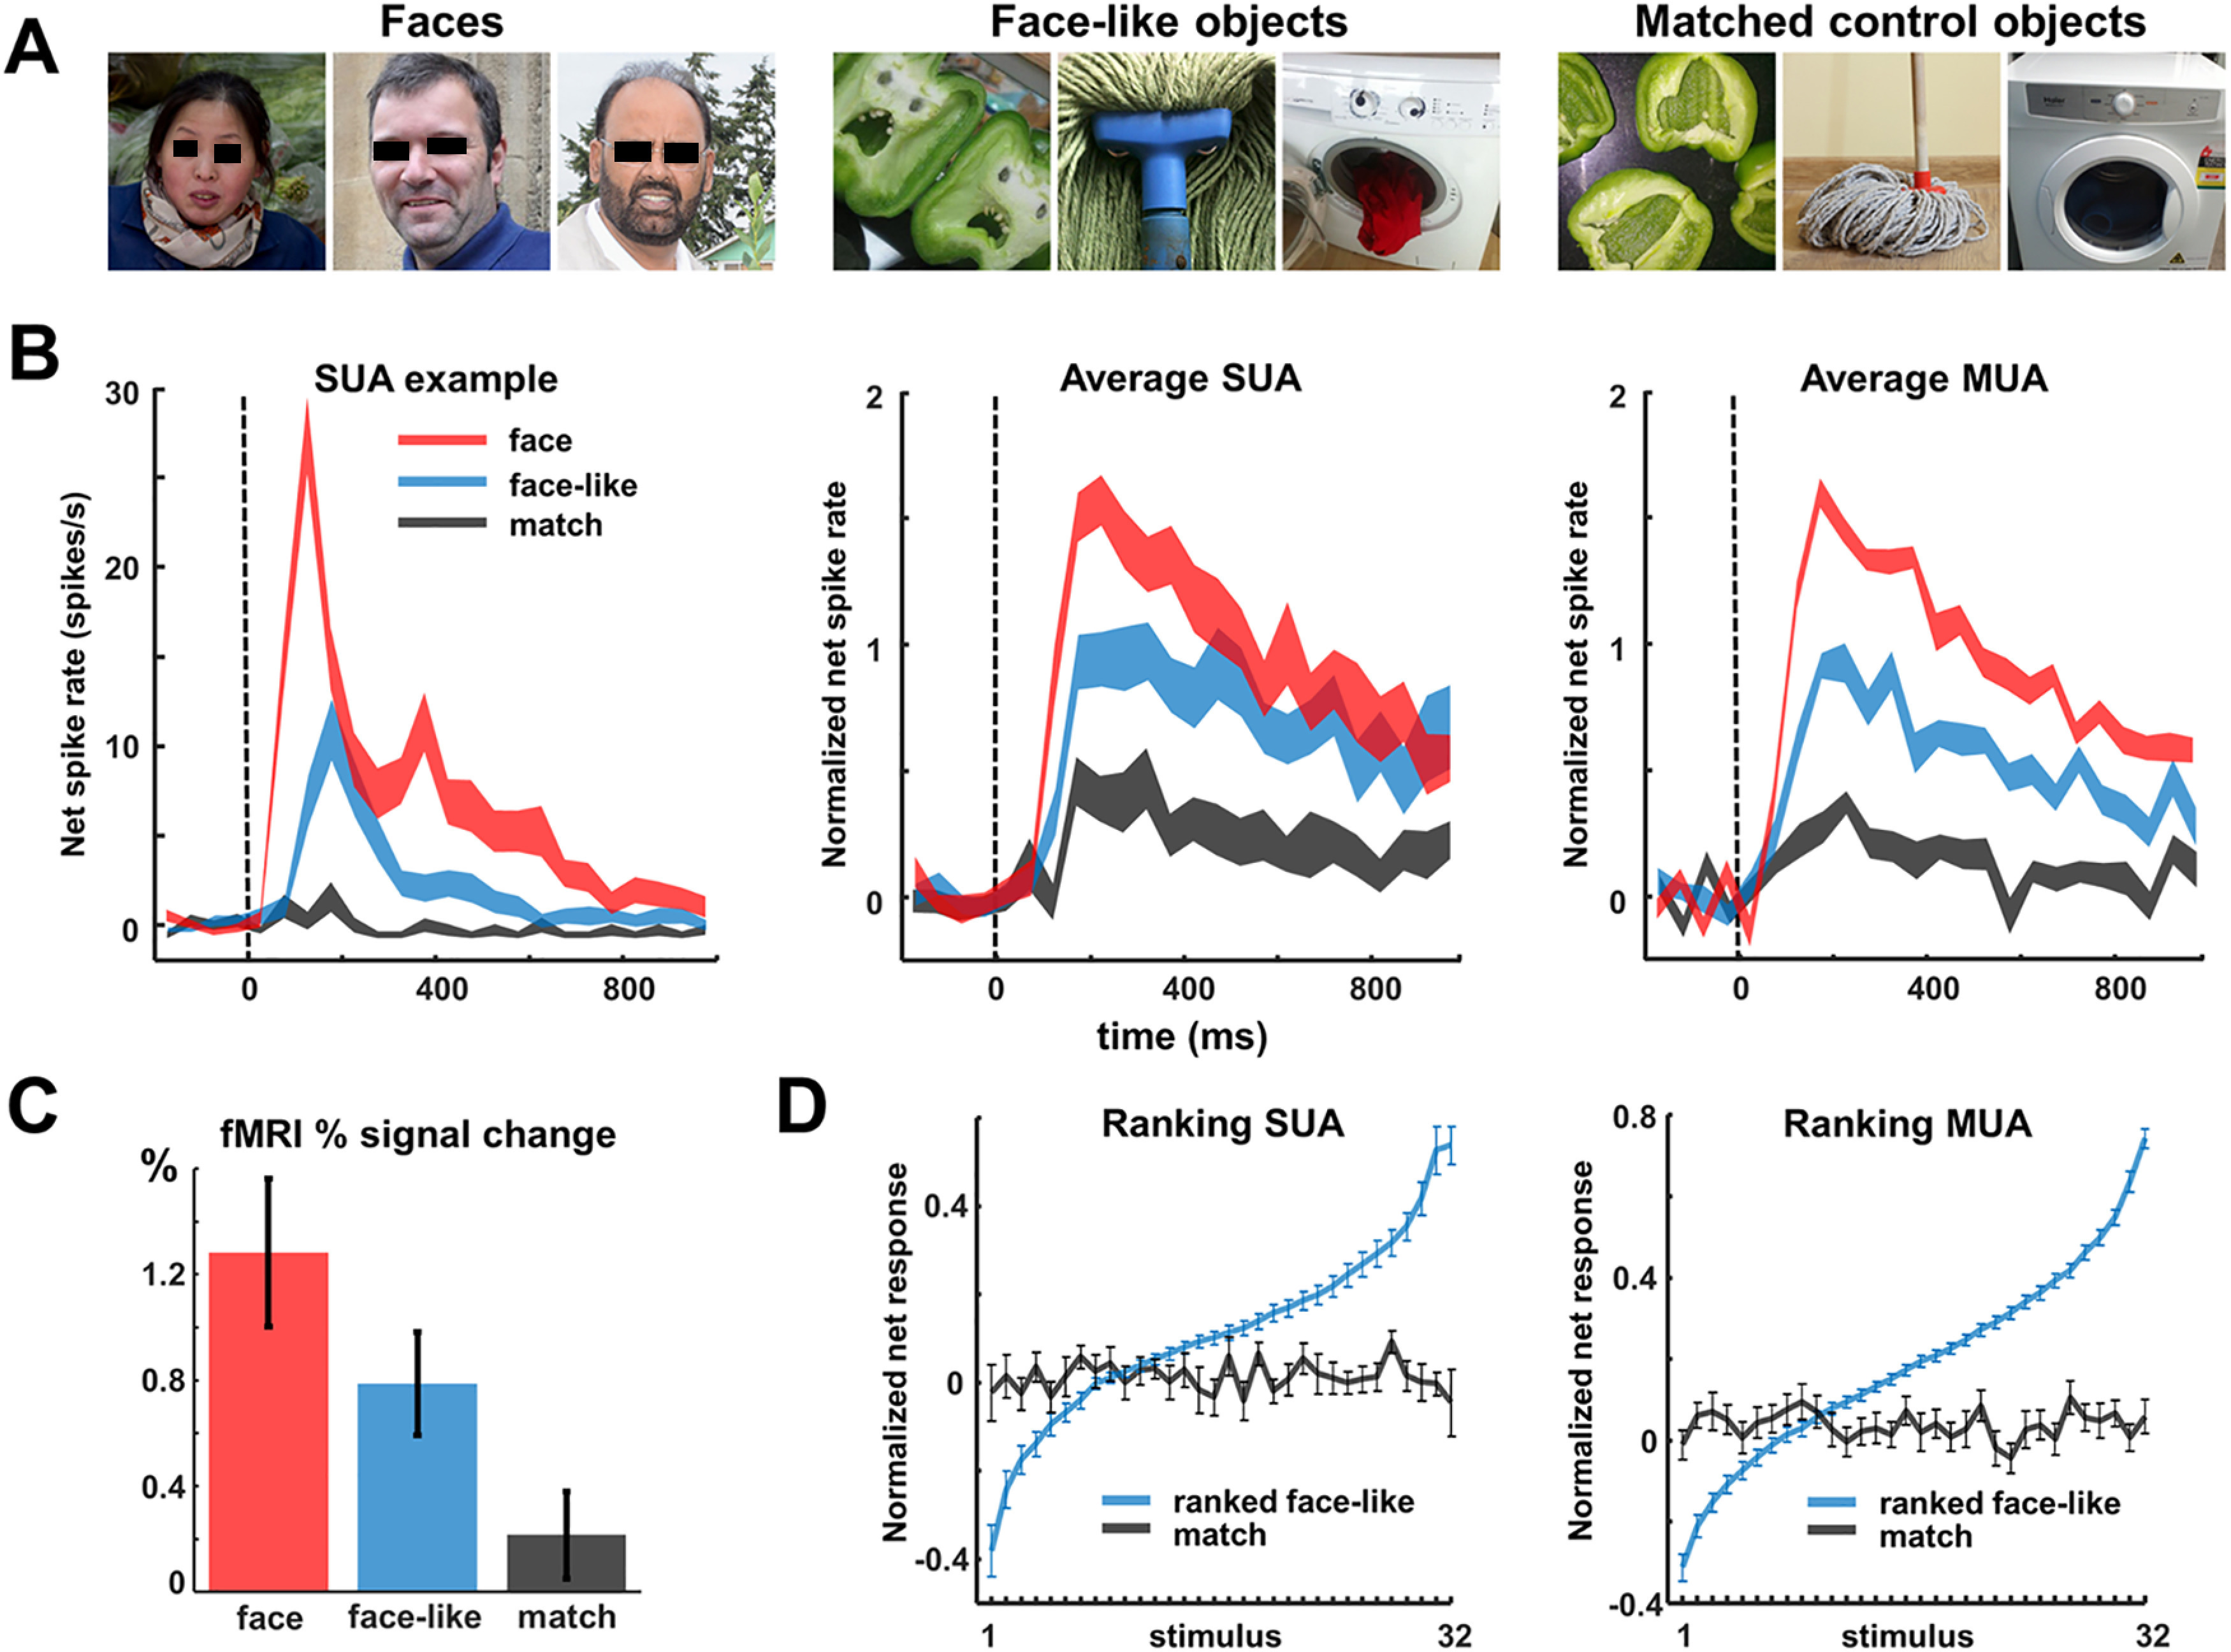
Face-like objects. A, Example stimuli of faces, face-like objects, and matched control objects. B, SUA example illustrating the intermediate response to face-like objects. Average SUA (N = 44) and MUA (N = 50) over all visually responsive sites. C, fMRI percent signal change at the right OFA activation 6 weeks after removal of the microelectrode array. D, Average ranking for the 32 face-like stimuli for both SUA and MUA.
The example neuron in Figure 7B responded strongly to faces and weakly to control objects (matched in object category; Wardle et al., 2017, 2020). The response to face-like objects was distinctive because it was greater than the response elicited by nonface objects, yet weaker than the response to real faces. For this example neuron recorded in human visual cortex, the average response to face-like objects (14 spikes/s) was less than half of that to faces (31 spikes/s), and significantly delayed compared with the responses to real faces (peak response at 170 ms for face-like objects vs 90 ms for faces). In total, we recorded the activity of 44 visually responsive single neurons to faces, face-like objects and matched control stimuli, the majority of which (26/44, 59%) were selective for faces compared with objects. Averaged over all visually responsive single units, the normalized response to faces was significantly stronger than that to control objects, whereas face-like objects elicited an intermediate response (Fig. 7B, middle). This pattern was even more pronounced for the multiunit activity (N = 50, 72% were selective for contrast face > matched control object; Fig. 7B, right). The median selectivity latency (faces > control objects) was 130 ms for SUA and 110 ms for MUA. Moreover, the preference for real faces within our neuronal population was very robust as only three single neurons and no MUA site preferred face-like stimuli over faces (at p < 0.05). Moreover, no SUA or MUA preferred control objects over faces (at p < 0.05).
To assess the relative importance of face and object features, we ranked the face-like objects based on the average normalized SUA responses for each cell separately, calculated the average response to the ranked stimuli across channels, and compared the responses in this ranking with the corresponding matched control objects (i.e., stimuli with the same object identity; Fig. 7D). This procedure was repeated for MUA. The slopes of the linear fits to these curves reveal the neuronal selectivity for face-like objects and whether this selectivity was preserved for the corresponding matched control objects. The selectivity for face-like stimuli was considerable (Fig. 7D), only 19% (for SUA) and 22% (for MUA) of the stimuli-evoked responses above 50% of the maximum response. However, no systematic preference was present for the corresponding matched control objects because the slopes of the regression lines were not significantly different from zero, indicating that the presence of face-like features was critical to drive neurons in this face-selective region.
Discussion
Reports of single-neuron responses in face-selective regions of human visual cortex remain scarce (Axelrod et al., 2019; Khuvis et al., 2021). No previous study has reported detailed single-neuron responses in an fMRI-defined face-selective region in human visual cortex using a microelectrode array.
In a manner analogous to face cells in the temporal cortex of the macaque monkey, individual human occipitotemporal neurons showed strong and early selectivity for faces, consistent with fMRI activations. Feature-scrambled faces were often effective in driving the neuronal responses, and face-like objects also elicited reliable responses from this face-selective region. Thus, neurons at this level of the visual hierarchy are broadly tuned to the features of a face, independent of spatial configuration and low-level visual attributes, such as color.
We do not claim that the recording area was within the OFA proper because the location of the array was relatively dorsal compared with the average MNI coordinates of the peak voxel of the OFA in previous studies. For our fMRI analysis, and similar to most fMRI studies, we used spatial smoothing, which can influence the extent of the fMRI activation. It is important to note that we performed fMRI 3 months after microelectrode recordings, which might influence BOLD response at the implantation site. Moreover, the previous resection in the same hemisphere may have caused reorganization of more posterior visual areas. In addition, the intracranial recordings with depth electrodes revealed that this patient had mesial temporal lobe epilepsy, which can affect the organization of the face processing network as well (Riley et al., 2015).
However, our results strongly suggest that we recorded at an early stage in the face processing hierarchy. The face cells also responded to feature-scrambled faces, response latencies were short (as early as 70 ms), the tuning within the face category was relatively broad, and face-like stimuli also activated the neurons. On the other hand, RFs were large and bilateral, consistent with our previous study (Decramer et al., 2019) and earlier fMRI studies of the OFA (Hemond et al., 2007). A previous study demonstrated that the size of population RF in the OFA is dependent on attention and stimulus size, which we did not alter during our experiment. A thorough comparison between population RFs as measured with fMRI and the actual RFs of MUA should be done in the same subject, which was not possible in the current study. We observed considerable selectivity within the face category compared with the most studied face patch in the macaque monkey, the ML (Tsao et al., 2006). In the absence of single-unit recording data in other face-selective regions in human visual cortex, however, it remains difficult to draw strong conclusions about possible homologies with the macaque face patches (Rossion and Taubert, 2019).
The results of the face feature scrambling and the face-like objects experiment were consistent and clearly suggested that the face cells we recorded from could be activated by face features and did not require intact faces, in agreement with the face feature map in OFA reported in a fMRI study (Henriksson et al., 2015). Although we did not present separate face features (such as an image of a human eye), both scrambled faces and face-like objects, which contained some face features, were in general able to activate these face-selective neurons. This is consistent with the fact that neurons in monkey inferior temporal cortex (IT) do not respond to faces per se, but to the visual features present in faces (Ponce et al., 2019).
Multivoxel pattern analysis of fMRI data has suggested the presence of within-category selectivity in both the OFA and FFA (Goesaert and Op de Beeck, 2013; Tsantani et al., 2021), consistent with our results at the SUA and MUA levels. However, the decoding accuracy of face identities in the right OFA (rOFA) was mainly linked to low level image-based properties (Tsantani et al., 2021). The category selectivity we observed was less pronounced than in some of the macaque face patches (Tsao et al., 2006). Approximately half of the visually responsive SUA and MUA sites were not category selective, and we even observed a few body-selective sites on the same four by 4 mm electrode array. These observations could at least partially be explained by the fact that the electrode array was located at the edge of the fMRI activation (faces–objects). A previous study in the macaque face patch ML reported a gradient in the number of face-preferring sites from the center toward the periphery (Aparicio et al., 2016; see also Bell et al., 2011).
The latency of the face responses we report here (70 ms) was shorter than the latency of 125 ms reported in two previous studies with neurons near or in the FFA (Axelrod et al., 2019; Khuvis et al., 2021). The median latency (SUA, 110 ms; MUA, 70 ms) was also shorter compared with the responses to images of objects in our previous study (SUA, 150 ms; MUA, 150 ms; Decramer et al., 2019), which was in the same area. This latency difference remained even when we randomly removed spikes in the 0–400 ms interval to match the average responses to the ones measured in the previous study (corrected median SUA latency, 130 ms; corrected MUA latency, 70 ms). Note also that SUA and MUA responses were consistent with the pattern of fMRI responses to faces, face-like stimuli, and objects. Thus, our results also represent a unique validation of an extensive body of research using fMRI to study face processing in human subjects (Kanwisher et al., 1997; Grill-Spector et al., 2004, 2017).
Single neurons selective for faces have also been reported in the medial temporal lobe of epilepsy patients (Fried et al., 1997). These face cells respond with a much longer latency of ∼300 ms (Kreiman et al., 2000), are multimodal [i.e., also respond to written (Quiroga et al., 2005) and spoken names (Quian Quiroga et al., 2009)], and frequently signal face identity. These medial temporal regions occupy a much higher level in the face processing network (Tsao et al., 2008), explaining the late responses.
Although human intracortical recordings remain scarce, they provide an extraordinary opportunity to study the human brain with unparalleled spatiotemporal resolution. Neural recordings in fMRI-defined patches in human cortex are critical for validating human fMRI data and provide a novel way to bridge the gap between human imaging and invasive studies in animal models.
Footnotes
This work was supported by Fonds Wetenschappelijk Onderzoek (FWO) Odysseus Grant G.0007.12 and Katholieke Universiteit Leuven C1 project C14/18/100. T.T. was supported by FWO (senior clinical researcher, FWO Grant 1830717N). We thank Stijn Verstraeten, Piet Kayenbergh, Gerrit Meulemans, Christophe Ulens, Anaïs Van Hoylandt, Ron Peeters, and Evy Cleeren for technical assistance and Astrid Hermans and Sara De Pril for administrative support.
The authors declare no competing conflicts of interest.
References
- Afraz A, Boyden ES, DiCarlo JJ (2015) Optogenetic and pharmacological suppression of spatial clusters of face neurons reveal their causal role in face gender discrimination. Proc Natl Acad Sci U S A 112:6730–6735. 10.1073/pnas.1423328112 [DOI] [PMC free article] [PubMed] [Google Scholar]
- Afraz SR, Kiani R, Esteky H (2006) Microstimulation of inferotemporal cortex influences face categorization. Nature 442:692–695. 10.1038/nature04982 [DOI] [PubMed] [Google Scholar]
- Allison T, Puce A, Spencer DD, McCarthy G (1999) Electrophysiological studies of human face perception. I: potentials generated in occipitotemporal cortex by face and non-face stimuli. Cereb Cortex 9:415–430. 10.1093/cercor/9.5.415 [DOI] [PubMed] [Google Scholar]
- Aparicio PL, Issa EB, DiCarlo JJ (2016) Neurophysiological organization of the middle face patch in macaque inferior temporal cortex. J Neurosci 36:12729–12745. 10.1523/JNEUROSCI.0237-16.2016 [DOI] [PMC free article] [PubMed] [Google Scholar]
- Axelrod V, Rozier C, Malkinson TS, Lehongre K, Adam C, Lambrecq V, Navarro V, Naccache L (2019) Face-selective neurons in the vicinity of the human fusiform face area. Neurology 92:197–198. 10.1212/WNL.0000000000006806 [DOI] [PubMed] [Google Scholar]
- Bell AH, Malecek NJ, Morin EL, Hadj-Bouziane F, Tootell RB, Ungerleider LG (2011) Relationship between functional magnetic resonance imaging-identified regions and neuronal category selectivity. J Neurosci 31:12229–12240. 10.1523/JNEUROSCI.5865-10.2011 [DOI] [PMC free article] [PubMed] [Google Scholar]
- Bona S, Cattaneo Z, Silvanto J (2015) The causal role of the occipital face area (OFA) and lateral occipital (LO) cortex in symmetry perception. J Neurosci 35:731–738. 10.1523/JNEUROSCI.3733-14.2015 [DOI] [PMC free article] [PubMed] [Google Scholar]
- Chang L, Tsao DY (2017) The code for facial identity in the primate brain. Cell 169:1013–1028.e14. 10.1016/j.cell.2017.05.011 [DOI] [PMC free article] [PubMed] [Google Scholar]
- Davidesco I, Zion-Golumbic E, Bickel S, Harel M, Groppe DM, Keller CJ, Schevon CA, McKhann GM, Goodman RR, Goelman G, Schroeder CE, Mehta AD, Malach R (2014) Exemplar selectivity reflects perceptual similarities in the human fusiform cortex. Cereb Cortex 24:1879–1893. 10.1093/cercor/bht038 [DOI] [PMC free article] [PubMed] [Google Scholar]
- Decramer T, Premereur E, Uytterhoeven M, Van Paesschen W, van Loon J, Janssen P, Theys T (2019) Single-cell selectivity and functional architecture of human lateral occipital complex. PLoS Biol 17:e3000280. 10.1371/journal.pbio.3000280 [DOI] [PMC free article] [PubMed] [Google Scholar]
- Fried I, MacDonald KA, Wilson CL (1997) Single neuron activity in human hippocampus and amygdala during recognition of faces and objects. Neuron 18:753–765. 10.1016/s0896-6273(00)80315-3 [DOI] [PubMed] [Google Scholar]
- Gauthier I, Skudlarski P, Gore JC, Anderson AW (2000) Expertise for cars and birds recruits brain areas involved in face recognition. Nat Neurosci 3:191–197. 10.1038/72140 [DOI] [PubMed] [Google Scholar]
- Goesaert E, Op de Beeck HP (2013) Representations of facial identity information in the ventral visual stream investigated with multivoxel pattern analyses. J Neurosci 33:8549–8558. 10.1523/JNEUROSCI.1829-12.2013 [DOI] [PMC free article] [PubMed] [Google Scholar]
- Grill-Spector K, Knouf N, Kanwisher N (2004) The fusiform face area subserves face perception, not generic within-category identification. Nat Neurosci 7:555–562. 10.1038/nn1224 [DOI] [PubMed] [Google Scholar]
- Grill-Spector K, Weiner KS, Kay K, Gomez J (2017) The functional neuroanatomy of human face perception. Annu Rev Vis Sci 3:167–196. 10.1146/annurev-vision-102016-061214 [DOI] [PMC free article] [PubMed] [Google Scholar]
- Hemond CC, Kanwisher NG, Op de Beeck HP (2007) A preference for contralateral stimuli in human object- and face-selective cortex. PloS One 2:e574. 10.1371/journal.pone.0000574 [DOI] [PMC free article] [PubMed] [Google Scholar]
- Henriksson L, Mur M, Kriegeskorte N (2015) Faciotopy-A face-feature map with face-like topology in the human occipital face area. Cortex 72:156–167. 10.1016/j.cortex.2015.06.030 [DOI] [PMC free article] [PubMed] [Google Scholar]
- Hesse JK, Tsao DY (2020) The macaque face patch system: a turtle's underbelly for the brain. Nat Rev Neurosci 21:695–716. 10.1038/s41583-020-00393-w [DOI] [PubMed] [Google Scholar]
- Jacques C, Witthoft N, Weiner KS, Foster BL, Rangarajan V, Hermes D, Miller KJ, Parvizi J, Grill-Spector K (2016) Corresponding ECoG and fMRI category-selective signals in human ventral temporal cortex. Neuropsychologia 83:14–28. 10.1016/j.neuropsychologia.2015.07.024 [DOI] [PMC free article] [PubMed] [Google Scholar]
- Jonas J, Descoins M, Koessler L, Colnat-Coulbois S, Sauvée M, Guye M, Vignal JP, Vespignani H, Rossion B, Maillard L (2012) Focal electrical intracerebral stimulation of a face-sensitive area causes transient prosopagnosia. Neuroscience 222:281–288. 10.1016/j.neuroscience.2012.07.021 [DOI] [PubMed] [Google Scholar]
- Jonas J, Jacques C, Liu-Shuang J, Brissart H, Colnat-Coulbois S, Maillard L, Rossion B (2016) A face-selective ventral occipito-temporal map of the human brain with intracerebral potentials. Proc Natl Acad Sci U S A 113:E4088–E4097. 10.1073/pnas.1522033113 [DOI] [PMC free article] [PubMed] [Google Scholar]
- Kanwisher N, McDermott J, Chun MM (1997) The fusiform face area: a module in human extrastriate cortex specialized for face perception. J Neurosci 17:4302–4311. 10.1523/JNEUROSCI.17-11-04302.1997 [DOI] [PMC free article] [PubMed] [Google Scholar]
- Khuvis SY, Yeagle EM, Norman Y, Grossman S, Malach R, Mehta AD (2021) Face-selective units in human ventral temporal cortex reactivate during free recall. J Neurosci 41:3386–3399. [DOI] [PMC free article] [PubMed] [Google Scholar]
- Kreiman G, Koch C, Fried I (2000) Imagery neurons in the human brain. Nature 408:357–361. 10.1038/35042575 [DOI] [PubMed] [Google Scholar]
- Liu H, Agam Y, Madsen JR, Kreiman G (2009) Timing, timing, timing: fast decoding of object information from intracranial field potentials in human visual cortex. Neuron 62:281–290. 10.1016/j.neuron.2009.02.025 [DOI] [PMC free article] [PubMed] [Google Scholar]
- Liu J, Li J, Feng L, Li L, Tian J, Lee K (2014) Seeing Jesus in toast: neural and behavioral correlates of face pareidolia. Cortex 53:60–77. 10.1016/j.cortex.2014.01.013 [DOI] [PMC free article] [PubMed] [Google Scholar]
- McCarthy G, Puce A, Gore JC, Allison T (1997) Face-specific processing in the human fusiform gyrus. J Cogn Neurosci 9:605–610. 10.1162/jocn.1997.9.5.605 [DOI] [PubMed] [Google Scholar]
- McCarthy G, Puce A, Belger A, Allison T (1999) Electrophysiological studies of human face perception. II: response properties of face-specific potentials generated in occipitotemporal cortex. Cereb Cortex 9:431–444. 10.1093/cercor/9.5.431 [DOI] [PubMed] [Google Scholar]
- Nihei Y, Minami T, Nakauchi S (2018) Brain activity related to the judgment of face-likeness: correlation between eeg and face-like evaluation. Front Hum Neurosci 12:56. 10.3389/fnhum.2018.00056 [DOI] [PMC free article] [PubMed] [Google Scholar]
- Parvizi J, Jacques C, Foster BL, Witthoft N, Withoft N, Rangarajan V, Weiner KS, Grill-Spector K (2012) Electrical stimulation of human fusiform face-selective regions distorts face perception. J Neurosci 32:14915–14920. 10.1523/JNEUROSCI.2609-12.2012 [DOI] [PMC free article] [PubMed] [Google Scholar]
- Pitcher D, Walsh V, Yovel G, Duchaine B (2007) TMS evidence for the involvement of the right occipital face area in early face processing. Curr Biol 17:1568–1573. 10.1016/j.cub.2007.07.063 [DOI] [PubMed] [Google Scholar]
- Pitcher D, Charles L, Devlin JT, Walsh V, Duchaine B (2009) Triple dissociation of faces, bodies, and objects in extrastriate cortex. Curr Biol 19:319–324. 10.1016/j.cub.2009.01.007 [DOI] [PubMed] [Google Scholar]
- Pitcher D, Walsh V, Duchaine B (2011) The role of the occipital face area in the cortical face perception network. Exp Brain Res 209:481–493. 10.1007/s00221-011-2579-1 [DOI] [PubMed] [Google Scholar]
- Ponce CX, Xiao W, Schade P, Hartmann T, Kreiman G, Livingstone M (2019) Evolving super stimuli for real neurons using deep generative networks. bioRxiv. Advance online publication. Retrieved September 21, 2021 10.1101/516484. [DOI] [PMC free article] [PubMed] [Google Scholar]
- Popivanov ID, Jastorff J, Vanduffel W, Vogels R (2014) Heterogeneous single-unit selectivity in an fMRI-defined body-selective patch. J Neurosci 34:95–111. 10.1523/JNEUROSCI.2748-13.2014 [DOI] [PMC free article] [PubMed] [Google Scholar]
- Puce A, Allison T, McCarthy G (1999) Electrophysiological studies of human face perception. III: effects of top-down processing on face-specific potentials. Cereb Cortex 9:445–458. 10.1093/cercor/9.5.445 [DOI] [PubMed] [Google Scholar]
- Quian Quiroga R, Kraskov A, Koch C, Fried I (2009) Explicit encoding of multimodal percepts by single neurons in the human brain. Curr Biol 19:1308–1313. 10.1016/j.cub.2009.06.060 [DOI] [PMC free article] [PubMed] [Google Scholar]
- Quiroga RQ, Reddy L, Kreiman G, Koch C, Fried I (2005) Invariant visual representation by single neurons in the human brain. Nature 435:1102–1107. 10.1038/nature03687 [DOI] [PubMed] [Google Scholar]
- Rainer G, Asaad WF, Miller EK (1998) Selective representation of relevant information by neurons in the primate prefrontal cortex. Nature 393:577–579. 10.1038/31235 [DOI] [PubMed] [Google Scholar]
- Riley JD, Fling BW, Cramer SC, Lin JJ (2015) Altered organization of face-processing networks in temporal lobe epilepsy. Epilepsia 56:762–771. 10.1111/epi.12976 [DOI] [PMC free article] [PubMed] [Google Scholar]
- Rossion B, Taubert J (2019) What can we learn about human individual face recognition from experimental studies in monkeys? Vision Res 157:142–158. 10.1016/j.visres.2018.03.012 [DOI] [PubMed] [Google Scholar]
- Sato W, Kochiyama T, Uono S, Matsuda K, Usui K, Inoue Y, Toichi M (2014) Rapid, high-frequency, and theta-coupled gamma oscillations in the inferior occipital gyrus during face processing. Cortex 60:52–68. 10.1016/j.cortex.2014.02.024 [DOI] [PubMed] [Google Scholar]
- Schobert AK, Corradi-Dell'Acqua C, Frühholz S, van der Zwaag W, Vuilleumier P (2018) Functional organization of face processing in the human superior temporal sulcus: a 7T high-resolution fMRI study. Soc Cogn Affect Neurosci 13:102–113. 10.1093/scan/nsx119 [DOI] [PMC free article] [PubMed] [Google Scholar]
- Smith EH, Liou JY, Davis TS, Merricks EM, Kellis SS, Weiss SA, Greger B, House PA, McKhann GM 2nd, Goodman RR, Emerson RG, Bateman LM, Trevelyan AJ, Schevon CA (2016) The ictal wavefront is the spatiotemporal source of discharges during spontaneous human seizures. Nat Commun 7:11098. 10.1038/ncomms11098 [DOI] [PMC free article] [PubMed] [Google Scholar]
- Taubert J, Wardle SG, Flessert M, Leopold DA, Ungerleider LG (2017) Face pareidolia in the rhesus monkey. Curr Biol 27:2505–2509.e2. 10.1016/j.cub.2017.06.075 [DOI] [PMC free article] [PubMed] [Google Scholar]
- Truccolo W, Donoghue JA, Hochberg LR, Eskandar EN, Madsen JR, Anderson WS, Brown EN, Halgren E, Cash SS (2011) Single-neuron dynamics in human focal epilepsy. Nat Neurosci 14:635–641. 10.1038/nn.2782 [DOI] [PMC free article] [PubMed] [Google Scholar]
- Tsantani M, Kriegeskorte N, Storrs K, Williams AL, McGettigan C, Garrido L (2021) FFA and OFA encode distinct types of face identity information. J Neurosci 41:1952–1969. [DOI] [PMC free article] [PubMed] [Google Scholar]
- Tsao DY, Freiwald WA, Tootell RB, Livingstone MS (2006) A cortical region consisting entirely of face-selective cells. Science 311:670–674. 10.1126/science.1119983 [DOI] [PMC free article] [PubMed] [Google Scholar]
- Tsao DY, Livingstone MS (2008) Mechanisms of face perception. Annu Rev Neurosci 31:411–437. 10.1146/annurev.neuro.30.051606.094238 [DOI] [PMC free article] [PubMed] [Google Scholar]
- Tsao DY, Moeller S, Freiwald WA (2008) Comparing face patch systems in macaques and humans. Proc Natl Acad Sci U S A 105:19514–19519. 10.1073/pnas.0809662105 [DOI] [PMC free article] [PubMed] [Google Scholar]
- Wardle SG, Seymour K, Taubert J (2017) Characterizing the response to face pareidolia in human category-selective visual cortex. bioRxiv. Advance online publication. Retrieved September 21, 2021. 10.1101/233387 [DOI] [Google Scholar]
- Wardle SG, Taubert J, Teichmann L, Baker CI (2020) Rapid and dynamic processing of face pareidolia in the human brain. Nat Commun 11:4518. 10.1038/s41467-020-18325-8 [DOI] [PMC free article] [PubMed] [Google Scholar]
Associated Data
This section collects any data citations, data availability statements, or supplementary materials included in this article.
Supplementary Materials
Online demonstration of face cell. The patient looks into a mirror or looks away. In the background you can see and hear the brisk response of this cell when she sees her own face. When she closes her eyes, there is no spiking activity.