

Abstract
ECOD is a database of evolutionary domains from structures deposited in the PDB. Domains in ECOD are classified by a mixed manual/automatic method wherein the bulk of newly deposited structures are classified automatically by protein-protein BLAST. Those structures that cannot be classified automatically are referred to manual curators who use a combination of alignment results, functional analysis, and close reading of the literature to generate novel assignments. ECOD differs from other structural domain resources in that it is continually updated, classifying thousands of proteins per week. ECOD recognizes homology as its key organizing concept, rather than structural or sequence similarity alone. Such a classification scheme provides functional information about proteins of interest by placing them in the correct evolutionary context among all proteins of known structure. This unit demonstrates how to access ECOD via the Web and how to search the database by sequence or structure. It also details the distributable data files available for large-scale bioinformatics users.
Keywords: protein domain, domain classification, sequence search, structure search
INTRODUCTION
Advances in genome sequencing, along with techniques such as cryo-electron microscopy, have dramatically increased the amount of available protein sequence and structure data(Bai, McMullan, & Scheres; Stephens et al.). Confronted with such an increase in available information, the most efficient method by which to grapple with existing protein sequence and structure data is to identify evolutionarily related or homologous domains within a protein of interest. By identifying such domains, novel proteins are connected with potential existing experimental and functional data. Use of a structure domain database, rather than a database of protein sequences, increases the chances that relevant information will be found, as search methods can access more distant relationships.
ECOD (Evolutionary Classification Of protein Domains) is a database of evolutionary domains (H. Cheng et al.). Protein domains can be defined by a multitude of criteria: sequence similarity, structural similarity, function, or structural compactness. Domains are conceived of as a single functional unit, such that selective pressure can work to prevent deleterious mutations within a structure that would destabilize a protein or cause a loss of function(Vogel, Bashton, Kerrison, Chothia, & Teichmann). However, it is known that proteins can evolve either by mutation of existing structures or by combination of proteins by fusion or insertion, which leads to multidomain proteins(Todd, Orengo, & Thornton). These alterations can lead to difficult to classify cases, such as domain insertion, resulting in a discontinuous domain surrounding the insertion, or close homologs with differing topology. ECOD’s hierarchy clearly models both close homologs with differing topologies (such as beta-propellers or RIFT barrels), as well as distant homologs with some structural similarity. We also account for the presence of domain insertion, and the discontinuous domains that can result from this evolutionary event.
There are five different hierarchal levels in ECOD. The architecture level groups domains broadly by secondary structure content and arrangement. The “special” architectures also contain those protein regions that are not domains or cannot be classified as domains (e.g. peptides, fragments, unclassifiable or incomplete structures). The X-group (or probable homology level) groups together those domains where some indefinite evidence of homology exists (usually weak structural or functional similarity). Within X-groups, homologous groups (or H-groups) cluster together those domains of definite homology. Domains within an H-group may perform similar reactions on differing substrates(Todd et al.) Some H-groups are divided into multiple topology groups (or T-groups) which divide groups of differing topology but definite homology. Finally, family groups (or F-groups) are classified by close(comparatively) sequence similarity. See Table 1 for an elaboration of how ECOD considers “close” and “distant” evolutionary relationships. F-groups are loosely based on the Pfam protein family database with some modifications and extensions to support our differing domain boundaries. It is likely that domains within the same F-group have the same function. In many cases, domains within the same F-group share a function. The X, H, T, and F groups each have a numerical identifier that is stable across ECOD versions (e.g. 101.1.1 represents the tri-helical HTH T-group).
Table 1 -.
List of ECOD hierarchical groups and their relationship to other popular domain databases
| Description | |
|---|---|
| Architecture | Groups domains by structural content. Simliar to SCOP Class or a combination of CATH Class and Architecture. Little evolutionary relationship implied |
| X-group | Potential evolutionary relationship. Closest types are SCOP Fold or Cath Topology Group. Evolutionary relationship is putative. |
| H-group | Definite homologous relationship. Similar to CATH Homologous Group, SCOP superfamily, or Pfam Clan. |
| T-group | Topological group. Similar in some respects to SCOP Fold or CATH Topological Group. |
| F-group | Homologous relationship that may imply functional similarity. “Close” relationship, but may be distant in terms of sequence identity. |
This unit demonstrates methods for querying ECOD and the types of expected results. Two basic protocols are presented: Two for searching with a single sequence of interest (Basic Protocol 1) and another for searching with a single structure of interest (Basic Protocol 2). We also provide a short description of the types of distributable files that are available for users seeking to do large scale computations.
BASIC PROTOCOL 1
Searching ECOD by sequence
One method to search for data related to a protein of interest is to search a protein domain classification for relationships to known domains. As similarity increases between a region in the query protein and known domains, so increases confidence that the region identified has shared ancestry or function. Within ECOD, links to other databases are provided for access to data in other resources regarding hit domains of interest.
Necessary Resources
Hardware
Workstation with Internet access
Software
Javascript-capable Internet browser (Chrome, Firefox, IE9+, Opera, Safari)
Files
Protein sequence in FASTA format (protein sequences are freely available from the NCBI at https://www.ncbi.nlm.nih.gov/protein).
Protocol steps—Step annotations
- Navigate your web browser to the ECOD home page at http://prodata.swmed.edu/ecod (Figure 1).
- The ECOD webpage provides quick links to search, downloadable files, and an online browseable version of the hierarchy. Pre-generated structure and sequence libraries are available for users wishing to search by alternative methods or in large batches. Brief summary statistics are presented showing the number of PDBs and domains classified by the current version of ECOD. ECOD is updated on a weekly to biweekly basis based on the latest version of the PDB. It is our plan to extend ECOD beyond classification of the PDB in the future.
- Select “Search by sequence” from the central menu (Figure 2). Copy and paste your full FASTA format sequence into the query sequence dialog box, then click “Submit.” The ECOD server will conduct a BLAST search against the full ECOD domain database using the query sequence.
- BLAST is a powerful algorithm for finding matches quickly to proteins of interest relatively similar to known domains. Users seeking more sensitive sequence similarity detection methods should attempt profile-profile matching methods (e.g. HHsearch). ECOD is available as a search database in the HHpred server (the web implementation of the HHsearch method).
- Following submission, the job will be forwarded to the ECOD server and the user will be moved to a holding page that will refresh on automatic interval.Typical searches take anywhere from thirty seconds to several minutes. Search time will vary based on the length of the sequence and the average load on the server from other users and processes.
- If hits with significant BLAST E-values (< 0.01) are found for the query sequence, the results page will be shown with the ECOD domain hits ordered by E-value. The results page is subdivided into three sections as described below (Figure 3).
- Schematic overview: All ECOD domain hits are shown in a schematic overview that shows which regions of the query protein share similarity. The query protein is represented as a large grey bar at the top, and hit domains follow below and are colored by BLAST bit score. Clicking on an individual result will navigate the user to the specific BLAST alignment results in section (c) below.
- Hit domain descriptions: Individual domain results are shown following the schematic overview with their ECOD hierarchal information and BLAST score summary. The full names of the X, H, T, and F-groups for each ECOD hit domain are shown. Additionally, the BLAST Bit score, E-value, query coverage, and alignment identity are shown. Finally, clicking on the ECOD domain id for any hit will navigate to that domain’s description page.
- BLAST alignments: The BLAST alignments for individual hits along with their statistics and links to their domain description pages are presented in the final section of results.
Figure 1. ECOD homepage.

The homepage provides links for browsing distributable files or the tree view of ECOD (top) or searching by various methods (e.g. keyword, PDB id, sequence, structure).
Figure 2. Searching ECOD by sequence using BLAST.

Search the current version of ECOD using BLAST sequence search by copy and pasting your FASTA-format protein sequence directly into the dialog box and clicking “Submit…”.
Figure 3. ECOD Sequence Results Page.

ECOD tripartite sequence results are divided into a schematic overview, domain description, and alignment details section.
ALTERNATE PROTOCOL 1
Searching ECOD locally using BLAST
Investigators may prefer to search ECOD using local computing resources to perform high-volume queries to generate local results for further processing or due to sporadic Internet connectivity. Sequence databases at 99%, 70%, and 40% reduced redundancy are provided via the ECOD webpage. The sequence queries generated by the ECOD webpage are easily replicated using publically available tools and data.
Necessary Resources
Hardware
Linux workstation with read/write privileges
Software
Files
ECOD F99 domain sequences file (http://prodata.swmed.edu/ecod/distributions/ecod.latest.F99.fasta.txt)
ECOD domain description file (http://prodata.swmed.edu/ecod/distributions/ecod.latest.domains.txt)
Protocol steps—Step annotations
Download ECOD distributable files and place into a local directory.
- Generate BLAST databases from ECOD FASTA library. The makeblastdb executable from the BLAST distribution will convert a FASTA library in a BLAST-compatible search library.
- makeblastdb –in ecod.latest.F99.fasta.txt –out ecod.F99 -title ecod.F99
- Perform a local BLAST search.
- blastp –query q_protein.fa –db ecod.F99 –evalue 0.01
- Identify well-scoring hits from BLAST results and cross-reference in domain description file.
- What constitutes a “well-scoring” hit is the most difficult question regarding bioinformatics searches and their interpretation. Generally, start from the lowest E-value and work towards increasing values. Focus on investigating hits from unique ECOD levels (especially H-groups). Truncating queries to remove either well-known regions or regions problematic to sequence search (low complexity regions, some coiled-coils) can generate more clarity in results.
BASIC PROTOCOL 2
Searching ECOD by structure
Searching the ECOD database by structure can provide more instructive results by both detecting more distant potential relationships or by identifying structural differences among many close homologs. The ECOD web server implements a TM-align based search for users to search our manually curated representative structures with a structure of interest. Structure searches are naturally more computationally expensive than sequence searches, so more time is required for completion.
Necessary Resources
Hardware
Workstation with Internet access
Software
Javascript-capable Internet browser (Chrome, Firefox, IE9+, Opera Safari)
Files
Protein structure in PDB format (Protein structures are freely available from the RCSB at http://www.rcsb.org).
Protocol steps—Step annotations
Navigate your browser to the ECOD homepage (http://prodata.swmed.edu/ecod).
Select “Search by structure” from the central menu (Fig 4). You may either copy and paste the text of your PDB structure directly into the dialog box, or select a PDB file from your local directory by clicking “Choose file…”. Only a single PDB chain can be used as a query, if your file has multiple chains, please specify the chain of interest using the “Chain ID” dialog.
- Click “Submit” to begin a TM-align structure search (Zhang & Skolnick).Structure search can take many hours, if you enter a title and email address into the respective dialog boxes, you will be notified when your search is complete.
If you remained on the page after submission, you will be automatically directed to the results page. If you navigated away or closed the window, you may use the link emailed to you by the server to return to the web page.
- If hits with a significant TM-align Z-score are found (> 0.2), then results are displayed in order of descending Z-score (Fig 5). The results page is broken down in the same fashion as the sequence results.
- Schematic overview. The query protein is represented by the top bar. Subsequent hits to this query, colored by Z-score, are shown schematically by the aligned region to the query. Clicking on any one of these hit schematics will navigate the user to the alignment details.
- Hit domain descriptions. Individual hit domains with their ECOD hierarchical designations and TM-score statistics are presented. Clicking the hit number will navigate the user to the alignment details. The TM score (Z-score), RMSD of the structural superposition, the coverage of the alignment over the query protein and the hit domain, as well as a link to the ECOD domain description page of the hit domain are presented.
- Alignment details. Specific positions in the alignment between the query and hit domains, along with alignment statistics are presented. Links to the hit domain description page, as well as ECOD H-group name, and the name of the protein containing the hit domains precede the TMalign statistics. In addition to the alignment statistics, links to an online JSMol viewer of the hit domain and a downloadable PyMol session containing the superposition between the query protein and hit domain are available.
Figure 4. Searching ECOD by structure using TM-align.
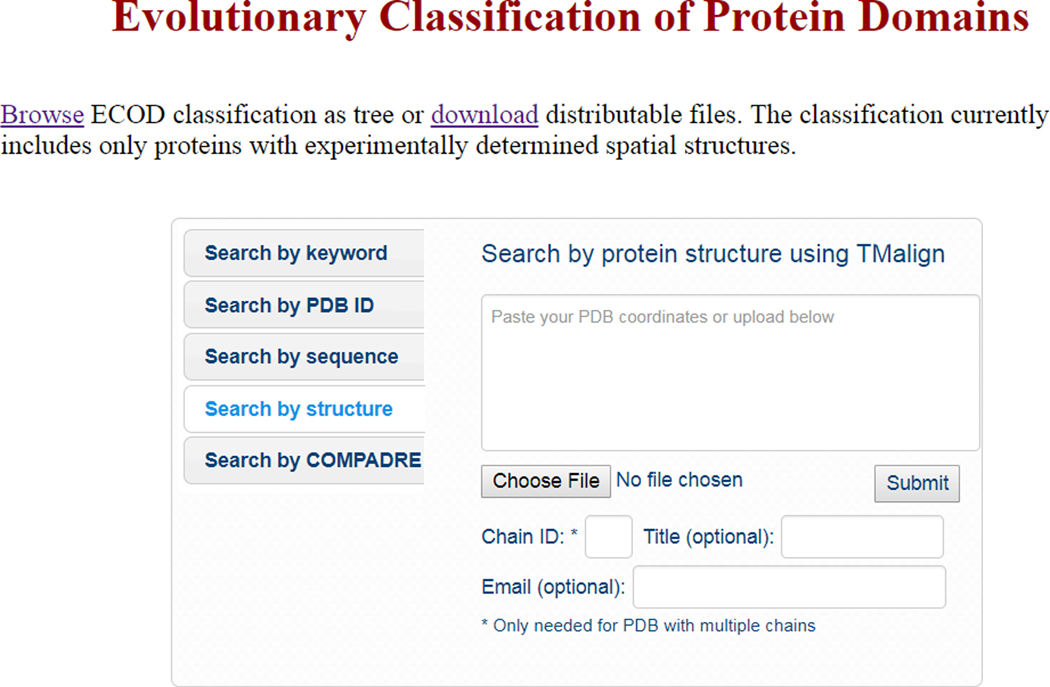
Search the current set of ECOD manual representatives using TMalign. A PDB-format structure may either be copy and pasted into the dialog box, or a structure can be uploaded from your local system. Only a single chain be searched at a time.
Figure 5. ECOD Structure Results Page.

ECOD structure results are divided into a schematic overview, a domain description, and an alignment details section
GUIDELINES FOR UNDERSTANDING RESULTS
The primary reason for searching ECOD with a sequence or structure is to determine whether the query or a close homolog has already been classified in whole or in part. If a query does not return any results, it may mean that a more distant homolog that cannot be detected with BLAST or TM-align has been classified, or it may mean that no homolog of the query has yet been structurally determined. Here we discuss how to navigate ECOD in the case that some hit domain with confident similarity has been identified.
ECOD Domain Summary Page
The ECOD domain summary page consists of four main components (Figure 6). The summary page is titled with the 6+ character ECOD domain identifier. Directly below are the five ECOD hierarchal levels into which the domain has been classified. In each case, clicking the magnifying glass icon next to the name of domain identifier or hierarchal level will navigate you to the position of that level in the ECOD tree view (discussed subsequently). Directly to the right of the hierarchal levels, the “Download files” dialog is available for the user to download FASTA format sequence files, PDB format structure files, or a pre-generated PyMol structure viewer session for the domain. The PyMol session can be generated containing the domain, the domain in the context of its PDB chain, or the domain in the context of the entire PDB deposition. Images for the domain in these contexts are provided directly adjacent to the download dialog. Below the hierarchal levels of a domain, several domain characteristics are presented. ECOD domains have both a 6–10 character ECOD domain identifier, composed of the PDB identifier, the PDB chain identifier, and a domain number. Because ECOD domains are subject to possible reclassification over time, the domain identifier is not guaranteed to be stable between versions. However, the unique identifier (i.e. UID) is unique across all ECOD versions and guaranteed to be stable. ECOD consists of manually curated and automatically assigned domains. The “Type” entry displays whether a protein is a manually curated or automatically assigned domain. Automatic domains will have a link to the manually curated domain with which they are associated in the “Parent” entry. ECOD requires that an automatic domain and its parent share hierarchical classification. If a domain was assigned by distant homology to a domain in another F-group, and nucleates the classification of a new F-group, that domain will be designated as a provisional manual representative. Non-peptide ligands within 4 Å of the domain are displayed in images and listed in the “Ligand” entry. Finally, links to the PDB deposition and the title of the PDB chain are displayed. A JSmol structure viewer is placed in the “Structure View” tab. Different display modes are supported and display of ligands can be toggled. The “Domain Organization” tab provides brief descriptions of and links to domains sharing the same PDB structure and chain.
Figure 6. ECOD Domain Summary Page.

The ECOD domain summary page provides vital statistics, access to PDB and PyMOL structure representations, and links to other domains in the related PDB deposition. Information about the type of ECOD domain and links to its hierarchical classification are also provided.
ECOD Hierarchical Tree View
ECOD can be viewed as a tree with hierarchal levels (Fig 7). Each node at each level can be expanded or collapsed as necessary. Manual representative domains are automatically displayed beneath F-groups. Manual representatives have been checked by a curator and are thus our most confident classifications. All automatically assigned domains are associated with a manual representative, these domains can be viewed by clicking on the “nonrep” link. Sometimes provisional manual representatives are created from an automatic domain if no manual representative was available within an F-group. Classifications that are anchored on a provisional domain are less confident. These provisional domains are indicated by an asterisk. Links to the domain in the domain context in both PyMol session, png file, and webpage JSmol viewer are provided. Links to the PDB deposition as well as the SCOP and CATH domain classifications are also provided. Where available, PubMed and DOI links are provided for the primary citation in the PDB deposition. For non-singleton T-groups, a tree of component F-groups can be viewed by clicking the small tree icon on the F-group. These trees are generated using neighbor-joining on a distance matrix based on HHalign scores between F-group representatives. Using the ECOD tree view, a user can generate perspective on the known structure space near a hit domain of interest.
Figure 7. ECOD Hierarchical Tree View.

The ECOD tree view shows the domain classification levels and its component domains. Links to the original PDB deposition, primary citation, and other domain classifications are provided.
COMMENTARY
Background Information
ECOD is similar in some forms and concepts to other domain classifications that it followed. The pilot version of ECOD was initially based on SCOP v1.75 and a rearrangement of its hierarchy and domain boundaries (Andreeva et al.). CATH, another domain classification, has a stronger emphasis on structural similarity (Orengo et al., 1997). Both of these databases have similar search methods and are useful to generate directly comparative results to an ECOD search. The F-group level is based primarily on a modified version of PFam, a sequence family database (Finn et al.). Modifications occur primarily due to differences in domain boundaries in ECOD and Pfam. The ECOD database and its methods have been described in greater detail elsewhere (H. Cheng et al.), but we mention some key concepts here. Following the establishment of ECOD, a weekly pipeline was developed wherein the majority of protein chains released in the PDB are classified automatically, and those that fail certain checks are passed to manual curators for assignment. The automatic pipeline relies on a combination of sequence and profile based aligners (BLAST, HHSearch) to generate automatic hits (Altschul et al.; Soding). Proteins and regions of proteins that cannot be classified are assigned to “special” architectures in order to signify to users that they were considered and rejected for classification at this time.
Suggestions for Further Analysis
Identification of potentially homologous hit domains is only an initial step to seeking out existing data for a protein of interest. If good hits are found, developing information about the hit can be done by searching for functional data in linked databases such as PFam (Finn et al.). If close homologs are not found, searches could be moved to more sensitive sequence profile techniques such as HHsearch or CDD (Marchler-Bauer et al.; Soding). It is also useful to consider alternative domain classifications, links to SCOP and CATH are provided within ECOD, but it can be productive to generate searches using the utilities at these resources (Murzin, Brenner, Hubbard, & Chothia; Orengo et al.). The Gene Ontology (GO) database provides extensive annotation of gene products and their functions (Cheng, Lin, Hu, Wang, & Yang). Once homologous domains or proteins are identified, searches of the GO database can reveal additional functional information. The Evolutionary Trace (ET) server, can reveal residues under selective pressure in a protein family and thus can reveal functionally important residues in a protein structure(Lichtarge, Bourne, & Cohen).
Significance Statement.
Protein domains are core units of biological function and evolution. Identification and classification of these units provides a resource for scientists to generate novel insights for proteins of interest. ECOD provides an up-to-date protein structure domain classification. Organized by evolutionary relationships, rather than solely by sequence or structure similarity, ECOD illustrates novel relationships between domains not observed in other domain resources. Through observation of these relationships, we can infer functional and structural information to unknown proteins whose structures have not yet been determined.
ACKNOWLEDGEMENT
This work was supported in part by the National Institutes of Health (GM094575 to NVG) and the Welch Foundation (I-1505 to NVG). We thank Dr. Lisa Kinch for critical reading of the manuscript.
LITERATURE CITED
- Altschul SF, Madden TL, Schaffer AA, Zhang J, Zhang Z, Miller W, & Lipman DJ (1997). Gapped BLAST and PSI-BLAST: a new generation of protein database search programs. Nucleic Acids Res, 25(17), 3389–3402. [DOI] [PMC free article] [PubMed] [Google Scholar]
- Andreeva A, Howorth D, Chandonia JM, Brenner SE, Hubbard TJ, Chothia C, & Murzin AG (2008). Data growth and its impact on the SCOP database: new developments. Nucleic Acids Res, 36(Database issue), D419–425. [DOI] [PMC free article] [PubMed] [Google Scholar]
- Bai X. c., McMullan G, & Scheres SHW (2015). How cryo-EM is revolutionizing structural biology. Trends in Biochemical Sciences, 40(1), 49–57. doi: 10.1016/j.tibs.2014.10.005 [DOI] [PubMed] [Google Scholar]
- Cheng H, Schaeffer RD, Liao Y, Kinch LN, Pei J, Shi S, . . . Grishin, N. V. (2014). ECOD: an evolutionary classification of protein domains. PLoS Comput Biol, 10(12), e1003926. doi: 10.1371/journal.pcbi.1003926 [DOI] [PMC free article] [PubMed] [Google Scholar]
- Cheng L, Lin H, Hu Y, Wang J, & Yang Z. (2014). Gene Function Prediction Based on the Gene Ontology Hierarchical Structure. PLoS One, 9(9), e107187. doi: 10.1371/journal.pone.0107187 [DOI] [PMC free article] [PubMed] [Google Scholar]
- Finn RD, Mistry J, Schuster-Bockler B, Griffiths-Jones S, Hollich V, Lassmann T, . . . Bateman A. (2006). Pfam: clans, web tools and services. Nucleic Acids Res, 34(Database issue), D247–251. doi: 10.1093/nar/gkj149 [DOI] [PMC free article] [PubMed] [Google Scholar]
- Lichtarge O, Bourne HR, & Cohen FE (1996). An Evolutionary Trace Method Defines Binding Surfaces Common to Protein Families. Journal of Molecular Biology, 257(2), 342–358. doi: 10.1006/jmbi.1996.0167 [DOI] [PubMed] [Google Scholar]
- Marchler-Bauer A, Lu S, Anderson JB, Chitsaz F, Derbyshire MK, DeWeese-Scott C, . . . Bryant SH (2011). CDD: a Conserved Domain Database for the functional annotation of proteins. Nucleic Acids Res, 39(Database issue), D225–229. doi: 10.1093/nar/gkq1189 [DOI] [PMC free article] [PubMed] [Google Scholar]
- Murzin AG, Brenner SE, Hubbard T, & Chothia C. (1995). SCOP: a structural classification of proteins database for the investigation of sequences and structures. J Mol Biol, 247(4), 536–540. doi: 10.1006/jmbi.1995.0159 [DOI] [PubMed] [Google Scholar]
- Orengo CA, Michie AD, Jones S, Jones DT, Swindells MB, & Thornton JM (1997). CATH--a hierarchic classification of protein domain structures. Structure, 5(8), 1093–1108. [DOI] [PubMed] [Google Scholar]
- Soding J. (2005). Protein homology detection by HMM-HMM comparison. Bioinformatics, 21(7), 951–960. doi: 10.1093/bioinformatics/bti125 [DOI] [PubMed] [Google Scholar]
- Stephens ZD, Lee SY, Faghri F, Campbell RH, Zhai C, Efron MJ, . . . Robinson GE (2015). Big Data: Astronomical or Genomical? PLOS Biology, 13(7), e1002195. doi: 10.1371/journal.pbio.1002195 [DOI] [PMC free article] [PubMed] [Google Scholar]
- Todd AE, Orengo CA, & Thornton JM (2001). Evolution of function in protein superfamilies, from a structural perspective11Edited by A. R. Fersht. Journal of Molecular Biology, 307(4), 1113–1143. doi: 10.1006/jmbi.2001.4513 [DOI] [PubMed] [Google Scholar]
- Vogel C, Bashton M, Kerrison ND, Chothia C, & Teichmann SA (2004). Structure, function and evolution of multidomain proteins. Current Opinion in Structural Biology, 14(2), 208–216. doi: 10.1016/j.sbi.2004.03.011 [DOI] [PubMed] [Google Scholar]
- Zhang Y, & Skolnick J. (2005). TM-align: a protein structure alignment algorithm based on the TM-score. Nucleic Acids Res, 33(7), 2302–2309. [DOI] [PMC free article] [PubMed] [Google Scholar]