Abstract
The study of complex systems has emerged as an important field with many discoveries still to be made. Computer simulation and visualization provide important tools for studying complex dynamics including chaos, solitons, and fractals, but available computing power has been a limiting factor. In this work, we describe a novel and highly efficient computing and visualization paradigm using a Web Graphics Library (WebGL 2.0) methodology along with our newly developed library (Abubu.js). Our approach harnesses the power of widely available and highly parallel graphics cards while maintaining ease of use by simplifying programming through hiding implementation details, running in a web browser without the need for compilation, and avoiding the use of plugins. At the same time, it allows for interactivity, such as changing parameter values on the fly, and its computing is so fast that zooming in on a region of a fractal like the Mandelbrot set can incur no delay despite having to recalculate values for the entire plane. We demonstrate our approach using a wide range of complex systems that display dynamics from fractals to standing and propagating waves in 1, 2 and 3 dimensions. We also include some models with instabilities that can lead to chaotic dynamics. For all the examples shown here we provide links to the codes for anyone to use, modify and further develop with other models. Overall, the enhanced visualization and computation capabilities provided by WebGL together with Abubu.js have great potential to facilitate new discoveries about complex systems.
1. Introduction
In the 1975 seminal book Fractals: From, Chance and Dimension [1], Benoit Mandelbrot, a Polish-born mathematician, initiated what would become a new geometry by defining objects with a non-integral dimension as fractals. Using this geometry, he was able to explain and describe mathematical objects that for a long time could not be described with “normal” Euclidean geometry, including lines with infinite kinks and other so-called pathological (monster) curves, such as Koch snowflakes [2]. While studying these objects, Mandelbrot was able to describe the geometry of nature and generated new scientific ways to think about the formation of complex nonlinear structures that appear at many scales in biology, physiology, geology, physics, chemistry and astronomy, among many other fields. Fractal geometry, then, provides some of the essential tools to create and explain the generation of many complex objects and processes in nature [3, 4], from the formation of shells [5], ferns [6], corals [7] and other biological branching structures such as leaves, feathers, leaf venation, lung airways and vasculogenesis [8], to rivers and flow phenomena in rocks [9] as well as ice crystals [10], electrical discharges [11] and galaxies [12].
Mandelbrot’s study of fractals began at IBM’s T.J. Watson Research Center, where he received a single summer research offer in 1958 that eventually extended to a 35-year job. During the early 1960s, Mandelbrot worked on several computer applications, but particularly on stock market prices and long-term trends in economic data. In time, he found repeating patterns and power laws characterizing many features of society and nature that, while appearing complex, often could be generated by the repeated application of seemingly simple rules. One of the first applications of fractals was modeling the earth’s rough surfaces in video games. Instead of creating landscapes by hand, fractal landscapes could be generated relatively simply using stochastic algorithms such as fractional Brownian motion developed by Mandelbrot and Ness [13]. This algorithm also was the basis for developing “alien” landscapes that were first used in a movie (Star Trek II) in 1982. As fractals can be formed by iterations of mathematical operations, such as iterative nonlinear functions or maps [1], they also became prominent in the study of chaos [14].
Chaotic systems, first discovered by Edward Lorenz [15], are defined as nonlinear systems that can have well defined equations of motion, yet their long-term prediction is not possible due to their high sensitivity to initial conditions. So, although such systems in principle are deterministic, their behavior cannot be predicted [15]. These systems often display underlying patterns, periodic orbits, self-organization, and self-similarities reminiscent of fractals. Thus, while chaotic systems are described by differential equations such as reaction-diffusion systems [16], some of their dynamics can be approximated by iterative maps like the logistic map [17], which can lead to a period-doubling bifurcation and chaos.
Several fractals, such as the 1D Koch curve and the 2D Koch snowflake, Sierpinski triangle and square [14, 18], as well as chaotic maps such as the Henan, tent, Gaussian and many others [19], are relatively simple to iterate and calculate on a computer. However, there are other fractal and chaotic systems in 1D, 2D and 3D, especially those that describe complex patterns and interesting emerging behaviors, that can require many complex equations and a large number of iterations in time and space. So they are traditionally studied using supercomputers, which prevents broader access to these systems.
In this work, we demonstrate how to model and simulate interactively and in real time fractals, solitons and chaos using a library (Abubu.js) that we have developed [20] to solve large complex numerical problems in parallel. The library uses a Web Graphics Library (WebGL 2.0) methodology that accesses the computer’s graphics processing units (GPUs) via a web browser. GPUs have offered an alternative to CPU computing in recent years [21, 22]. In contrast to modern CPUs, which can have up to tens of computational cores, modern consumer GPUs can have a few thousand computational cores. This means that they have up to a few hundred times more computational power packed into a small package. They are also significantly cheaper, typically costing only a very small fraction of the price of a supercomputer. The major problem with graphic cards so far has been the fact that their programming, including the main languages used to program them, is different from traditional CPUs. Also, developers have to spend a great deal of time programming and compiling their codes for various operating systems and for different GPUs within each of those operating systems. So, although programs run faster, development and code updates become difficult, making it hard to keep up with new hardware introduced into the market.
OpenGL was the first open-source language used to program GPUs [23, 24]. It was developed in 1992 by Silicon Graphics based on its proprietary library IRIS GL (Integrated Raster Imaging System Graphics Library), and while applications to the Mandelbrot and Julia sets were some of the first examples of scientific computing, it has been widely used for other more complex systems. OpenGL has continued to evolve with Vulkan released in 2016 considered as its next generation [25], but other platforms have been developed to access and program GPUs as well, such as OpenACC (a library to simplify parallelization on GPUs), OpenCL (a framework to write programs across heterogeneous platforms such as CPUs, GPUs, digital signal processors, and field-programmable gate arrays) and NVIDIA CUDA (a platform to write codes in Fortran or C++ for GPUs). Coding in GPUs has allowed the study of reaction-diffusion problems even on an Xbox 360 [26]; however the programming is not easy. The complexity of developing codes for the different languages and comparisons of their performances have been quantified for various complex systems including cardiac dynamics [27–29].
In 2011, WebGL, a cross-platform, royalty-free web standard for a low-level 3D graphics application programming interface (API) was released. It can render interactive 2D and 3D graphics that will run under any compatible web browser without the use of plugins. The browser is in charge of compiling and running the WebGL program at run-time for the particular operating system and graphic card used. Thus, if a developer writes a code, it can run on any current operating system and graphics card, limited only by the memory of the device. Furthermore, since the codes use HTML and JavaScript, WebGL codes can be highly interactive. This means that the users can see the effects of changing particular parameters in real-time without any required expertise in supercomputing. All the codes are distributed over the web, but they will run on the users’ computers. This is extremely useful, as users can upgrade their systems on their own to achieve better performance based on their budget and availability of new GPUs. WebGL has become a programming language to create very friendly programs that can run over the web for intensive 3D computing from molecular dynamics [30] and drug design [31] to other medical and clinical [32, 33] applications. However, the WebGL programming API has been geared towards expert developers who have computer graphics design interest at heart. Therefore, developing WebGL codes is a challenging task, requiring a very steep learning curve, for average scientific computing programmers. To overcome this challenge, we have developed a JavaScript library called Abubu.js [20] to significantly facilitate programming WebGL applications for programmers who are not experts in GPU computing. In this work, we present the simple steps necessary to develop the WebGL applications (with their respective links) that can be used by researchers, students and the general public to, interactively and in real time, investigate the dynamics of several fractals, solitons and chaotic dynamical systems. For these systems, we illustrate some examples as a function of parameters that can give an idea of the richness of their dynamics.
2. Fractals
Mandelbrot’s term fractal is based on the Latin word fractus, meaning broken or fractured; he used it to create the concept of fractional dimensions and applied it to geometric patterns, particularly in nature. A fractal is mathematically defined as an object whose Hausdorff-Besicovitch dimension (a mathematical measure of roughness) exceeds its Lebesgue covering dimension (the topological dimension of a topological space) [34]. A simpler definition, however, is an object whose whole is made of parts that are similar in some way to the whole and are not finite geometric figures. Therefore, fractals exhibit unfolded symmetry, that is, similar patterns at increasingly small scales. Those fractals whose replication is exactly the same at all scales are called self-similar, such as the Koch snowflake in 2D and the Sierpinski pyramid and cube in 3D. However, fractals with various degrees of self-similarity provide additional interesting opportunities for study. Here, we present the programming procedure of developing WebGL applications for the Mandelbrot, Julia [35] and biomorphs [36] fractals using Abubu.js library.
2.1. Mandelbrot Set
The Mandelbrot set is defined using an iterative complex quadratic map:
| (1) |
where z and c are complex numbers and m is an integer indicating the iteration number. The number c is chosen as the coordinate of the points on the complex plane. Subsequently, z0 is chosen to be equal to c to initiate the iterative map. The points on the complex plane are said to be a member of the set if and only if the modulus of each member zi of the sequence remains bounded. When c = 1, for example, the sequence diverges, while the sequence remains bounded when c = −1 so that it belongs to the Mandelbrot set. Usually, the set is depicted by assigning a color to each complex value c tested according to whether the sequence remains bounded or, if not, how quickly it diverges. The interesting mathematical peculiarities of using complex numbers in iterative functions was first described by two pioneers of the field of complex systems, French mathematicians Pierre Fatou in 1906 and Gaston Julia in 1918. The first visualization of the set was performed by Robert W. Brooks and Peter Matelski in 1978 [37], but Mandelbrot was the first to actually realize the complexity behind the set as he was able to study the parameter space with the computer power available at IBM and show for the first time the self-similarity of the set at different scales [38] in 1980. However, the main study of the set was not possible until 1984, when the availability of faster computers allowed Adrien Douady and John H. Hubbard [39] to show the recurrence of the basic shape with subtle differences through repeated magnifications; they named the complex quadratic polynomial set after Mandelbrot.
As it is necessary to carry out several hundred to several thousand iterations to determine if a point is a member of the set, even years after the discovery of recurring basic shapes, it is still cumbersome using traditional computing resources to explore different regions of the set. However, this problem can significantly benefit from parallel processing. Each point can be processed completely independently of its neighbors, which makes it embarrassingly parallel. Traditionally, supercomputers were used to achieve parallelism. However, application of our GPU computing paradigm can be applied to harness the power of GPUs for exploring the fractals.
WebGL is a low-level programming language, which makes it difficult for non-expert users to program. In order to overcome this problem, we have developed a programming library that streamlines general-purpose GPU programming.
Our programming philosophy for GPU computing is to treat solution domains as images [21]. Each pixel of the image represents a computational point and each color can represent a quantity to compute. As such, images, which are usually referred to as textures, are an integral data structure in our programming paradigm. These data structures can be defined easily using our library. First, we define a texture that can be used as output in our parallel program to visualize the Mandelbrot set.
![]()
This single line of code defines a 512 × 512 single-precision texture named mcolors that can be used as input and output for our programs.
Abubu.js removes any complexities that are related to the WebGL application programming interface (API). At the heart of our codes are code snippets called vertex shaders that determine the coordinates of each pixel and codes called fragment shaders that color each pixel. They have a C-like syntax, which makes them easily understandable for typical programmers. The same snippet will run for all the pixels of an image in parallel on all the available cores of the GPU, which makes the codes inherently parallel.
Below is a vertex shader snippet that is common across almost all the applications that are presented in this work.
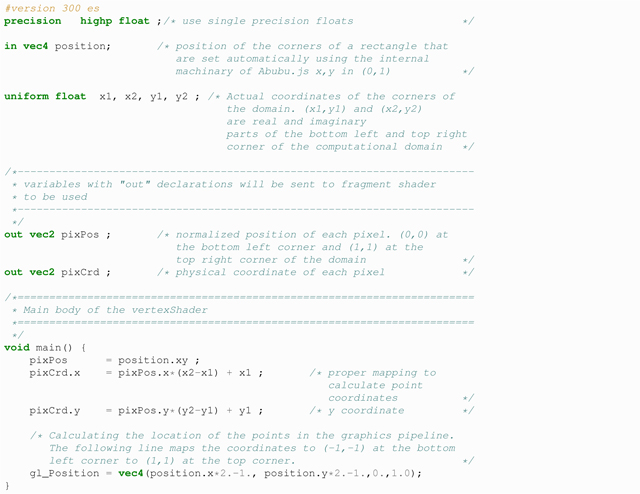
The first line of the code tells the WebGL program that we comply with OpenGL version 3.00. This line is optional when using Abubu.js. The code is commented for clarity and the C-like syntax should make it straightforward for most readers to follow the logic of the code. We would like to emphasize that in shaders, uniform variables are those that are defined uniformly for all the pixels. They are uploaded to the GPU from the JavaScript wrappers. We will subsequently explain how their upload is facilitated through our library. The variables declared with out identifiers will be calculated in the vertex shader and sent to the fragment shader for use. This vertex shader can be used without any modifications as a generic vertex shader in all our subsequent codes.
Now, we will focus on the fragment shader, which includes the main WebGL code for the Mandelbrot set.
![]()
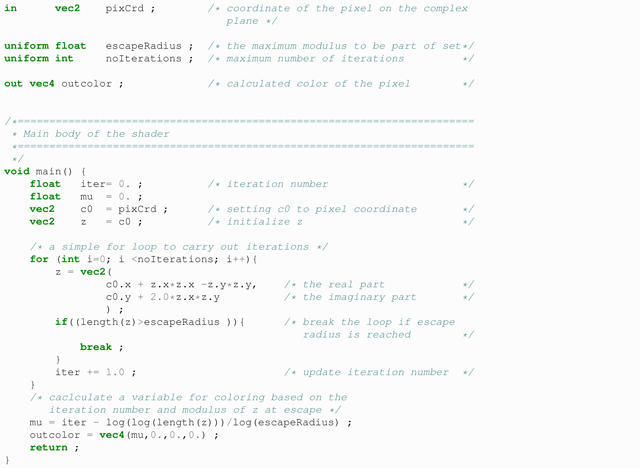
Most of the main body of this shader is simple and clear, although some parts may be new to C programmers. vec2 and vec4 data types represent two- and four-dimensional vectors. Each dimension is a single-precision float. We use the two-dimensional vectors for pixel coordinates and complex numbers and four-dimensional vectors for color calculations. Each dimension/channel of the vector can be accessed using .r, .g, .b, and .a or .x, .y, .z, and .a added to the vector instance to access channels 1–4 or to update them. We can also use z=vec2(<value 1>, <value 2>) to update both the first and second channels simultaneously. The logic of the problem is quite simple and it can be easily coded into a fragment shader.
The next step is where our library comes back into the picture to set up a program to use these shaders. The use of Abubu.js will remove most of the complexities of setting up programs, sending variables and running the program. Assuming that the source codes of the vertex and fragment shaders have been saved as simple strings into variables vertShader and compShader, we can set up our solver/program using the following wrapper.

![]()
This snippet of code creates a massively parallel program that can run on the GPU using the previously discussed shaders. The uniforms structure sends all the appropriate values to be used in the program to the GPU. For example, the following line of the above code:
![]()
states that we want to upload a variable with value of 3.0 that is of type float (‘f’) into the variable escapeRadius in the fragment shader. It should be noted that these values could all be defined as constants in the shader, but uploading them in this way gives us a chance to update their values at run-time to make the application interactive.
To run the program, we simply call comp.render() in the JavaScript file. This simple command hides several layers of detail involved in running the components of a WebGL program in the appropriate order.
The next step is to visualize the solution, which can be carried out using another Abubu.js utility function:

This function will create a plotting program called disp that uses the red (‘r’) channel of the texture (mcolor) on the canvas element with ‘my_canvas’ id. Here, the ‘rainbowHotSpring’ colormap is used for visualizing the field. The minimum and maximum values of the data are set to 0. and 30.0, respectively. To run this program, simply call disp.render() and the field will be visualized on the canvas. This utility Plot2D simplifies visualization of the data structure, which is used in all the subsequent programs that are presented in this paper.
To make the program interactive, we calculate new bounds for the domain of interest using mouse clicks, scrolls and drags. Once the new values are calculated based on the interaction event, simply update the value for the GPU program through the following commands.

Using these simple commands, the values of the mentioned uniforms will be updated on the GPU and the subsequent render() call will use the updated values for running the WebGL program. The variable comp that was an instance of the Abubu.Solver class ensures that sending data to the GPU remains a simple task. To complete the updated solution, we call disp.render() one more time to refresh the results. To simplify this process, we use a recursive function as follows.

![]()
A single call to the run() function in the JavsaScript code keeps recalculating and plotting the results on the screen. If there are any interactions with the code, such as through the mouse for zooming or panning, the updated values will be used in real time and the user will be able to see the results as a live simulation.
While for a program as simple as drawing a Mandelbrot set the level of abstraction as discussed in this section may not appear necessary to seasoned WebGL programmers, this process can be quite daunting for those whose primary interests and expertise are not in programming GPU applications and more in obtaining solutions for computational problems. Our library specifically is aimed at making it easier for non-specialists to create and use WebGL codes for problems that typically arise when studying fractals, solitons, chaos, or any other problems that may benefit from parallelization.
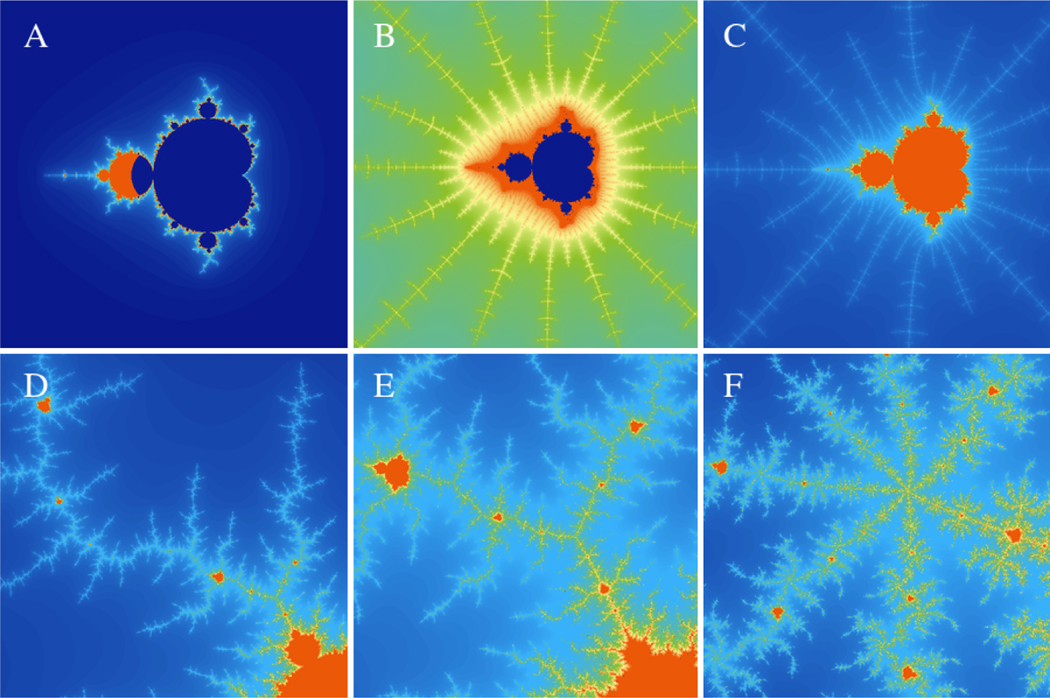
Fig. 1 shows the output of this application and how it can be used to quickly explore different regions of the Mandelbrot set.
Figure 1:
Visualizing the Mandelbrot set. The files to regenerate these figures are included in the supplementary material. Panel A shows the overall outline of the Mandelbrot set. Panels B and C show self-similar copies of the set along the real axis. Panels D, E, and F show different branches of the Mandelbrot set away from the real axis.
The use of the GPU through WebGL makes the massive number of calculations needed to explore the Mandelbrot set at various resolutions significantly simpler. Instead of waiting 5–6 seconds for the domain to be recalculated with each zoom, the calculations are carried out 60 times per second, which makes the calculation and interactions seamless.
2.2. Julia Set
At only 25 years old, Gaston Julia presented a detail study, in a seminal manuscript of 199 pages [40], of iterations of complex numbers by a real function, and for which he received an Academie des Sciences (France) award. Julia sets, as they are known now, are defined as those complex numbers z for which the nth iterate of a rational function fn(Z) stays bounded as n tends to infinity. The Mandelbrot set may appear as a special case of these larger sets. The general form of the iterative formulation is
| (2) |
where zs are complex numbers, c is a complex constant, m is the iteration number, and n is an integer constant. The map is initialized by setting z0 as the coordinate of the point on the complex plane; different sets are obtained by varying c and n. As in the Mandelbrot set, a point on the complex plane is defined to be part of the Julia set if the modulus of each iterate zi remains bounded or smaller than an escape radius. This set can be implemented in WebGL by making some minor modifications to the fragment shader that we presented earlier for the Mandelbrot set. The new shader is as follows.
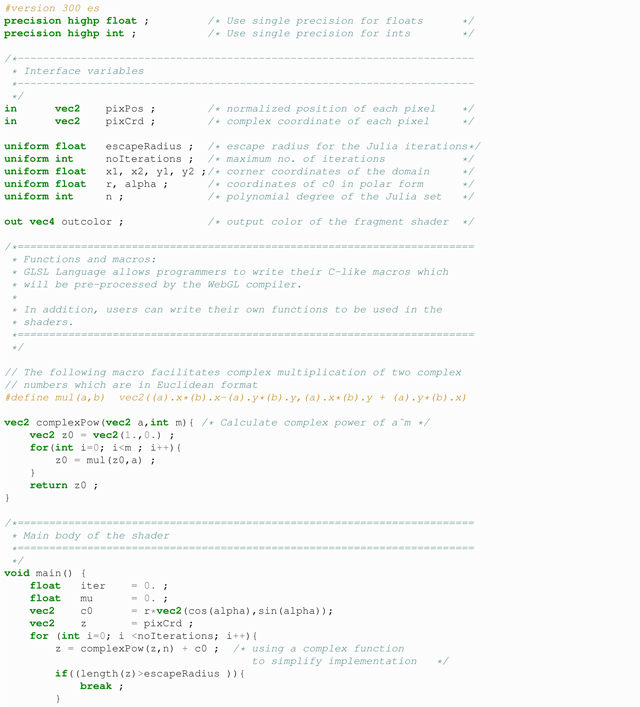

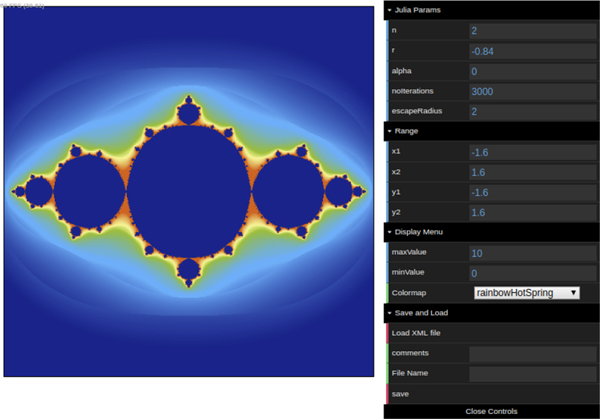
Here, we have added two new uniforms, r and alpha, which will represent the polar representation of the complex constant c = reiα in Eq. (2). We have added a graphical user interface to the WebGL app for changing the values of r and alpha and other uniforms interactively as well. Each time the user changes a value, the values of the corresponding uniforms are updated on the fly and the set is recalculated and plotted as was explained for the Mandelbrot set. To create the graphical interface, we use a standard JavaScript library called dat.GUI. Fig. 2 shows a screenshot of this application with its corresponding graphical user interface.
Figure 2:
The Julia set WebGL application in use with the interactive graphical user interface.
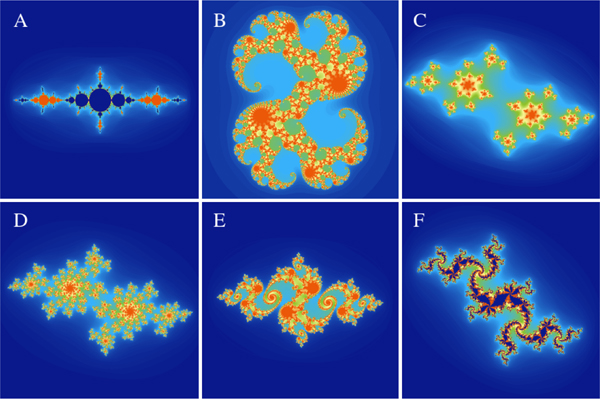
Fig. 3 shows how the quadratic Julia set morphs from one shape into another by interactively changing the complex constant c in Eq. (2). Readers are encouraged to run the program in their browser and explore different regions of the Julia set for themselves.
Figure 3:
Interactively changing the complex constant c in the quadratic Julia set. c = reiα. In panels A to F, the (r, a) tuple is interactively set to (1.36, π), (0.28, 0.03), (0.869, 2.554), (0.773, 2.647), (0.77, 3.02), and (0.75,1.87).
Fig. 4 shows an interactive study of the Julia set for various degrees of the polynomial and values of c in Eq. (2). The last row of the same figure shows examples from zooming and panning interactively to different regions of the set. With the escape radius for the last row set to 40, biomorph shapes that resemble living organisms start to appear in different regions of the set. The patterns look similar to those observed in the biomorph set described next.
Figure 4:
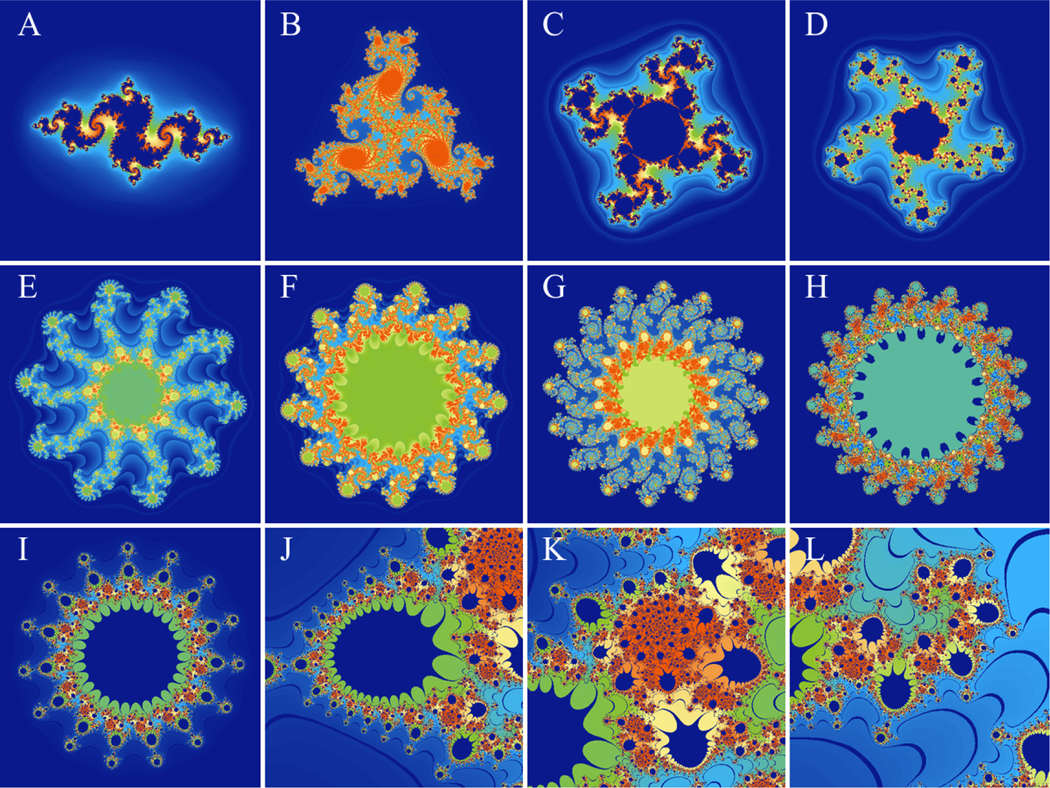
Interactive study of the Julia set for various polynomial degrees and c values. To reproduce panels A-H, we set n to 2, 3, 4, 5, 10, 13, 16, and 19, c to 0.82e2.95i 0.77e1.66i 0.79e1.53i 0.79e1.81i 0.84e2.02i 0.84e2.02i 0.84e2.02i and 0.8713e2.0247i respectively. To produce panels I-L, we set n =15 and c = 1.035e2 02i. Panel I is the overall view of the set and panels J-L are achieved by interactively zooming and panning to different regions of the same set. The input files to reproduce all the panels are included in the supplementary material.
2.3. Biomorph set
Biomorphs are fractals that are intended to resemble living organisms. They were introduced in 1986 by Pickover [36], who originally found them accidentally as a bug in a code intended to calculate approximations of the Julia sets. Mathematically, they are another class of iterative sets that have been used to simulate evolution of unicellular organisms with internal structures [41, 42]. Generalizations of the Julia set and further modifications of the biomorph algorithm and implementations of different iteration methods have been performed by Gdawiec et al. [43]. Here, we use the following iteration
| (3) |
where z is a complex number; m is an integer indicating the iteration step; n is an integer constant; α, β, γ, δ, x, and y are real constants; and z0 is the initial value of z corresponding to the coordinates of the points on the complex plane. A point is a member of the set if and only if both the real and imaginary parts of z remain smaller than a certain bound. Moreover, to color these sets, instead of considering the modulus of z like the Mandelbrot and Julia sets, we only use the signs of the imaginary and real parts when z escapes the applied escape value, resulting in the use of at most four colors. The corresponding fragment shader for calculating the biomorphs set is as follows.
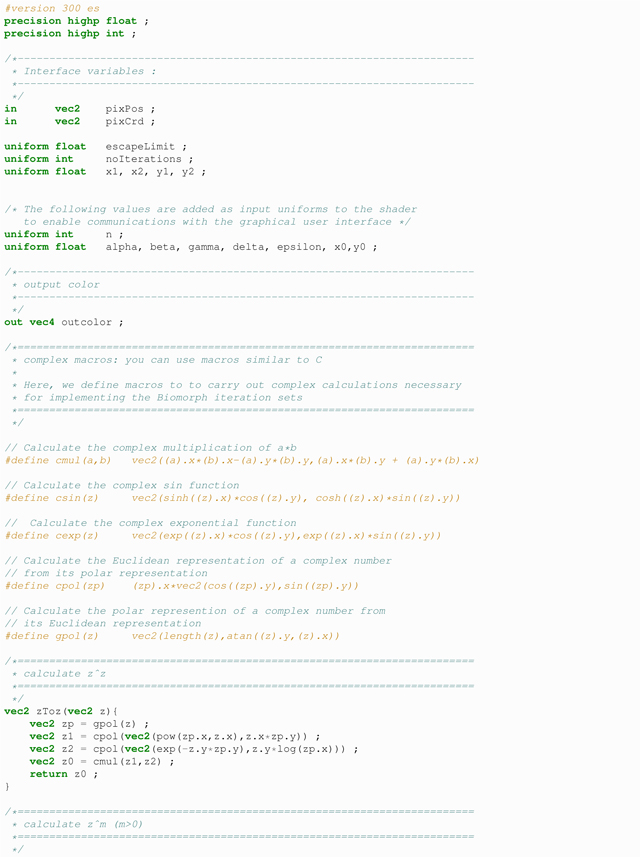
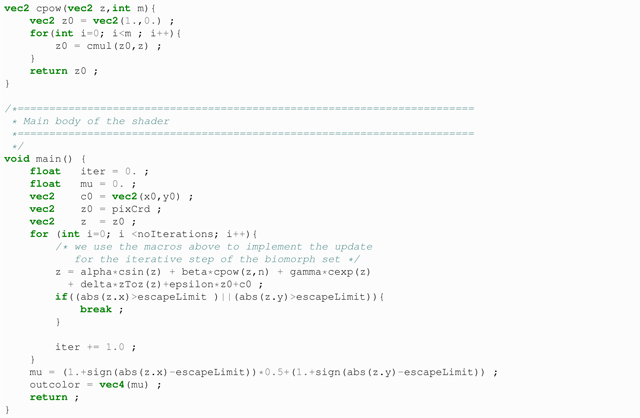
The above code implements the biomorph set update step in a logical and readable way, as WebGL allows for the use of macros and functions in shader codes. The use of our library enables us to concentrate our effort on designing the above shader as the wrapping part, and interaction with the GPU is simplified through Abubu.js.
Using the above shader together with Abubu.js library, we were able to create an interactive WebGL program to produce the fractals observed in Fig. 5.
Figure 5:
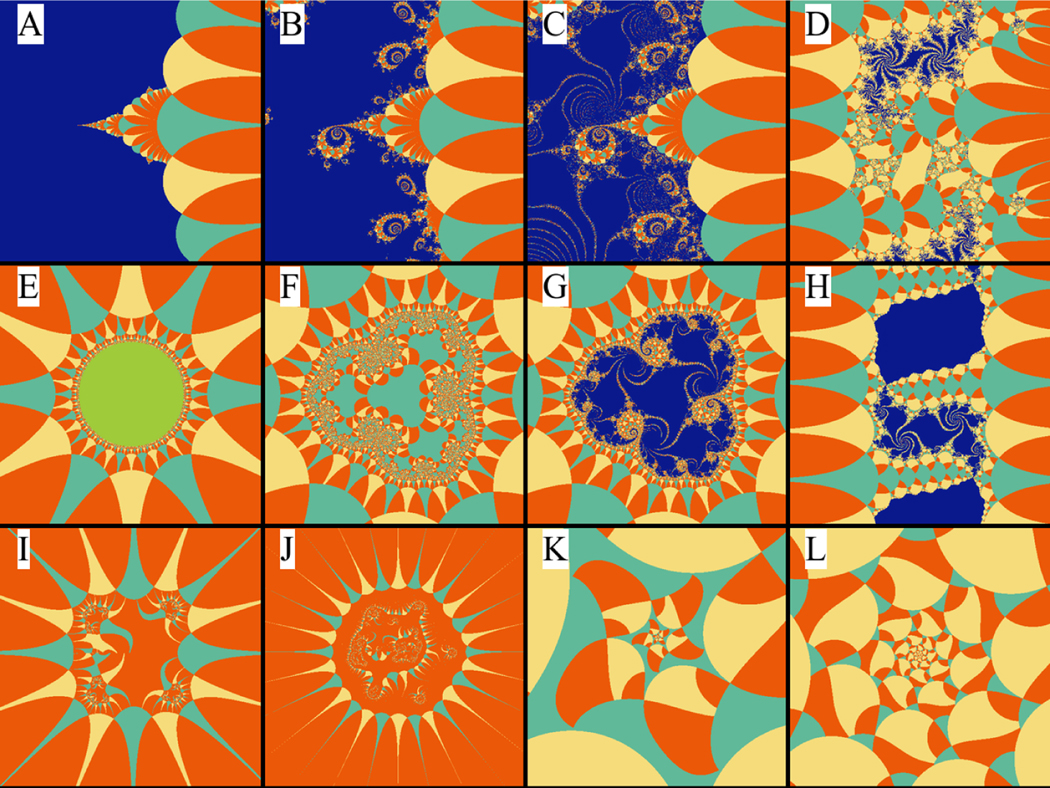
Various visualizations of the biomorph set using different parameters. In panel A, α = β = γ = ϵ = x0 = y0 = 0 and δ = n = 1.0. In panel B, we change x0 = 9.72 × 10⁻³ and y0 = 1–18 × 10−3. In panel C, minor changes to x0 = 1.10 × 10⁻² and y0 = 1.14 × 10⁻³ produce the fine details that are observed. Panel D is obtained by setting α = 1., x0 = 0.669, and y0 = 0.2297. Panel E is obtained by setting α = γ = ϵ = x0 = y0 = 0, β = 1 and n = 3, which transforms into panel F by increasing x0 into 0.4, and then into panel G when y0 is increased to 3.4 × 10⁻³. Panel H is obtained by setting α = β = γ = 0, α = n =1, x0 = 0.5 and y0 = 0.077. Panel I is obtained by setting α = γ = ϵ = 0, β = δ = 1, n = 4, x0 = 1.5 and y0 = 0.3. Panel J is obtained by setting α = ϵ = 0, β = δ = 1, γ = −2, x0 = 1.5548 and y0 = 0.366. Panel K is obtained by setting α = β = ϵ = ϵ = x0 = y0 = 0, and γ = n = 1, which transforms into panel L is by setting x0 = −.535 and y0 = 0.043.
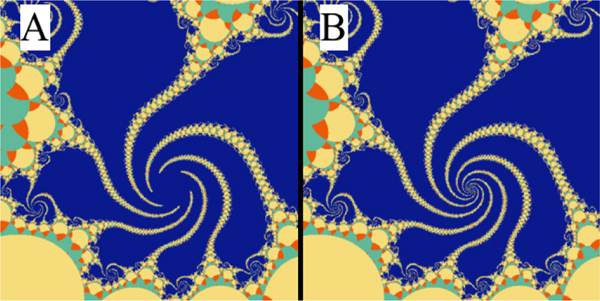
Fig. 6 shows that it is easy to lose the details of the fractal structures when convergence is not achieved. It is more probable to overlook the convergence issues when the computational cost is very high. However, by using WebGL it is easy to achieve converged solutions without any noticeable decline in performance.
Figure 6:
Convergence can be easily achieved and no details need to be lost. The parameters in panels A and B are identical to Fig. 5H; here, we zoom into the spiral section of the fractal. Panels A and B use 300 and 1000 iterations, respectively.
3. From solitons to chaos
Solitons are defined as wave packets that maintain their shape as they propagate. They tend to appear as solutions for a large range of partial differential equations and in nature were first described by John Scott Russell in the 1830’s while observing solitary waves in the Union Canal in Scotland [44, 45]. Solitons can have several characteristics depending on the systems they describe. Some solitons can pass through each other after a collision, as in elastic or water waves, while others can annihilate with each other, as in excitable media such as fire and neuronal and cardiac tissue. The dynamics of solitons can vary as well; for example, “dispersive systems ” will have a velocity dependence as a function of frequency, while others can have constant velocities or even a velocity of zero, becoming standing waves such as in Turing patterns [46]. When solitons interact in two and three dimensions, they can also lead to complex pattern formations and chaotic dynamics [47]. In the next section, we describe some WebGL implementations to simulate and study different types of wave dynamics in one, two and three spatial dimensions.
3.1. One-dimensional systems
One of the most famous systems that produces solitons is the FitzHugh-Nagumo model [48], a two-variable model that describes a generic excitable medium and that was introduced as a simplified neuronal model. This model was first derived from a Van der Pol relaxation oscillator [8, 49] by Fitzhugh [50] to model a system that accounted for a fixed point that can be either stable, resulting in an excitable system, or unstable, resulting in an auto-oscillatory system, depending on the model parameters. About the same time, Nagumo et al. [51] derived a similar model as a simplification of the Hodgkin-Huxley [52] axon nerve model and simulated its propagation using an array of transistors in 1D. Thus, the model is now commonly known as Fitzhugh-Nagumo model for excitable media. The model can be written in several equivalent ways, with one of the most common ways being:
| (4) |
Here, the cubic term in u has three roots, 0, a and 1. So, the value of the u variable that represents the voltage is scaled around 0 and 1 and a acts as the threshold for excitation. ϵ is the relative ratio of time scales for the u and v processes; as its value is in general considered to be less than 1, the u dynamics is much faster than the v dynamics as ϵ goes to zero. D is the diffusion coefficient for the u variable that diffuses in space. Diffusion also can be added to v when the model is used to simulate chemical media [47, 53].
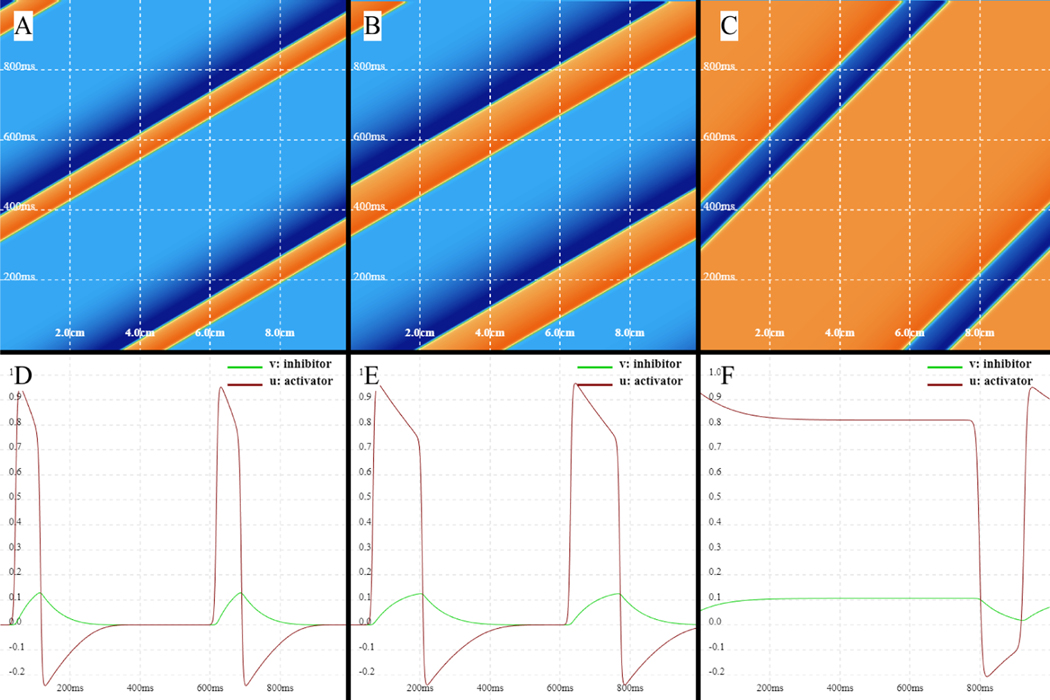
This model can be used to represent the membrane potential changes, known as action potentials, induced in cardiac cells and neurons as a result of stimulation (external or self) [54]. The model is also capable of generating propagating excitation waves in space [51]. For example, Fig. 7 shows a solitary wave generated by the FitzHugh-Nagumo model for different parameter sets that can alter the wavelength. In this case, periodic boundary conditions are used to create a ring geometry. The top row shows time-space plots of the fast variable u that represents the membrane voltage, with waves propagating rightward; as the excitation threshold value of a is decreased, the excitability of the system increases, leading to increased velocity and wavelength. The slope of the wavefront in the figure indicate the velocity, with steeper slopes representing faster propagation. The bottom row shows the variables u (red) and v (green) as a function of time for a fixed location on the ring. Again, as a is decreased, the wavelength increases, and the slow variable v also takes longer to recover. With our WebGL implementation and Abubu.js library, it is simple to vary the parameter slowly over time to study their effect on the solution behaviour without the need to run separate simulations/studies with predefined fixed parameter values, as shown in Fig. 7.
Figure 7:
Solitary propagating diffusive waves for the FitzHugh-Nagumo model in a domain with periodic boundary conditions. Top row: time-space plots indicating waves of u propagating rightward; periodic boundaries are at the left and right edges. Bottom row: u and v at a fixed location at the center of the domain over time. Parameter a was slowly changed from 0.3 to 0.2 and 0.15 from A to C and D to F.
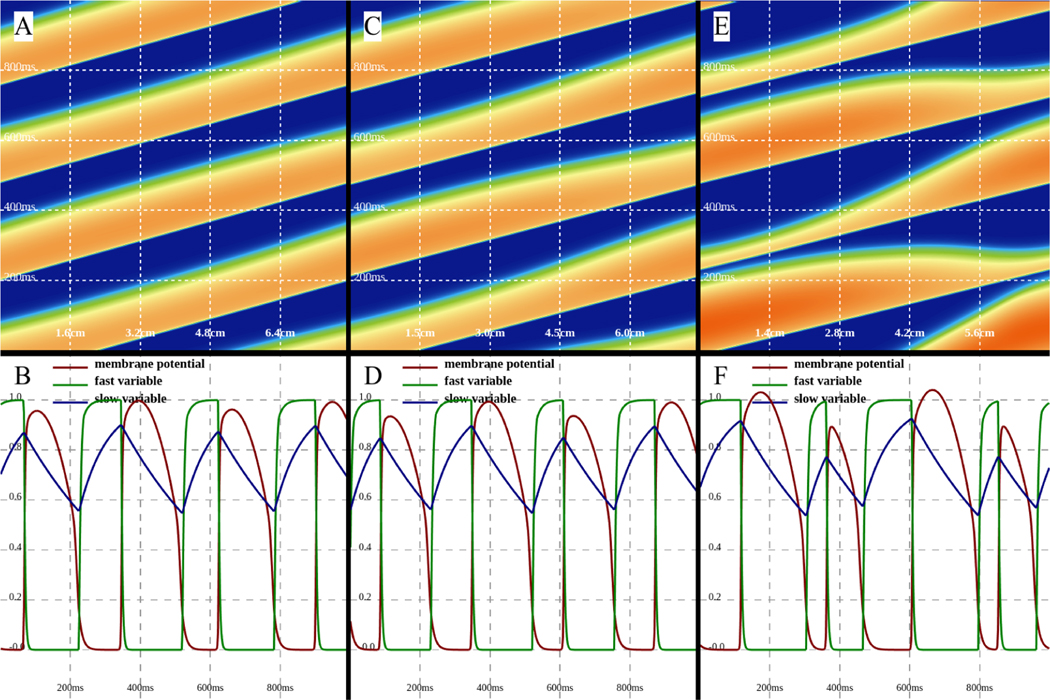
Along with simple wave propagation [51], interactions between waves can be studied by interacting with the mouse and generating new activations and waves using WebGL. Reaction-diffusion systems can also display new emerging behavior as the system dimension increases. For example, cardiac cells are known to undergo a period-doubling bifurcation when stimulated at very fast periods [55,56] that is known to be proarrhythmic [57]. As the period of stiumlation is increased, the dynamics progress from having identical action potentials every beat to a state called alternans in which the action potentials alternate in duration between long and short. The bifurcation parameter is thus the period of stimulation: shorter periods provide less time for recovery, which leads to the instability. Alternans in tissue can become even more complicated because the speed of wave propagation can also depend on the recovery time. Thus, it is possible for the wavelength of a wave to change between long and short while it is propagating. This phenomenon has been observed experimentally in cardiac tissue [58, 59] and has been explained theoretically and numerically [60, 61]. Fig. 8 shows examples of propagating waves and the development of alternans using the three-variable Fenton-Karma (FK) model [62] in a domain with periodic boundary conditions using a WebGL program. Time-space plots in the top row correspond to the plots in the bottom row of state variables (voltage: red; fast inward current inactivation gate: green; slow inward current inactivation gate: blue) over time at a fixed location at the center of the domain. In Fig. 8A-B, no alternans occurs. Fig. 8C-D shows the development of alternans with a small but noticeable transition in wavelength (long to short or short to long) as each wave propagates. The alternans is even more pronounced in Fig. 8E-F.
Figure 8:
Three-variable minimal model: occurrence of alternans can be easily studied by using interactive simulations. From A to C, we set the domain size interactively to 8cm, 7.5cm, and 6.0cm. A single activation is initiated on the lower boundary and periodic boundary conditions are used after ensuring a single unidirectionally propagating wave. As the domain size becomes smaller, alternans start to form. We use parameter “set 4” from Fenton et al. [63].
3.2. Two-dimensional systems
In two dimensions, new types of waves can be studied depending on the type of system. In this section, we show the dynamics of solitons that can interfere when they cross, as in elastic media, as well as solitons that annihilate, as in excitable media.
In 1746, d’Alembert wrote the wave equation for one-dimensional systems [64]; a few years later in 1766 Leonard Euler wrote the multi-dimensional version [65]. The d’Alembert equation in space is given by
| (5) |
where c is the propagation speed of the wave and u represents the wave signal. For simulations, the wave equation can be writen as two first-order differential equations as follows:
| (6) |
where v is the time derivative of u. This formulation has only first-order derivatives of time and is more straightforward to solve numerically. We use the Euler time-stepping scheme to update v and the Verlet time-stepping scheme to update u. We will use the wave equation to demonstrate the methodology to use the Abubu.js library to solve time-marching problems.
Eq. (6) has two state variables, namely u and v, which we assign to the red and green channels of image data structures to form the time-marching code. We use the following fragment shader.
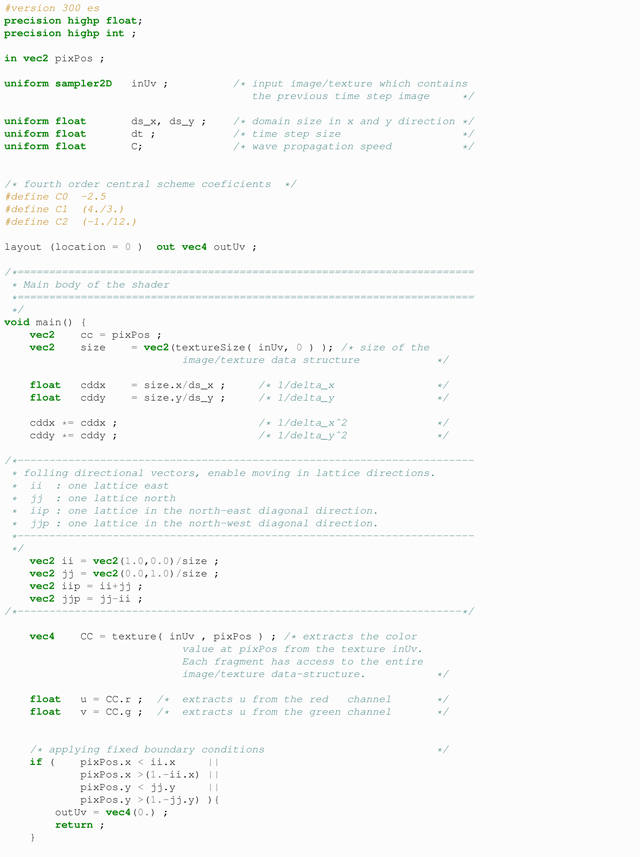
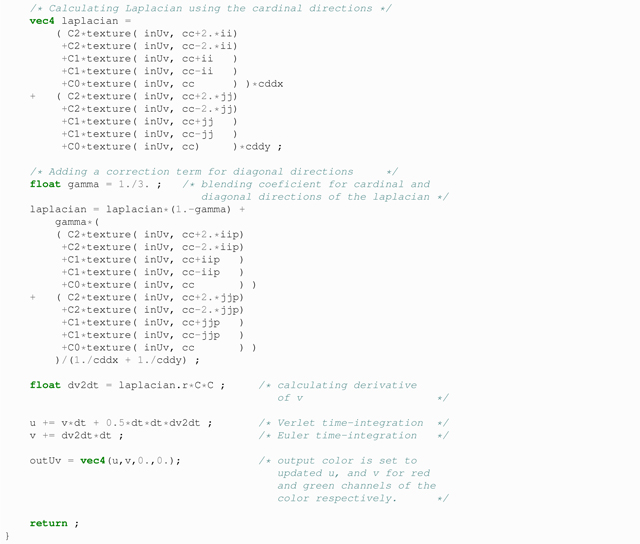
This fragment shader uses a new uniform variable of the type sampler2D, which is the image/texture data structure that contains the information about the current time step. Each fragment (or pixel) in the shader has access to all the pixels of this data structure. Accessing the pixel values of this texture is facilitated by the use of the texture function, which accepts a sampler2D variable and vec2 variable as the position of the desired pixel. The variable pixPos is calculated in the vertex shader, which is identical to that of the fractals. Several calls to the texture function appear in the fragment shader to make the calculation of the Laplacian operator using a fourth-order central scheme possible. To maintain a high level of accuracy in this simulation, we have also included the diagonal directions in the calculation of the Laplacian. Therefore, we are using a 17-point stencil to calculate the Laplacian. After time-stepping is updated using the Euler and Verlet schemes, the updated values of u and v are packed again in the red and green channels to color a new texture. To avoid typical problems that may arise for a shared memory parallel application, such as competition for data, WebGL does not allow the same texture to be both the input and the output of the same shader. Therefore, to create the application that can update the solution of the wave equation, at least two textures are needed. Assuming a 512×512 computational grid, the following JavaScript calls to Abubu.js are used to create the necessary textures.
![]()
Assuming that the source code for the vertex shader and the above mentioned fragment shader are stored as strings in variables vertShader and waveShader, a WebGL program can be defined that receives fuv as the input texture and writes suv as its output texture as follows.

The above snippet of code automatically defines a program named wave_1 and sets inUv in the fragment shader to the texture fuv. When the program is executed by calling wave_1.render(), the rendered colors will be stored in the suv texture. Similar to the fractal programs, this program will be also massively parallel by automatically utilizing the GPU cores to update several pixels each time step. In order to update the solution from suv into fuv for another time step, the following program is defined.

The above program is identical to wave_1 except that the roles of the textures fuv and suv are swapped in this program. Executing wave_1 and wave_2 sequentially will result in updating the solution for two time steps and marching the solution from fuv to suv and then back into fuv. This has the potential of creating a marching loop without the need to use fuv or suv as both input and output textures at the same time in any time step. Assuming similar to the Mandelbrot program disp that visualization is used to plot the red channel of fuv texture, we can finalize the time marching loop as follows.

Calling the above function once results in an infinite loop that will keep marching the solution for two time steps and then updating the color plot of the displacement field. Since most modern screens update at 60Hz frequency, the plotting step becomes the bottleneck of the solution by allowing only for 120 steps per second of wall time. To overcome this bottleneck, the above function can be modified as follows.

This implementation updates the solution for ns time steps before attempting to visualize the solution. By changing the variable ns, either through the main code, or through the graphical interface, the simulation speed can be controlled. Fig. 9 shows the result of running this program from a circular initiated disturbance at the center of the domain.
Figure 9:
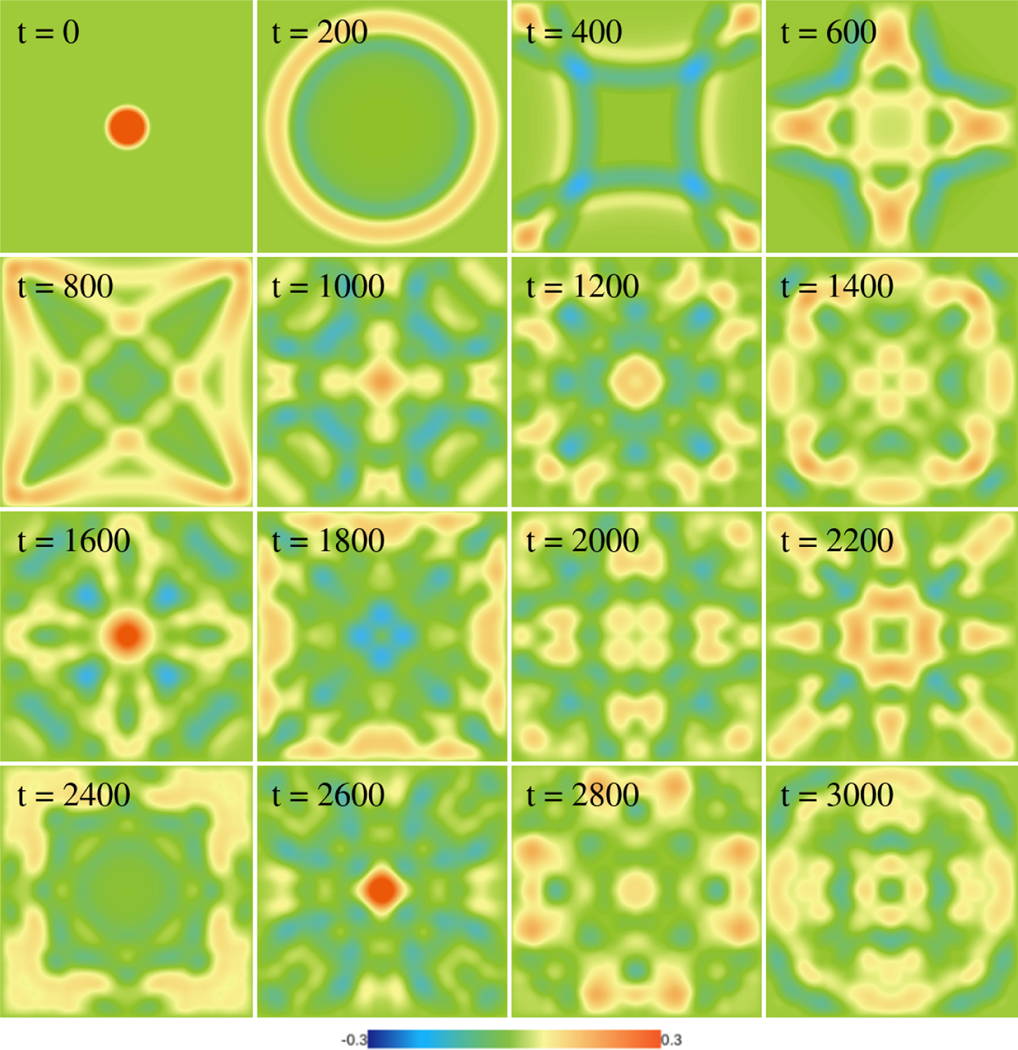
Simulation of the wave equation on a 512×512 domain. A circular wave is initiated at the center of the domain that propagates away from the center and and interacts with rigid boundaries. Note how symmetry is maintained for the long duration of the simulations, which attests to the stability and reliability of the library. The simulation was completed in less than 3 minutes on an NVIDIA Titan-V GPU and required solving more than 1.57 × 10¹² differential equations.
Reaction-diffusion systems can support the formation of complex Turing patterns [46]. One of the most widely used models to study pattern formation in animal fur and skin is the Gray-Scott model [66, 67], which can be formulated as
| (7) |
where u and v are the state variables, f and k are often referred to as feeding and killing rates, and Du and Dv are the diffusion coefficients of u and v, respectively. In different parameter regimes, the system can display a broad range of different dynamics. Fig. 10 shows examples of six different dynamics exhibited by the Gray-Scott model, including spots, stripes/labyrinths, spiral waves, and chaos.
Figure 10:
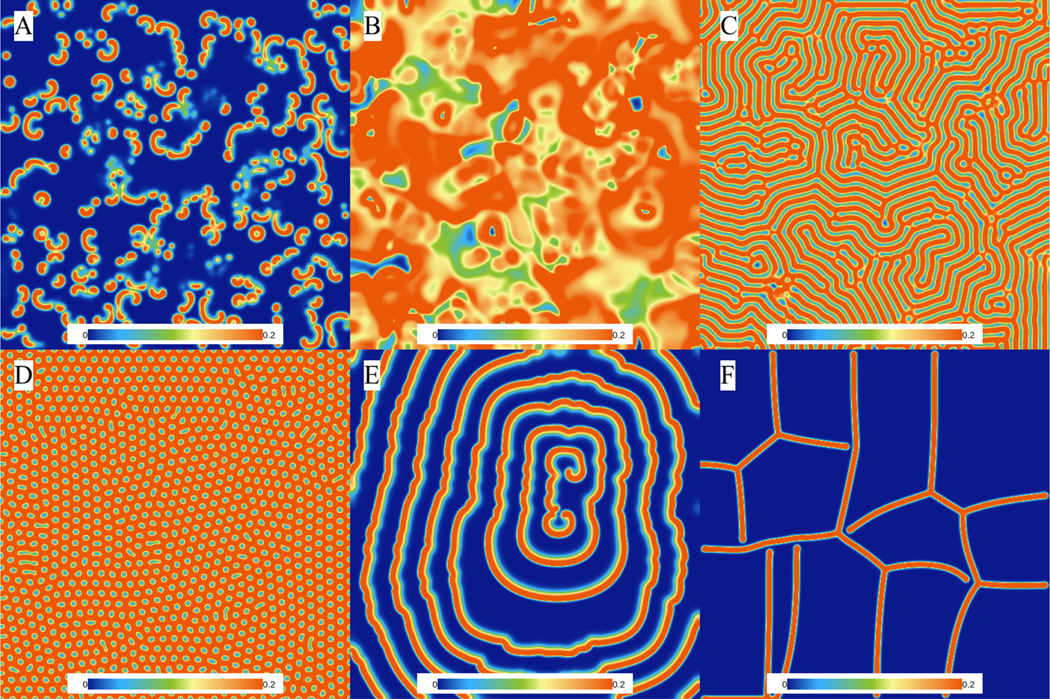
Different patterns can be observed using the Gray-Scott model. (A) Alpha waves: Du = 0.21, Dv = 0.11, f = 0.01, k = 0.047; (B) Beta waves: Du = 0.2097, Dv = 0.105, f = 0.014, k = 0.039. (C) Gamma waves: Du = 0.2097, Dv = 0.105, f = 0.022, k = 0.051. (D) Turing dots: Du = 0.2097, Dv = 0.105, f = 0.03, k = 0.055. (E) Attracting spirals: Du = 0.2097, Dv = 0.105, f = 0.01, k = 0.041. (F) Soap bubbles: Du = 0.2097, Dv = 0.105, f = 0.09, k = 0.059.
Other reaction-diffusion systems similarly can form stable patterns. For example, Liu et al. [68] suggested the following formulation.
| (8) |
This equation was implemented in WebGL, which can be found here, and reproduces the spotted fur/skin patterns observed on fish and other animals such as leopards.
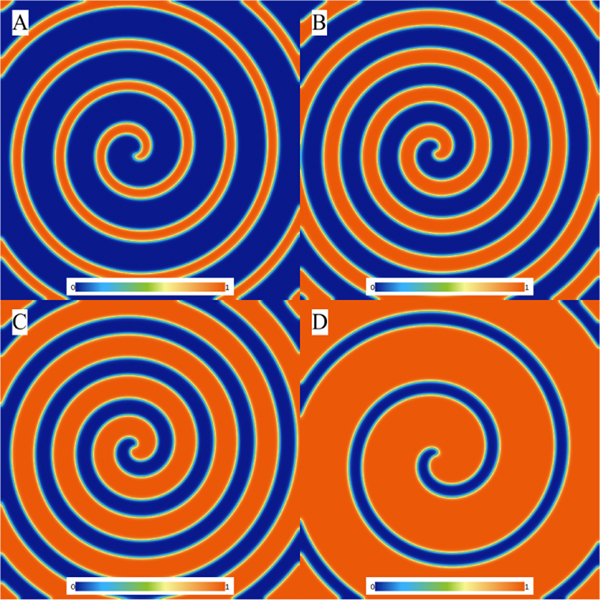
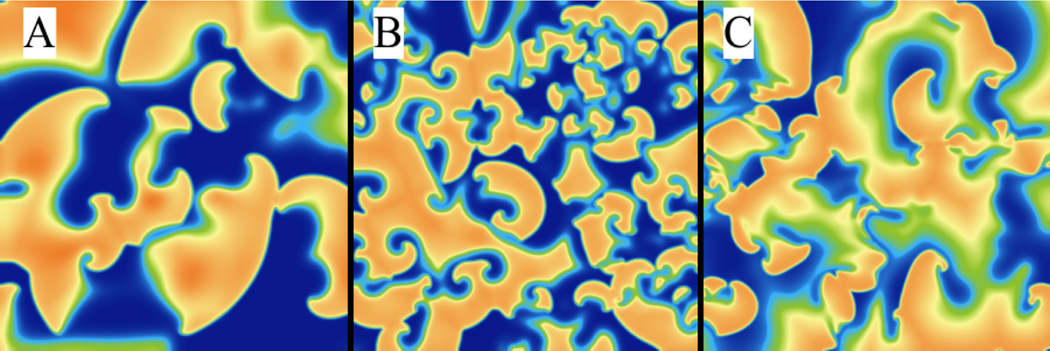
Excitable systems like the FitzHugh-Nagumo model also exhibit new emergent behavior in two dimensions, with the most dramatic being spiral waves, which exhibit a large range of dynamics [69–71] and which have been also observed in experiments in chemical systems [72] and cardiac tissue [73, 74] among many others. A single spiral wave can be initiated by breaking the symmetry of a propagating wave; in experiments and in simulations this typically is accomplished using a cross-field stimulation protocol [75]. Numerically, this can be done by initiating a plane wave from one boundary and, once it has reached the center of the domain, launching a plane wave at a 90-degree angle to the receding wave back. Most reaction-diffusion models have a range of parameter settings for which spiral waves are possible. Fig. 11 shows an example of a spiral wave initiated using the Barkley model [76], which is formulated as follows.
Figure 11:
Spiral wave in the Barkley model initiated when the parameters of the Eq. (9) were set to a = 0.5, b = 0.04, and ϵ = 0.02 (panel A). Then, parameter a of the model was slowly and interactively changed to 0.8, 1.0, and 1.2 from B to D. Note how the wavelength increases as a is increased.
| (9) |
Four different values of parameter a, which affects the wavelength, were used in Fig. 11. Thus, spiral arms can be spaced relatively far from each other or may be packed close together. This model has parameter regimes defined by only two parameters that can be used to obtain no spiral waves, spiral waves with different type of trajectory (circular, epicycloidal, cycloidal, hypocycloidal) [76] that can be simulated with the WebGL program.
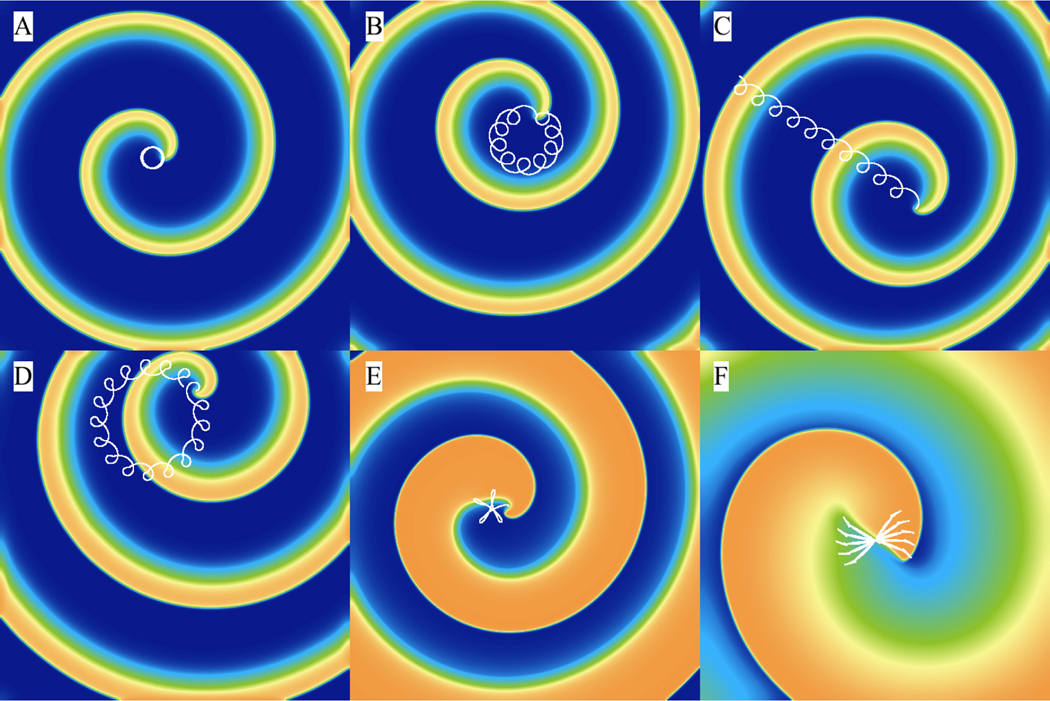
Spiral waves can trace out different patterns as they rotate depending on the excitability and wavelength [77]. In Fig. 12, we use the FK model [63] to show six different types of trajectories that spiral waves can follow, including circles (A), inward petals (epicycloidal) (B), translating petals (cycloidal) (C), outward petals (hypocycloidal) (D), a complex non-repeating pattern (hypermeandering) (E), and precessing lines (F). The trajectories were obtained interactively by modifying parameter values on the fly. In particular, by reducing the system’s excitability through increasing the time constant of the excitability parameter τfi, the system reduces its excitability (as it takes longer to excite), which promotes the development of outward-petal and then circular trajectories that grows in diameter as the excitability is decreased. Upon further decreases in excitability, a spiral wave will reach an infinite core radius of rotation with zero rotational frequency [78, 79] (equivalent to a propagating broken pulse) and then becomes retracting waves until excitations can no longer propagate [80].
Figure 12:
Spiral wave trajectories in the three-variable Fenton-Karma model [63] can be reproduced with ease by changing model parameters interactively. Panels A to D were obtained by initiating a spiral wave starting with parameter “set 1” in reference [63]. From A to D, the time constant τd was gradually decreased and set to 0.42, 0.40, 0.389, and 0.38, to obtain circular, epicycloidal, cycloidal, and hypocylcoidal trajectories, respectively. The hypermeandering trajectory in panel E was obtained by using parameter “set 10” from the reference [63] and the linear trajectory in panel F was obtained using parameter “set 2” of the same reference.
Fig. 12 shows cases where the spiral wave remains stable; however, it is also possible for spiral waves to become unstable and break apart into multiple spiral waves through a large number of mechanisms [63]. The new waves may be short- or long-lived depending on factors like the model structure, parameter values, domain size, and boundary conditions; collectively, they can be classified as arising from several different mechanisms. For example, action potential alternans in 2D can break spiral waves far from the core for circular trajectory spiral waves [81] and close to the core for hypermeandering spiral waves [82]. A decrease in temperature can elongate wavelengths and increase alternans, thereby facilitating breakup [83, 84]. In addition, boundary conditions [63] and gradients in physiological parameters [85] can induce breakup.
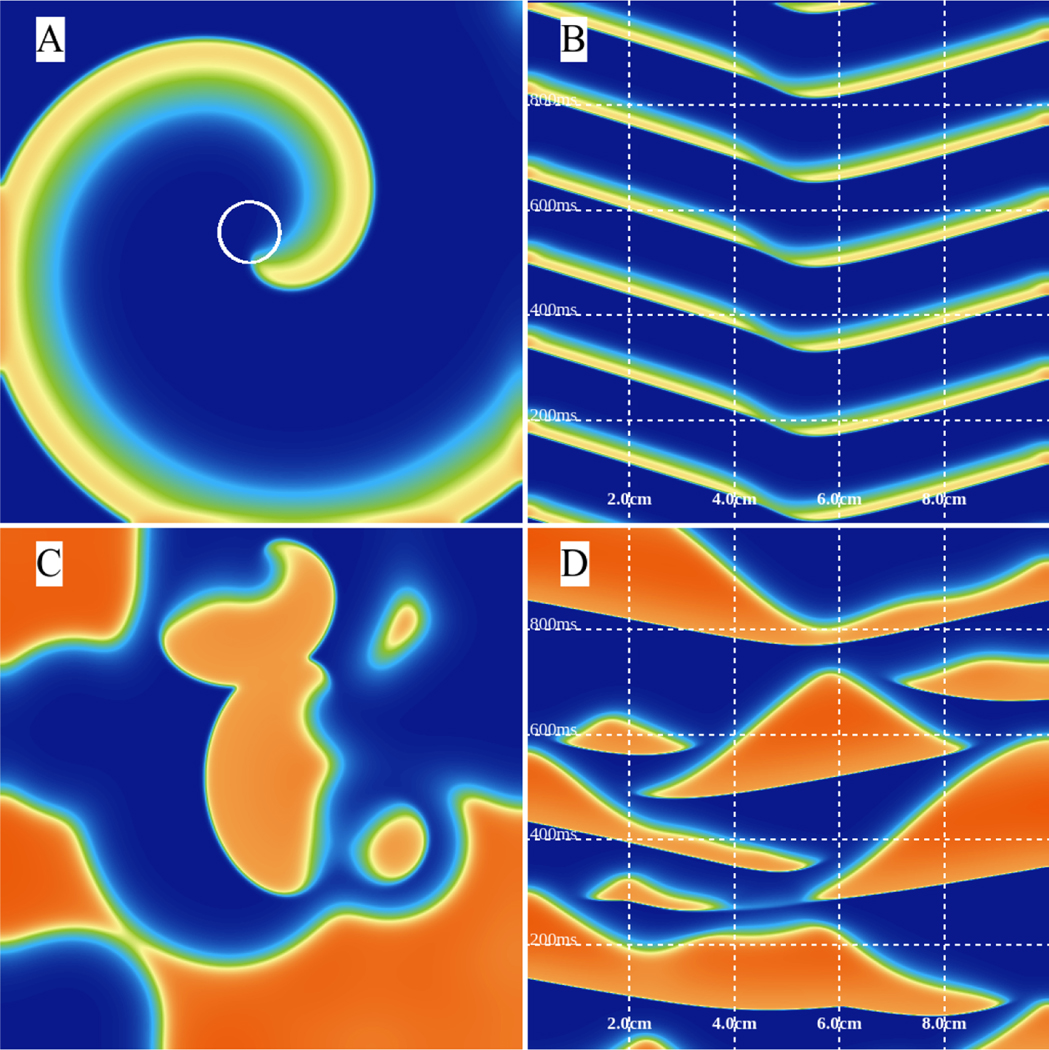
Fig. 13 shows examples of dynamics associated with three mechanisms of spiral wave breakup [63] using the FK model. Along with snapshots at particular times, our WebGL implementation allows interaction with the system by adding regions of stimulation using the mouse and by changing model parameters on the fly. There are also easy visualization alternatives like that depicted in Fig. 14, which shows on the left two types of spiral wave dynamics (stable and breakup) and on the right the same simulation but only for one spatial dimension vs time. Plots B and D show space in the horizontal axis and time on the vertical axis. Thus, the right panels represent a view at the horizontal mid-plane cross-sections through the three-dimensional time series. Here, this view allows for simpler interpretation of the single spiral wave with waves propagating with the same velocity alternating between right and left from the center. For the breakup case, it is possible to see initiation of waves at different points other than the center of the tissue, with some waves very short-lived and clear oscillations in wavelength characteristic of alternans.
Figure 13:
Breakup arising from a number of mechanisms can be easily modeled using the three-variable Fenton-Karma model [63] using WebGL. Parameter sets 4, 5, and 9 of reference [63] were used to obtain panels A, B, and C, respectively.
Figure 14:
Spiral wave dynamics using the three-variable Fenton-Karma model [63]. (A) A circular core spiral wave is initiated using parameter “set 1” of reference [63]. (B) Activations along the horizontal mid-plane in the domain for the same spiral wave. The solitary waves propagate to the left and right as a result of the spiral wave activity. (C) Breakup pattern using parameter “set 3” of reference [62]. (D) Horizontal mid-plane activity through time. A drastic change in the mid-plane activity is observed that no longer conforms to the solitary wave generation that was earlier observed.
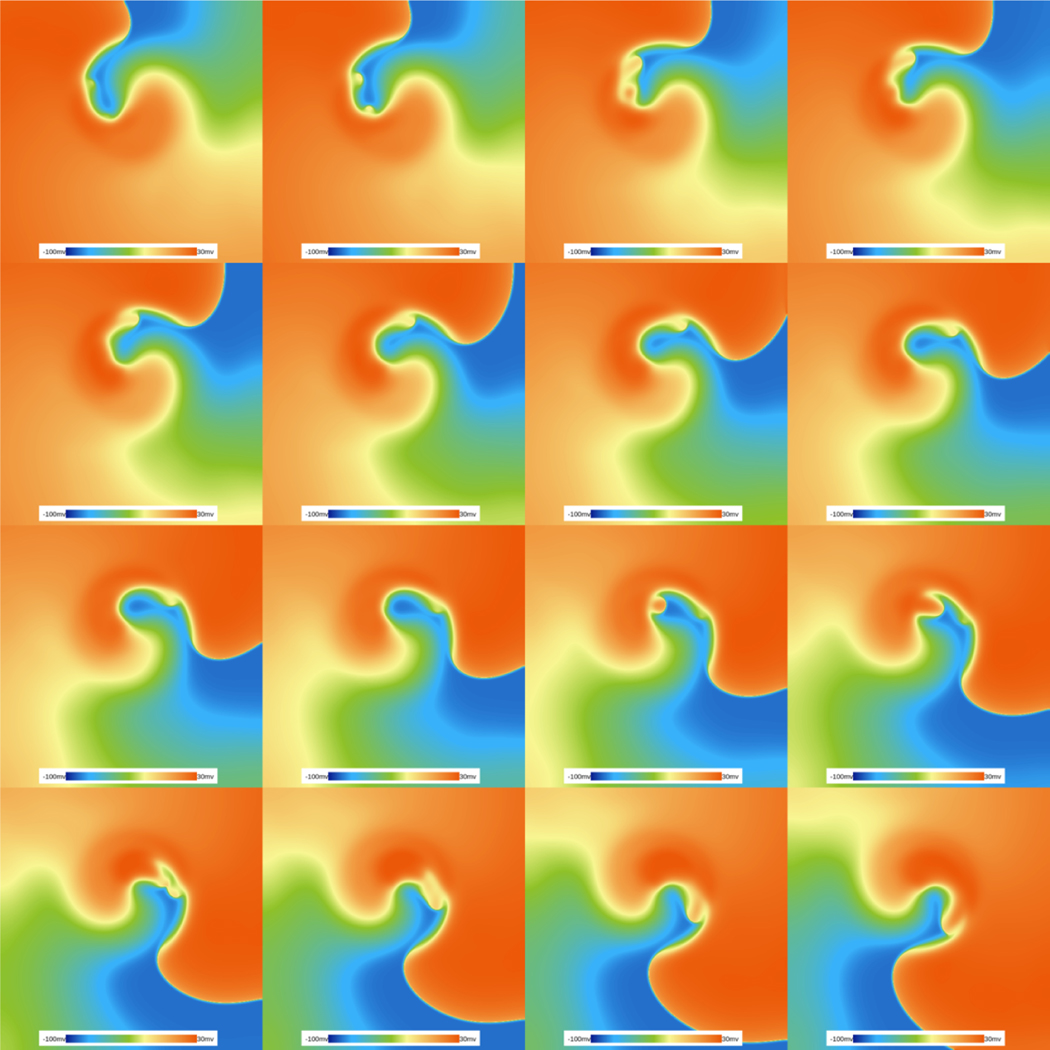
While so far we have shown the power of simulations in WebGL using relatively simple models, it is possible to simulate much more complex models fast enough that they can run at speeds near real time [20]. Here, we show an example of simulations in 2D of what is currently considered the most realistic and accurate human ventricular model to date, the OVVR model [86]. This model is now being considered as the standard for testing and evaluating drug safety by the FDA under a recently sponsored Cardiac Safety Research Consortium initiative (CiPA) [87, 88] that specifies the use of mathematical models of cardiac cells to aid in pro-arrhythmic drug risk assessment. The OVVR model simulated here consists of 41 differential equations and hundreds of parameters for just a single cell. Using an NVIDIA Titan-V graphic card, our WebGL programs developed using Abubu.js can solve over 42 billion ODEs per second. This means that for a 512×512 domain, it is possible to march this model for 400 ms in only 1 second of wall-time! This implies at the moment our WebGL programs can operate close to real time even for a complex model such as the OVVR model. This speed will allow researchers and students without access to supercomputers to be able to simulate and study this model as a function of parameters and the effects of simulated drugs. Simulations of the OVVR model in Fig. 15 show several frames of a spiral wave rotating in a regime where the sodium conductance is enhanced by a factor of 2 and the L-type calcium current is blocked by 55%. This leads to self activations occurring on the backs of the waves known as early afterdepolarizations (EADs), which have recently been shown for the first time to appear on the high curvature of the wave back [20].
Figure 15:
EADs in the OVVR model obtained by enhancing the sodium current by a factor of 2 and blocking the L-type calcium current by 55%. The figure shows a time-lapse sequence over a 160 ms period on a 512×512 domain. The figure shows a spiral wave rotating clockwise that is continuously destabilized by activations that appear in the highly curved back section of the wave. This section, while in principle highly refractory, allows activations to continuously propagate.The time lapse requires solving at least 17 billion ODEs, which was carried out in 400 ms of wall-time on an NVIDIA Titan-V GPU using our WebGL program.
3.3. Three-dimensional systems
One important characteristic of complex systems is that there is often emerging behavior in their dynamics as the system increases in dimensionality. For example, 2D spiral waves in excitable systems become scroll waves in 3D, which can become unstable by various mechanisms. As another example,; gradients in temperature (or physiological properties) can create sporing in a vortex filament that can cause it to elongate and create new filaments upon collision with a boundary [89]. Similar elongation of vortex filaments can be induced by local twist due to fiber rotation [62, 90] or, in the low excitable i limit (due to low oxygen or hypoxia), by negative tension [91].
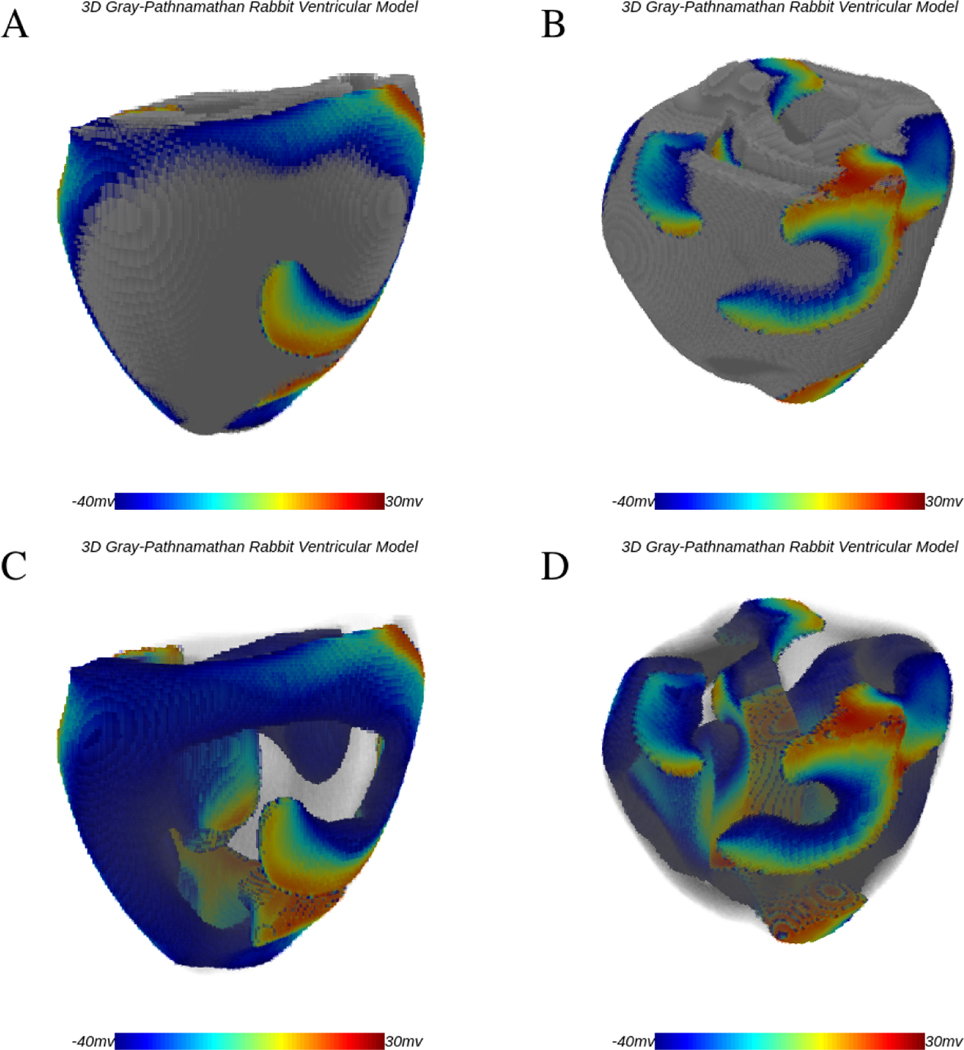
We demonstrate the use of WebGL in simulations of 3D interactive chaotic systems by modeling ventricular fibrillation in rabbit ventricles using the parsimonious three-variable rabbit cardiac cell model of Gray and Pathmanathan [92]. While the model is stable in 2D, it breaks into multiple waves when simulated in the 3D rabbit ventricles. Fig. 16 shows two snapshots of scroll wave breakup at two different times including transparent views of the same episode that allow visualization of the complexity in waves intramurally. The Gray-Pathmanathan model consists of a sodium current and a potassium current as follows.
Figure 16:
Three-dimensional simulation of fibrillation in rabbit ventricles using the Gray-Pathnamathan model. Panels A and B show two different instances of scroll-wave activity on the surface of the ventricular structure. C and D show the same cases with transparency to allow details of the scroll waves within the structure to be seen using Abubu.js.
| (10) |
In here, m and h are gating variables of the Hodgkin-Huxley [52] type that follow a simple formulation of
| (11) |
Here, and are the steady states of the gating variables as a function of voltage and the τs are time constants for each gate defined as below.
| (12) |
In this model, gNa = 11mS/μF, ENa = 65mV, EK = −83mV, Em = −41mV, km = −4mV, Eh = −74.9mV, kh = 4.4mV, = 6.80738ms, δh = 0.799163, gK = 0.3mS/μF, and b = 0.047mV−1.
4. Limitations
We have presented here a methodology to use WebGL to solve interactively and in real time models for complex systems, with examples of fractals, wave dynamics, wave patterns and chaotic dynamics. It is important, however, to mention two current limitations of WebGL. So far only single precision has been implemented in WebGL 1.0 and 2.0; therefore, problems that require double precision may not be adequately solved under this methodology at this time. The second limitation is that WebGL will only run on a single GPU; if multiple GPUs are required for a given application [93–95], other solutions such as NVIDIA CUDA and WebGL could be used together [33].
5. Summary and conclusion
Complexity and nonlinear dynamics have become some of the best tools we have to investigate many processes in nature [96]. For example, they have been very valuable in the study and underestanding of cardiac arrhythmias [97–104]. Simulations of these complex systems can be very daunting, as biological models can sometimes require tens of variables and hundreds of parameters to describe their physiological dynamics. There have been previous efforts to develop software that can be run by computational non-experts to study cardiac and neuronal dynamics [105, 106]; however, they could be used only for relatively simple models. In this paper, we have described a novel use of WebGL and our library Abubu.js to allow fast simulations of complex nonlinear systems such as fractals, which can be studied with seamless instantaneous zooming and panning, and real-time (or near real-time) simulations of solitons and chaotic dynamics for a broad range of time-dependent systems. Along with fast calculations, our approach includes integrated visualization and interactivity, including support for changing parameters on the fly and other interactions with the simulation such as external pacing. In addition, the Abubu.js library greatly simplifies programming for WebGL so that even novice programmers can easily modify existing programs to extend them or code new models.
Our work builds on previous efforts for simple programs with embedded visualization and/or interactivity [105, 107, 108] but is updated to exploit widely available hardware while removing barriers to programming to allow simulation of even large domains and complex models at fast speeds. We have successfully tested the codes presented here on a variety of devices, including desktops under Windows and Linux with GPUs (from NVIDIA GTX-970 and up), 2017 MacBook Pro (with Intel Iris Plus 460 GPU), 2015 MacBook Pro (with AMD Radeon R9 M370X GPU) and Galaxy phones from S7 to S9, using both Chrome and Firefox browsers. On desktops the programs are able to solve up to 40 billion differential equations per second (wall time) and on cell phones up to 1.4 billion. Thus, our implementation greatly extends access to detailed simulations using only moderate graphics cards rather than expensive supercomputers. Accordingly, researchers, students, and the general public should be able to use our programs to study chaos, solitons and fractals in more detail with hardware standard on most desktop computers.
Supplementary Material
Acknowledgments
This work was supported in part by the National Science Foundation under grants CNS-1446312 (E.M.C.) and CNS-1446675 (F.H.F. and A.K.) and by the National Institutes of Health under grant 1R01HL143450-01 (F.H.F., E.M.C., A.K.). F.H.F., E.M.C. and A.K. also collaborated while at Kavli Institute for Theoretical Physics (KITP) and thus research was also supported in part by NSF Grant No. PHY-1748958, NIH Grant No. R25GM067110, and the Gordon and Betty Moore Foundation Grant No. 2919.01. We would like to further extend our gratitude to Ms. Elly Elham Konjkav for her tireless and inspiring moral support from the conception to the finalization of this work.
Footnotes
Publisher's Disclaimer: This is a PDF file of an unedited manuscript that has been accepted for publication. As a service to our customers we are providing this early version of the manuscript. The manuscript will undergo copyediting, typesetting, and review of the resulting proof before it is published in its final citable form. Please note that during the production process errors may be discovered which could affect the content, and all legal disclaimers that apply to the journal pertain.
References
- [1].Mandelbrot B, Les objets fractals: Forme, hasard et dimension (1975). [Google Scholar]
- [2].Gardner M, Scientific American 235, 124 (1976). [Google Scholar]
- [3].Barnsley MF, Fractals everywhere (Academic press, 2014). [Google Scholar]
- [4].Jürgens H, Peitgen H-O, Saupe D, Scientific American 263, 60 (1990). [Google Scholar]
- [5].Ashline GL, Ellis-Monaghan JA, Kadas ZM, McCabe DJ, UMAP/ILAP Modules: Tools for Teaching pp. 101–139 (2009). [Google Scholar]
- [6].Campbell RD, Acta Biotheoretica 44, 119 (1996). [Google Scholar]
- [7].Sánchez JA, Lasker HR, Nepomuceno EG, Sánchez JD, Woldenberg MJ, The American Naturalist 163, E24 (2004). [DOI] [PubMed] [Google Scholar]
- [8].Van Hornweder K, Models and mechanisms of the morphogenesis of biological structures, Tech. rep., Citeseer (2011). [Google Scholar]
- [9].Sahimi M, Reviews of modern physics 65, 1393 (1993). [Google Scholar]
- [10].Hagiwara T, Wang H, Suzuki T, Takai R, Journal of agricultural and food chemistry 50, 3085 (2002). [DOI] [PubMed] [Google Scholar]
- [11].Femia N, Niemeyer L, Tucci V, Journal of Physics D: Applied Physics 26, 619 (1993). [Google Scholar]
- [12].Baryshev YV, Labini FS, Montuori M, Pietronero L, Teerikorpi P, Fractals 6, 231 (1998). [Google Scholar]
- [13].Mandelbrot BB, Van Ness JW, SIAM review 10, 422 (1968). [Google Scholar]
- [14].Devaney RL, Siegel PB, Mallinckrodt AJ, McKay S, Computers in Physics 7,416 (1993). [Google Scholar]
- [15].Lorenz EN, Journal of the atmospheric sciences 20, 130 (1963). [Google Scholar]
- [16].Kuramoto Y, Progress of Theoretical Physics Supplement 64, 346 (1978). [Google Scholar]
- [17].Ausloos M, Dirickx M, The logistic map and the route to chaos: From the beginnings to modern applications (Springer Science & Business Media, 2006). [Google Scholar]
- [18].Gefen Y, Mandelbrot BB, Aharony A, Physical Review Letters 45, 855 (1980). [Google Scholar]
- [19].Gandomi AH, Yang X-S, Talatahari S, Alavi AH, Communications in Nonlinear Science and Numerical Simulation 18, 89 (2013). [Google Scholar]
- [20].Kaboudian A, Cherry E, Fenton F, Science Advances (Accepted). [DOI] [PMC free article] [PubMed] [Google Scholar]
- [21].Owens JD, et al. , Computer Graphics Forum (Wiley Online Library, 2007), vol. 26–1, pp. 80–113. [Google Scholar]
- [22].Owens JD, et al. , Proceedings of the IEEE 96, 879 (2008). [Google Scholar]
- [23].Rost RJ, et al. , OpenGL shading language (Pearson Education, 2009). [Google Scholar]
- [24].Boreskov A, Shikin E, Computer Graphics: From Pixels to Programmable Graphics Hardware (Chapman and Hall/CRC, 2013). [Google Scholar]
- [25].Gunadi SI, Yugopuspito P, 2018 4th International Conference on Science and Technology (ICST) (IEEE, 2018), vol. 1, pp. 1–6. [Google Scholar]
- [26].Scarle S, Computational biology and chemistry 33, 253 (2009). [DOI] [PubMed] [Google Scholar]
- [27].Amorim R, Haase G, Liebmann M, Dos Santos RW, 2009. International Conference on High Performance Computing & Simulation (IEEE, 2009), pp. 22–32. [Google Scholar]
- [28].Oliveira RS, et al. , International Conference on Parallel Processing and Applied Mathematics (Springer, 2011), pp. 111–120. [Google Scholar]
- [29].Wang W, Xu L, Cavazos J, Huang HH, Kay M, PloS one 9, e86484 (2014). [DOI] [PMC free article] [PubMed] [Google Scholar]
- [30].Rose AS, Hildebrand PW, Nucleic acids research 43, W576 (2015). [DOI] [PMC free article] [PubMed] [Google Scholar]
- [31].Yuan S, Chan HS, Hu Z, Trends in biotechnology 35, 559 (2017). [DOI] [PubMed] [Google Scholar]
- [32].Halic T, Ahn W, De S, MMVR (2012), pp. 149–155. [PubMed] [Google Scholar]
- [33].Jiménez J, et al. , Journal of biomedical informatics 51, 176 (2014). [DOI] [PubMed] [Google Scholar]
- [34].Mandelbrot BB, San Francisco, CA: (1982). [Google Scholar]
- [35].Mandelbrot B, Fractals and chaos: the Mandelbrot set and beyond (Springer Science & Business Media, 2013). [Google Scholar]
- [36].Pickover CA, Computer Graphics Forum (Wiley Online Library, 1986), vol. 5, pp. 313–316. [Google Scholar]
- [37].Brooks RW, Matelski P, Riemann surfaces and related topics: Proceedings of the 1978 Stony Brook Conference 97, 65 (1978). [Google Scholar]
- [38].Mandelbrot BB, Annals of the New York Academy of Sciences; 357, 249 (1980). [Google Scholar]
- [39].Douady A, Hubbard JH, Lavaurs P, Université de Paris-Sud, Département de Mathématique (1984). [Google Scholar]
- [40].Julia G, Annales scientifiques de l’École Normale Supérieure (Elsevier, 1922), vol. 39, pp. 131–215. [Google Scholar]
- [41].Mojica NS, Navarro J, Marijuán PC, Lahoz-Beltra R, Biosystems 98, 19 (2009). [DOI] [PubMed] [Google Scholar]
- [42].Levin M, Biosystems 109, 243 (2012). [DOI] [PMC free article] [PubMed] [Google Scholar]
- [43].Gdawiec K, Kotarski W, Lisowska A, J Nonlinear Sci Appl 9, 2305 (2016). [Google Scholar]
- [44].Russell J, Report of the committee on waves. report of the seventh meeting of the british association for the advancement of science, liverpool (murray j (1838). [Google Scholar]
- [45].Russell AJS, Report on waves, report of the 14th meeting of the british association for the advancement of science, 311–390 (1844). [Google Scholar]
- [46].Turing AM, Phil. Trans. R. Soc. Lond. B 237, 37 (1952). [Google Scholar]
- [47].Epstein IR, Pojman JA, An introduction to nonlinear chemical dynamics: oscillations, waves, patterns, and chaos (Oxford University Press, 1998). [Google Scholar]
- [48].Izhikevich EM, FitzHugh R, Scholarpedia 1, 1349 (2006). [Google Scholar]
- [49].Van Der Pol B, Van Der Mark J, The London, Edinburgh, and Dublin Philosophical Magazine and Journal of Science 6, 763 (1928). [Google Scholar]
- [50].FitzHugh R, Biophysical journal 1, 445 (1961). [DOI] [PMC free article] [PubMed] [Google Scholar]
- [51].Nagumo J, Arimoto S, Yoshizawa S, Proceedings of the IRE 50, 2061 (1962). [Google Scholar]
- [52].Hodgkin AL, Huxley AF, The Journal of physiology 117, 500 (1952). [DOI] [PMC free article] [PubMed] [Google Scholar]
- [53].Borckmans P, et al. , International journal of bifurcation and chaos 12, 2307 (2002). [Google Scholar]
- [54].Fenton FH, Cherry EM, Scholarpedia 3, 1868 (2008). [Google Scholar]
- [55].Nolasco J, Dahlen RW, Journal of applied physiology 25, 191 (1968). [DOI] [PubMed] [Google Scholar]
- [56].Guevara M, Ward G, Shrier A, Glass L, IEEE Comp. Cardiol 562, 167 (1984). [Google Scholar]
- [57].Rosenbaum DS, et al. , New England Journal of Medicine 330, 235 (1994). [DOI] [PubMed] [Google Scholar]
- [58].Pastore JM, Girouard SD, Laurita KR, Akar FG, Rosenbaum DS, Circulation 99, 1385 (1999). [DOI] [PubMed] [Google Scholar]
- [59].Uzelac I, et al. , Frontiers in physiology 8, 819 (2017). [DOI] [PMC free article] [PubMed] [Google Scholar]
- [60].Watanabe MA, Fenton FH, Evans SJ, Hastings HM, Karma A, Journal of cardiovascular electrophysiology 12, 196 (2001). [DOI] [PubMed] [Google Scholar]
- [61].Qu Z, Garfinkel A, Chen P-S, Weiss JN, Circulation 102, 1664 (2000). [DOI] [PubMed] [Google Scholar]
- [62].Fenton F, Karma A, Chaos: An Interdisciplinary Journal of Nonlinear Science 8, 20 (1998). [Google Scholar]
- [63].Fenton FH, Cherry EM, Hastings HM, Evans SJ, Chaos: An Interdisciplinary Journal of Nonlinear Science 12, 852 (2002). [DOI] [PubMed] [Google Scholar]
- [64].Speiser D, Williams K, Discovering the Principles of Mechanics 1600–1800: Essays by David Speiser, vol. 1 (Springer Science & Business Media, 2008). [Google Scholar]
- [65].Euler L, Novi commentarii academiae scientiarum Petropolitanae pp. 243–260 (1766). [Google Scholar]
- [66].Gray P, Scott S, Chemical Engineering Science 38, 29 (1983). [Google Scholar]
- [67].Gray P, Scott S, Chemical Engineering Science 39, 1087 (1984). [Google Scholar]
- [68].Liu R, Liaw S, Maini P, Physical review E 74, 011914 (2006). [DOI] [PubMed] [Google Scholar]
- [69].Winfree AT, Chaos: An Interdisciplinary Journal of Nonlinear Science 1, 303 (1991). [Google Scholar]
- [70].Gray RA, Wikswo JP, Otani NF, Chaos: An Interdisciplinary Journal of Nonlinear Science 19, 033118 (2009). [Google Scholar]
- [71].Jahnke W, Winfree AT, International Journal of Bifurcation and Chaos 1, 445 (1991). [Google Scholar]
- [72].Plesser T, Mueller SC, Hess B, Journal of Physical Chemistry 94, 7501 (1990). [Google Scholar]
- [73].Pertsov AM, Davidenko JM, Salomonsz R, Baxter WT, Jalife J, Circulation research 72, 631 (1993). [DOI] [PubMed] [Google Scholar]
- [74].Cherry EM, Fenton FH, New Journal of Physics 10, 125016 (2008). [Google Scholar]
- [75].Frazier DW, et al. , The Journal of clinical investigation 83, 1039 (1989). [DOI] [PMC free article] [PubMed] [Google Scholar]
- [76].Barkley D, Physical Review Letters 72, 164 (1994). [DOI] [PubMed] [Google Scholar]
- [77].Krinsky VI, Efimov IR, Jalife J, Proc. R. Soc. Lond. A 437, 645 (1992). [Google Scholar]
- [78].Hakim V, Karma A, Physical review letters 79, 665 (1997). [DOI] [PubMed] [Google Scholar]
- [79].Hermann S, Gottwald GA, SIAM Journal on Applied Dynamical Systems 9, 536 (2010). [Google Scholar]
- [80].Karma A, Growth and Form (Springer, 1991), pp. 271–283. [Google Scholar]
- [81].Karma A, Chaos: An Interdisciplinary Journal of Nonlinear Science 4, 461 (1994). [Google Scholar]
- [82].Courtemanche M, Chaos: An Interdisciplinary Journal of Nonlinear Science 6, 579 (1996). [Google Scholar]
- [83].Fenton FH, Gizzi A, Cherubini C, Pomella N, Filippi S, Physical Review E 87, 042717 (2013). [DOI] [PubMed] [Google Scholar]
- [84].Filippi S, Gizzi A, Cherubini C, Luther S, Fenton FH, Europace 16, 424 (2014). [DOI] [PMC free article] [PubMed] [Google Scholar]
- [85].Bin-Wen D, Guo-Yong Z, Yong C, Communications in Theoretical Physics 52, 173 (2009). [Google Scholar]
- [86].O’Hara T, Virág L, Varró A, Rudy Y, PLoS computational biology 7, e1002061 (2011). [DOI] [PMC free article] [PubMed] [Google Scholar]
- [87].Dutta S, et al. , Frontiers in Physiology 8, 616 (2017). [DOI] [PMC free article] [PubMed] [Google Scholar]
- [88].Cavero I, Holzgrefe H, Journal of Pharmacological and Toxicological Methods 76, 27 (2015). [DOI] [PubMed] [Google Scholar]
- [89].Henze C, Lugosi E, Winfree A, Canadian Journal of Physics 68, 683 (1990). [Google Scholar]
- [90].Fenton F, Karma A, Physical Review Letters 81, 481 (1998). [Google Scholar]
- [91].Biktashev V, Holden A, Zhang H, Phil. Trans. R. Soc. Lond. A 347, 611 (1994). [Google Scholar]
- [92].Gray RA, Pathmanathan P, PLoS computational biology 12, e1005087 (2016). [DOI] [PMC free article] [PubMed] [Google Scholar]
- [93].Gouvêa de Barros B, Sachetto Oliveira R, Meira W, Lobosco M, Weber dos Santos R, Computational and mathematical methods in medicine 2012. (2012). [DOI] [PMC free article] [PubMed] [Google Scholar]
- [94].Nimmagadda VK, Akoglu A, Hariri S, Moukabary T, The Journal of Supercomputing 59, 1360 (2012). [Google Scholar]
- [95].Neic A, et al. , IEEE Transactions on Biomedical Engineering 59, 2281 (2012). [DOI] [PMC free article] [PubMed] [Google Scholar]
- [96].Strogatz SH, Nonlinear dynamics and chaos: with applications to physics, biology, chemistry, and engineering (CRC Press, 2018). [Google Scholar]
- [97].Goldberger A, Rigney D, Mietus J, Antman E, Greenwald S, Cellular and Molecular Life Sciences 44, 983 (1988). [DOI] [PubMed] [Google Scholar]
- [98].Goldberger AL, Annals of biomedical engineering 18, 195 (1990). [DOI] [PubMed] [Google Scholar]
- [99].Goldberger AL, The Lancet 347, 1312 (1996). [DOI] [PubMed] [Google Scholar]
- [100].Cherry EM, Fenton FH, Gilmour RF Jr, American Journal of Physiology-Heart and Circulatory Physiology 302, H2451 (2012). [DOI] [PMC free article] [PubMed] [Google Scholar]
- [101].Krogh-Madsen T, Christini DJ, Annual review of biomedical engineering 14, 179 (2012). [DOI] [PMC free article] [PubMed] [Google Scholar]
- [102].Shiogai Y, Stefanovska A, McClintock PVE, Physics reports 488, 51 (2010). [DOI] [PMC free article] [PubMed] [Google Scholar]
- [103].Fenton FH, Cherry EM, Glass L, Scholarpedia 3, 1665 (2008). [Google Scholar]
- [104].Glass L, Hunter P, McCulloch A, Theory of heart: biomechanics, biophysics, and nonlinear dynamics of cardiac function (Springer Science & Business Media, 2012). [Google Scholar]
- [105].Fenton FH, Cherry EM, Hastings HM, Evans SJ, Biosystems 64, 73 (2002). [DOI] [PubMed] [Google Scholar]
- [106].Barkley D, available from “https://homepages.warwick.ac.uk/~masax/” (2002).
- [107].Bartocci E, et al. , Proceedings of the 9th International Conference on Computational Methods in Systems Biology (ACM, 2011), pp. 103–112. [Google Scholar]
- [108].Bartocci E, et al. , Advances in physiology education 35, 427 (2011). [DOI] [PubMed] [Google Scholar]
Associated Data
This section collects any data citations, data availability statements, or supplementary materials included in this article.


