

Summary
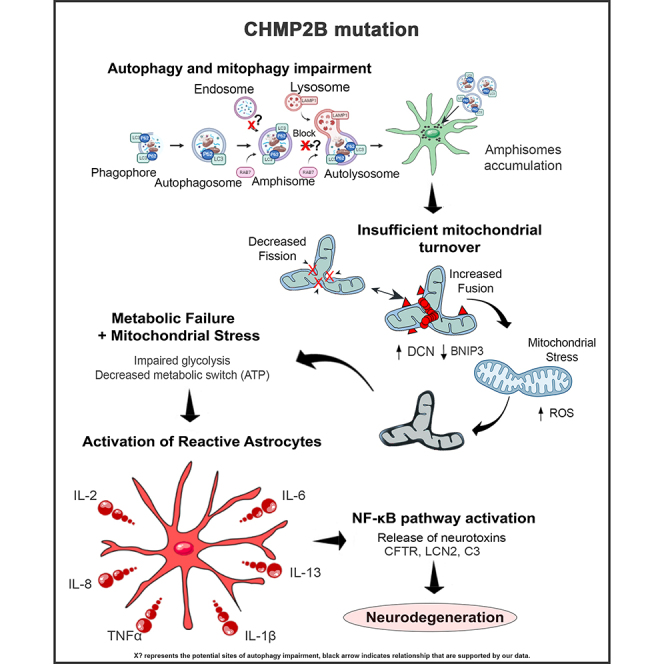
Frontotemporal dementia type 3 (FTD3), caused by a point mutation in the charged multivesicular body protein 2B (CHMP2B), affects mitochondrial ultrastructure and the endolysosomal pathway in neurons. To dissect the astrocyte-specific impact of mutant CHMP2B expression, we generated astrocytes from human induced pluripotent stem cells (hiPSCs) and confirmed our findings in CHMP2B mutant mice. Our data provide mechanistic insights into how defective autophagy causes perturbed mitochondrial dynamics with impaired glycolysis, increased reactive oxygen species, and elongated mitochondrial morphology, indicating increased mitochondrial fusion in FTD3 astrocytes. This shift in astrocyte homeostasis triggers a reactive astrocyte phenotype and increased release of toxic cytokines, which accumulate in nuclear factor kappa b (NF-κB) pathway activation with increased production of CHF, LCN2, and C3 causing neurodegeneration.
Keywords: CHMP2B, FTD3, hiPSC-derived astrocytes, autophagy, mitochondria, cytokines, reactive astrocytes, complement 3, NF-kB
Graphical abstract
Highlights
-
•
FTD3 iPSC-derived astrocytes display impaired autophagy
-
•
Impaired autophagy affects mitochondria turnover, glucose hypometabolism and TCA cycle
-
•
FTD3 astrocytes contribute to reactive gliosis by increased C3, LCN2, IL6, and IL8
-
•
Reactive astrocyte phenotypes are present in both in vitro and in vivo models
Chandrasekaran et al. show the mechanistic insights into how defective autophagy causes perturbed mitochondrial dynamics with impaired glycolysis, increased reactive oxygen species, and elongated mitochondrial morphology in frontotemporal dementia type 3 astrocytes contributing to neurodegeneration.
Introduction
Frontotemporal dementia type 3 (FTD3) is a rare heterozygous early-onset form of frontotemporal dementia (Skibinski et al., 2005). The disease is caused by a single nucleotide substitution in the CHMP2B gene resulting in a C-terminal truncated protein (Lindquist et al., 2008). CHMP2B is a central component of the endosomal-sorting complex required for transport-III (ESCRT-III). The mutation is associated with impairment of the endolysosomal pathway, leading to accumulation of early-stage endosomes, and culminates in neuronal death and gliosis of the surrounding tissue (Urwin et al., 2010; Zhang et al., 2017).
Astrocytes are one of the most abundant non-neuronal cell types of the central nervous system, displaying remarkable heterogeneity both in morphology and function (Azevedo et al., 2009). Previous research has shown that astrocytes participate in numerous functions, such as the formation of neuronal networks, production of neurotrophic factors, recycling of neurotransmitters, and maintenance of homeostasis via detoxification and nutritional distribution (Haim et al., 2015). Glial cell pathology, manifested in astrocyte reactivity, has been reported for Alzheimer disease (AD), Huntington disease, and amyotrophic lateral sclerosis (ALS) (Osborn et al., 2016; Qian et al., 2017).
Autophagy is intracellular degradation of damaged organelles such as mitochondria, protein aggregates, and long-lived proteins for subsequent recycling of usable subunits (Nakamura and Yoshimori, 2017). The autophagy pathway is highly selective and often subdivided based on its engulfed material, such as mitophagy facilitating the breakdown of damaged mitochondria (Ding and Yin, 2012). An important connection between the endolysosomal pathway and autophagy is the fusion between late endosomes and autophagosomes into amphisomes, which further fuse with lysosomes (Jäger et al., 2004). This part of the process is an important feature in FTD3 pathology as impairment of the amphisome formation due to ESCRT-III dysfunction has been demonstrated to result in autophagosome and endosome accumulation (Lee et al., 2007). P62 is a soluble cytosolic protein, incorporating polyubiquitinated cargo into autophagosomes. Several studies have provided evidence that P62 expression is increased in neurodegenerative diseases such as ALS and frontotemporal lobar degeneration (FTLD) (Rea et al., 2014). Our previous findings revealed accumulation of P62 in the S100β-positive glial cell population among human induced pluripotent stem cell (hiPSC)-derived FTD3 neurons (Zhang et al., 2017), which triggered the current investigation of autophagic alterations in FTD3 astrocytes and understanding of the mechanism contributing to FTD3 pathology.
Results
Efficient generation and characterization of hiPSC-derived FTD3 astrocytes
Astrocytes were differentiated from hiPSC lines derived from two related patients with CHMP2B mutation (FTD3 patient 1 and FTD3 patient 2), and their corresponding isogenic control, in which the mutation was corrected via CRISPR/Cas9 gene editing (isogenic control 1 and isogenic control 2, respectively). Additionally, two CRISPR/Cas9 knockin cell lines were generated carrying the same CHMP2B mutation (homozygous and heterozygous; Table S1). All FTD3-hiPSCs and control-hiPSCs were successfully differentiated into astrocytes with comparable efficiencies following a modified version of an established protocol (Shaltouki et al., 2013) (Figure 1A). All astrocyte cultures expressed characteristic astrocyte markers: transcription factor SOX-9 (SOX9), protein S100-B (S100β), and aquaporin-4 (AQP4) validated by immunocytochemistry (ICC) (Figure 1B) at 7 weeks of differentiation. No obvious difference was observed, indicating that the CHMP2B mutation has no effect on the differentiation capacity towards astrocytes. On average, 85% of astrocytes were S100β, AQP4, and SOX9 positive (Figures 1C–1E).
Figure 1.

Generation and characterization of hiPSC-derived astrocytes
(A) Schematic of astrocyte differentiation protocol.
(B) Representative ICC images of AQP4, S100β, and SOX9. Scale bar, 25 μm.
(C–E) Quantifications of AQP4, S100β, and SOX9 expression. Mean ± SEM of three independent experiments. One-way ANOVA with Tukey multiple comparisons test; ∗p < 0.05. See also Figure S1.
FTD3 astrocytes show increased and imbalanced autophagy
Impaired autophagy has been implicated in the pathogenesis of ALS and FTD3 (Edens et al., 2016). Due to their classical functions of delivering autophagic cargo into autophagosomes, P62 and LC3 expression is generally considered to correlate with the level of autophagic degradation. Our results uncovered high ICC expression of both proteins in FTD3 astrocytes compared with controls, indicative of an accumulation of autophagosomes and possible impairment of autophagy (Figures 2A–2C, S2–S4). An increase in the autophagic flux was confirmed via western blot (WB) (Figures 2D and 2E).
Figure 2.

FTD3 astrocytes display autophagy changes
(A) Representative images of LC3B and S100β co-labeling of astrocytes (left column), P62 and RAB7 co-labeling of astrocytes (middle column), and P62 and LAMP1 co-labeling of astrocytes (right column) Scale bar, 25 μm (left column). Scale bar, 10 μm (middle and right column).
(B and C) P62 and LC3B puncta quantification.
(D and E) WB of autophagic flux (ratio of LC3II/I).
(F) TEM images of FTD3-specific accumulation of electron-dense autophagosomes indicated with black arrows. A, autophagosomes; L, autolysosomes. Scale bar, 2 μm.
(G and H) Puncta quantifications of P62 and RAB7 colocalization.
(I and J) Puncta quantifications of P62 and LAMP1 colocalization.
(K and L) WB of LAMP1.
(M–Q) Validation of CHMP2Bintron5 mice versus control mice brain for autophagy via qPCR (M) and WB (N–Q). Mean ± SEM of three independent experiments. One-way ANOVA with Tukey multiple comparisons test; ∗p < 0.05, ∗∗p < 0.01, ∗∗∗p < 0.001, and ∗∗∗∗p < 0.0001. See also Figures S2–S4.
To further visualize the changes in autophagy, we performed transmission electron microscopy (TEM). TEM analyses of FTD3 astrocytes displayed double-membraned autophagosomes with increased electron-dense content of engulfed cellular components and organelles, indicating accumulation of un-processed material, reflecting a possible impaired amphisome formation and/or lysosomal fusion. In contrast, isogenic control lines presented electron-lucent autophagosomes, potentially representing early autophagosomes and secondary lysosomes (Figures 2F and S4). Consequently, we investigated if this impairment of autophagy-mediated clearance is caused by the inability to transport autophagosomes to the lysosomes, as seen with endosomes in FTD3 neurons (Urwin et al., 2010). Co-labeling for P62 and RAB7 (Figure 2A, middle column) revealed an increase in colocalization in FTD3 astrocytes compared with controls (Figures 2G and 2H), which suggests that RAB7-mediated transport of autophagosomes is increased but not impaired in FTD3 astrocytes. To further examine the autophagosome-lysosome fusion process, we performed ICC for P62 and lysosomal associated membrane protein 1 (LAMP1) (Figure 2A, right column). Puncta quantifications revealed a specific increase in LAMP1 colocalization with P62 in FTD3 astrocytes, indicating an increased formation of autolysosomes in the mutated astrocytes (Figures 2I and 2J) (Pugsley, 2017), further validated by WB (Figures 2K and 2L). To further substantiate the autophagy abnormalities in human FTD3 astrocytes, we analyzed autophagy-related genes in brains obtained from a transgenic mouse model overexpressing human CHMP2B Intron5 mutation (CHMP2Bintron5 mice). The results showed an increase in the expression of autophagy genes p62, Rab7, and Lamp1 in CHMP2B intron5 mice via qPCR and WB (Figures 2M–2Q), resembling he increased autophagy activity in iPSC-derived astrocytes.
Since no obvious impairments were found in the transport and fusion of autophagosomes with lysosomes, we treated the astrocytes with two different concentrations (200 nM and 500 nM) of rapamycin, a potent inducer of autophagy, in order to further activate and promote the clearance of autophagosomes in the FTD3 astrocytes. Overall, this attempt was unsuccessful, as it changed the abundance of neither the P62 and LC3B punctae (Figures S2–S4) nor the RAB7-mediated transport and LAMP1-mediated lysosomal fusion, which suggests that autophagy is impaired in one or more unidentified steps of the process. Only in the homozygous line did we observe a reduction in the number of P62, RAB7, and LAMP1 punctae as well as the colocalization of P62 and LAMP1. The 200 nM treatment did also lower LC3B in FTD3 patient 1 compared with its control; however, we did not observe this in the other FTD3 lines. In order to further investigate if mitophagy impairments are causing the autophagosome accumulations, we performed ICC using TOM20 (mitochondrial marker) and LAMP1. We found that FTD3 lines promoted mitochondria-LAMP1 colocalization, indicating an upregulation in the mitophagic turnover of mitochondria (Figures S4A–S4C).
FTD3 astrocytes display impaired mitochondrial dynamics and function
Next we investigated if the autophagic defects in our FTD3 astrocytes lead to accumulation of dysfunctional mitochondria and enhanced production of reactive oxidative species (ROS) linked to hampered respiratory function. Assessment of ROS revealed increased levels of oxidative stress in FTD3 astrocytes, substantiating that mitochondria function and turnover are affected (Figure 3A). Prompted by our observations of increased ROS, we tested the mitochondrial function by assessing their basal respiration rate and ATP-linked respiration. Our real-time bioenergetics analyses uncovered a reduced basal and maximal respiration as well as decreased oxygen consumption linked to ATP production in the FTD3 astrocytes compared with controls (Figure 3B). Furthermore, our RNA sequencing (RNA-seq) analyses revealed altered expression levels of genes related to oxidative stress in FTD3 astrocytes (Table S2). For instance Thioredoxin Reductase 2 (TXNRD2), known to scavenge ROS in mitochondria (Lu and Holmgren, 2012), was downregulated in FTD3 astrocytes. This is in agreement with a recent study reporting that TXNRD2 deficiency causes increased ROS levels, affecting the oxidative phosphorylation system, and results in reduced ATP availability (Holzerova et al., 2016). Similarly, Mitogen-Activated Protein Kinase 9 (MAP3K9), an essential component of the MAP kinase signal transduction pathway, was downregulated in FTD3 astrocytes. Next, we investigated whether mitochondria dysfunction and increased oxidative stress affect cell viability. WB analysis for cleaved caspase 3 (CASP3), did not reveal increased apoptotic activity in FTD3 astrocytes (Figure 3C). Even though astrocyte survival is not affected at this point, our data indicate an impairment of handling oxidative stress in FTD3 astrocytes. Oxidative stress has been linked to the formation of stress granules (SGs), and a key component of stress granules is the prion-related RNA-binding protein, T cell intracellular antigen-1 (TIA-1), which was examined via ICC. Indeed, the number of SGs was increased and more scattered in FTD3 astrocytes compared with controls, indicating increased SG formation as a direct result of impaired autophagy (Silva et al., 2019) (Figures 3D and 3E).
Figure 3.

FTD3 astrocytes display impaired mitochondrial dynamics
(A) ROS intensity analyzed via fluorescence-activated cell sorting (FACS) and rescue of mitochondrial ROS by treatment with 50 nM UDCA for 24 h.
(B) Mitochondrial function profile.
(C) WB of caspase 3 activity, GAPDH as control.
(D and E) Representative T1A1 labeling and quantification. Scale bar, 25 μm.
(F) Representative mitochondrial distribution. Scale bar, 25 μm.
(G) Running average length of mitochondria.
(H) Qualitative analysis of mitochondria visualized with TEM. Mitochondria are marked by black arrows. Scale bar, 1 μm.
(I) RNA-seq validated by qPCR.
(J and K) qPCR of fission and fusion genes.
(L) Top 20 differentially expressed genes associated with mitochondria. Data are reported as mean ± SEM of three independent experiments. Statistics for RNA-seq, Benjamin-Hochberg adjusted p value (Wald test) ≤ 0.05, absolute log2 fold change ≥ 1, and mean of normalized counts ≥ 10; qPCR, unpaired Student’s t test, and other analyses one-way ANOVA with Tukey multiple comparisons test, ∗p < 0.05, ∗∗p < 0.01, and ∗∗∗p < 0.001. See also Figures S1, S4, Tables S2, and S3.
Mitochondrial dynamics in astrocytes are far less studied compared with neurons but could play an important role in the FTD3 disease mechanism. We examined mitochondrial networks using MitoTracker Red CMXRos followed by high-resolution morphology studies via TEM. MitoTracker experiments revealed that FTD3 astrocytes display an interconnected meshwork of elongated mitochondria compared with their controls, indicative of decreased fission and increased fusion (Figures 3F and 3G). Our TEM results confirmed excessively elongated mitochondria in FTD3 astrocytes (Figure 3H). TEM quantitative analysis revealed a reduction in relative mitochondria to cytoplasm area ratio in FTD3 patient 1 and heterozygous induced astrocytes (Figure S4G). The same tendency was observed in FTD3 patient 2 and homozygous induced astrocytes indicating a reduction in total mitochondria number correlating with the observation of increased fusion and reduced fission. Furthermore, a significant increase in relative individual mitochondria area was observed in FTD3 patient 1, possibly due to increased fusion and mitochondria elongation (Figure S4F).
Strikingly, RNA-seq analysis revealed differential expression of genes functionally linked to mitochondrial fission/fusion processes (Table S2). Dynamin 3 (DNM3), a member of the dynamin superfamily, was upregulated in FTD3 astrocytes (validated by qPCR; Figure 3I). The dynamin-related GTPase DNM3 controls mitochondrial morphology by recruiting dynamin-related protein 1 (DRP1), and mutation in DNM3 interferes with the mitochondria morphology (Fonseca et al., 2019). In addition, BCL2 Interacting Protein 3 (BNIP3), a regulator of mitochondrial fission/fusion dynamics (Autret and Martin, 2010), was reduced in FTD3 patient astrocytes (Table S2). Furthermore, expression of the kinase insert domain receptor (KDR), whose silencing was shown to increase the mitochondrial membrane permeability (Zhang et al., 2014), was reduced (Table S2) in FTD3 astrocytes, further supporting unbalanced fission-fusion events.
Next we investigated if key regulators of mitochondrial fission and fusion processes are affected. In accordance with the observed mitochondria elongation phenotype, we observed increased optic atrophy 1 (OPA1) and mitofusin 1 (MFN1) expression levels in FTD3 patient astrocytes and CHMP2Bintron5 mice brains (Yu et al., 2020). A similar trend in the expression level changes of fission protein 1 (FIS1) was observed in both FTD3 patient astrocytes and in CHMP2Bintron5 mice brain (Figures 3J and 3K), which has been seen to cause mitochondrial elongation (Yoon et al., 2003). The evidence of mitochondria dysfunction is further supported by our RNA-seq data showing downregulation of additional mitochondrial-related genes in FTD3 astrocytes (Figure 3L; Table S2). Ursodeoxycholic acid (UDCA) has been proved to rescue apoptotic cascades downstream of autophagic and endosomal perturbations in CHMP2BIntron5 expressing Drosophila (West et al., 2020). In addition, it has proved to rescue mitochondrial defects in parkin-deficient neurons in iPSC-derived models (Mortiboys et al., 2013). Treatment with 50 nM UDCA was sufficient to reduce ROS in FTD3 astrocytes compared with controls (Figure 3A). However, there was no effect of UDCA on mitochondrial respiration or on ATP coupled respiration (data not shown). Collectively, our results suggest that the impaired mitochondrial function and antioxidant capacity of FTD3 astrocytes contribute to both metabolic and oxidative stress.
FTD3 astrocytes display glucose and acetate hypometabolism
The observed functional impairments of mitochondria in FTD3 astrocytes led us to investigate whether these cause metabolic deficiencies. Glucose and acetate oxidative metabolism is closely linked to mitochondria function via the tricarboxylic acid (TCA) cycle, which provides high-energy intermediates for the electron transport chain (ETC) leading to ATP production (McKenna et al., 2012). To provide detailed insights into relevant pathways of glucose and acetate metabolism, we used 13C-labeled energy substrates and mass spectrometry (GC-MS) analysis to quantify 13C incorporation in cellular metabolites. Figures 4A–4F shows the percentage distribution of 13C labeling in fully labeled (M+3) lactate and alanine arising from direct metabolism of [U-13C] glucose (2.5 mM). We observed a decrease in labeled lactate and alanine in FTD3 astrocytes compared with controls. However, the difference in labeled alanine found in FTD3 patient 2 did not reach statistical significance compared with isogenic control 2 (Figure 4E). Interestingly, the 13C labeling of most of the amino acids and metabolites, except for glutamate (FTD3 patient 1; Figure 4G), obtained from a first turn of the TCA cycle in FTD3 astrocytes was lower than their controls, suggesting an overall decreased TCA cycle activity in FTD3 astrocytes (Figures 4G–4I). In line with our observation, RNA-seq revealed that numerous genes related to TCA and ETC are downregulated in FTD3 astrocytes (Table S2, Figure 4M). Specifically, genes of the mitochondrial NADH-ubiquinone oxidoreductase chain family (MT-ND1, MT-ND2, and MT-ND3) and mitochondrial encoded cytochrome C oxidases (MT-CO2 and MT-CO3), which are implicated in oxidative phosphorylation, were downregulated. This indicates an impaired glucose metabolism resulting in decreased ATP synthesis, which is in line with our observation of hampered mitochondrial respiration.
Figure 4.

Energy hypometabolism in FTD3 astrocytes
(A–I) Glucose metabolism: 13C enrichment in metabolites was determined via GC-MS after 90-min incubation with [U-13C] glucose
(J–I) Acetate metabolism.
(M) Networks of downregulated genes involved in energy-production pathways. Node colors represent expression fold changes in a blue-white-red logarithmic scale. Mean ± SEM of three independent experiments. Two-way ANOVA with Tukey multiple comparisons test; ∗p < 0.05, ∗∗p < 0.01. See also Figures S1, S5, Tables S2, and S3.
Next, astrocytes were incubated in medium containing [1, 2-13C] acetate (2.5 mM) and unlabeled glucose (2.5 mM). In astrocytes, [1, 2-13C] acetate (M+2) enters the TCA cycle as acetyl coenzyme A, which in a first turn of the TCA cycle condenses with oxaloacetate to form double-labeled citrate (M+2). This TCA cycle intermediate is further metabolized, giving rise to α-ketoglutarate, fumarate, and malate (M+2). Aspartate (M+2) is formed from oxaloacetate (M+2). All metabolites evaluated were decreased in FTD3 astrocytes compared with respective controls (Figures 4J–4L), which supports the observed energy hypometabolism. Reduced expression of MT-ND genes could explain the observed dysfunction of mitochondrial respiratory chain with subsequent reduced ATP production (Zhao et al., 2011). In addition, we found mitochondrial uncoupling protein 2 and 3 (UCP2 and UCP3) genes, which code for transporter proteins that create proton leaks across the inner mitochondrial membrane, to be downregulated in FTD3 astrocytes. Astrocytes take up and process most of synaptic glutamate (Danbolt, 2001). We have recently shown that FTD3 astrocytes displayed increased glutamate uptake and metabolism (Aldana et al., 2020). Here, we observed a slight increase in the labeling in lactate in the FTD3 astrocytes when incubated with [U-13C] glutamate and unlabeled glucose (Figures S5A–S5C), possibly reflecting the increased glutamate metabolism. Collectively, these results indicate decreased glucose and acetate metabolism associated with decreased TCA cycle activity in FTD3 astrocytes.
FTD3 astrocytes demonstrate increased reactivity
The homeostatic changes in FTD3 astrocytes could trigger conversion of resting astrocytes to reactive astrocytes contributing to the observed neurodegeneration and gliosis in FTD3 patients (Radford et al., 2015). To investigate astrocyte reactivity, we performed ICC using neutrophil gelatinase-associated lipocalin (LCN2) and glial fibrillary acidic protein (GFAP) as markers for reactive astrocytes (Lee et al., 2009b; Liddelow et al., 2017). Image analyses via puncta quantifications revealed an increase in LCN2 and GFAP expression in FTD3 patients’ astrocytes compared with their controls, indicating increased numbers of reactive astrocytes (Figures 5A–5C). Surprisingly, GFAP expression was not increased in introduced mutation lines, contrary to the presence of all other disease phenotypes. Consistent with this, RNA-seq with FTD3 patient lines revealed upregulation of mitogen-activated protein kinase 1 (MAP3K1) in FTD3 astrocytes (Table S2). MAP3K1 is an inhibitor of nuclear factor kappa b kinase subunit beta (IKBKB), triggering phosphorylation and activation of nuclear factor kappa b (NF-κB) (Xia et al., 1998), which regulates genes implicated in immune responses (Lee et al., 1998). Supporting the transcriptome profile, the presence of phosphorylated NF-κB was validated by WB (Figures 5D and 5E). Even more intriguing, we found an upregulation of complement C3 (C3), fibulin 5 (FBLN5) and serpin family G member 1 (SERPING1) in FTD3 astrocytes (Table S2) via RNA-seq analysis. C3 and SERPING1 are regulators of the complement system, important for the innate immune response, and mutations in these genes have been implicated to induce toxic reactive astrocyte phenotypes in neurological diseases (Fraczek et al., 2011). To validate the RNA-seq expression changes on a protein level, we analyzed astrocyte reactivity via WB. Our results revealed increased protein expression of C3 in FTD3 astrocytes compared with their controls (Figures 5F and 5G). Additionally, we performed WB (Figures 5H–5K) and qPCR analysis (Figure 5L) of CHMP2Bintron5 mice brains, revealing robust increase of C3 and Lcn2 and thereby confirming the astroglial phenotypes both in vivo and in vitro.
Figure 5.

FTD3 pathology contributes to reactive astrocyte
(A) Representative images of LCN2 and S100 β co-labeling of astrocytes (left column) and GFAP labeling of astrocytes (right column). Scale bar, 25 μm.
(B) LCN2 puncta quantification.
(C) GFAP quantification.
(D and E) WB of NF-κB and phosphorylated-NF-κB (pNF-κB).
(F and G) WB of C3 (human).
(H and I) WB of C3 for CHMP2Bintron5 mice brain.
(J and K) WB of GFAP (mouse).
(L) Validation of CHMP2Bintron5 mice brain for reactive astrocytes.
(M–O) Cytokine profiling.
(P) Top 20 differentially expressed genes associated with lysosomes (left) and endosomes (right).
(Q) Representative image of neurite outgrowth.
(R) Neurite outgrowth quantification. Mean ± SEM of three independent experiments. One-way ANOVA with Tukey multiple comparisons test; ∗p < 0.05, ∗∗p < 0.01, ∗∗∗p < 0.001, and ∗∗∗∗p < 0.0001. See also Figures S1, S5, Tables S2, and S3.
Cytokine secretion triggers reactive astrocytes to further secrete cytokines through an autoregulative loop
Cytokines are considered to be effectors of reactivity (Heneka et al., 2015). Specific cytokines such as interleukin (IL) 1 alpha, tumor necrosis factor alpha (TNFα), and complement component 1q subcomponent (C1q) are capable of inducing a reactive phenotype in astrocytes (Liddelow et al., 2017). Comparative analyses of secreted cytokines revealed that FTD3 astrocytes secreted higher levels of inflammatory-related proteins IL-6, IL-8, IL-13, TNFα, and IL-2 compared with controls (Figures 5M–5O and S5D–S5F). Likewise, we observed a similar pattern of expression for IL-6 via qPCR in CHMP2Bintron5 mice brains demonstrating a coordinated immune response (Figure 5L). Additionally, RNA-seq showed enrichment of differentially expressed genes involved in inflammatory response (Gene Ontology [GO]: 0006954) in the FTD3 astrocytes (Table S3). A number of these genes are engaged in the NF-κB and TNF signaling pathways (KEGG hsa04064 and hsa04668), such as Vascular Cell Adhesion Molecule 1 (VCAM1), CD40 molecule (CD40), Lymphocyte Antigen 96 (LY96), Phosphatidylinositol-4,5-Bisphosphate 3-Kinase Catalytic Subunit Delta (PIK3CD), C-X-C Motif Chemokine Ligand 5 (CXCL5) and IL-6. These data suggest an increased inflammatory response in the FTD3 astrocytes similar to reports in ALS (Chen et al., 2019). Functional and pathway enrichment analysis highlighted cytokine activity and cytokine-cytokine receptor interaction within the most enriched terms (Figures S1C and S1D). Most notably, apolipoprotein D (APOD) was found to be upregulated in the FTD3 astrocytes (Table S2). This gene is shown to be upregulated in aging and degenerative brains (Dassati et al., 2014). Furthermore, we observed an upregulation of IL-17D (Table S2), a cytokine reported to increase the expression of IL-8 in an NF-κB-dependent manner (Starnes et al., 2002), while Signal Regulatory Protein Alpha (SIRP-α), reported as a negative regulator of cytokine production involved in inflammatory response (GO: 1900016) was downregulated. We further observed an upregulation of proteoglycans (PGs) such as biglycan (BGN), Syndecan 2 (SDC2), aggrecan (ACAN), and lumican (LUM) (Figure 5P). PGs participate in neuroinflammation and were previously linked to neurodegenerative diseases (Heindryckx and Li, 2018). Of particular interest is the upregulation of SDC2, as SDC2 is known to control a large number of cytokines through proteoglycan-mediated inflammatory responses (Gopal, 2020). In addition, we observed a strong decrease in the expression of the cystic fibrosis transmembrane conductance regulator (CFTR) in FTD3 astrocytes (Figure 5P). Mutation in this gene leads to impaired immune cell functions and exaggerated pro-inflammatory responses in AD (Lahousse et al., 2003), while knockdown causes an increase in basal secretion of IL-8 as well as IL-1β-induced secretion of IL-6 and IL-8 (Crites et al., 2015). Collectively, our findings indicate that conversion of resting astrocytes to reactive astrocytes via NF-κB activation leads to increased pro-inflammatory cytokine release, which triggers an autoregulatory loop reinforcing the toxic reactive astrocyte phenotype and further enhances cytokine production.
Reactive astrocyte media inhibit axonal outgrowth
Previous research has demonstrated that secreted factors from reactive astrocytes impair neurite outgrowth (Sofroniew, 2015). To investigate this toxic effect, we cultured healthy neurons with astrocyte conditioned medium (ACM) from FTD3 and control astrocytes. A decrease in neurite length was observed in neurons cultured with FTD3 ACM compared with control ACM (Figures 5Q and 5R), demonstrating the inhibiting impact on neuronal outgrowth via secreted factors from FTD3 astrocytes. Moreover, we analyzed the expression levels of genes associated with the positive and negative regulation of the glial cell apoptotic process (according to GO: 0034352 and GO: 0034351) via RNA-seq analysis. We observe upregulation of A-Kinase Anchoring Protein 12 (AKAP12) and downregulation of Growth Arrest Specific 6 (GAS6) in FTD3 astrocytes (Table S2). AKAP12 is involved in oligodendrocyte apoptosis and in the production of TNF-α as well as nitric oxide in astrocytes with inflammatory stimulation (Li et al., 2010). GAS6 promotes cell survival in the brain (Axelrod and Pienta, 2014). These results further underline the overall toxic effect of astrocytes in FTD3 patients reflected in the pathology of cortical neurodegeneration.
Discussion
A previous study reports that excess accumulation of autophagosomes has a negative impact on neuronal survival, and dysfunctional ESCRT-III appears to cause neurodegeneration through numerous mechanisms (Lee et al., 2009a). However, the involvement of autophagy in astrocytes is largely unknown. In this study, we report that astrocytes generated from FTD3 patient hiPSCs, or with introduced CHMP2B mutation, display autophagy impairments with autophagosome accumulation. The ICC and WB results, together with the accumulation of cargo-filled vesicles visualized with TEM, are reliable indications that the autophagy process is impaired and that FTD3 astrocytes are unsuccessfully attempting to accommodate the degradation of a large amount of intracellular material. These results were confirmed in the CHMP2Bintron5 mice model (Krasniak and Ahmad, 2016). Despite the increase in autophagic flux and our attempt to promote autophagic clearance of accumulated autophagosomes with rapamycin, we did not see a reduction in autophagosomes. This suggests that one or several steps in the autophagic process is affected in FTD3 astrocytes. Our investigation of RAB7-mediated transport, which is affected in FTD3 neurons (Urwin et al., 2010), did not show a similar phenotype, and neither did our investigation of the autophagosome-lysosomal fusion; however, this does not exclude the possibility of faulty transport and fusion involvements.
Defective recycling of organelles is the earliest impairment event, which clearly links autophagy to mitochondria turnover (Xie et al., 2015). Abnormal mitochondrial function and aberrant morphology were previously reported by our group in hiPSC-derived FTD3 neurons (Zhang et al., 2017). Consistent with this, we here present mitochondrial dysfunctions with hypometabolism, increased mitochondrial fusion, and release of ROS as central components of FTD3 astrocyte pathology. We could indeed rescue mitochondrial ROS levels in FTD3 astrocytes via UDCA; however, we did not see an effect on other mitochondrial phenotypes.
Increased mitochondrial fusion is an important mechanism in metabolically active cells in order to provide a mitochondrial network that can sustain and accommodate the need for large amount of energy (Krasniak and Ahmad, 2016). In quiescent cells, where the energy demand is less, the mitochondria often appear smaller and spherical due to increased fission activity (Westermann, 2010). Since the FTD3 astrocytes demonstrate hypometabolism with decreased glycolysis and TCA cycle activity, we propose an increased fusion of functional and damaged mitochondria as a regulatory mitochondrial attempt to accommodate the energy demand in the cells. This could explain the increased and elongated network of mitochondria evident in the FTD3 astrocytes. The upregulation of the lactate labeling after incubation with [U-13C] glutamate, which supports an increased incorporation of the carbon skeleton of glutamate into lactate possibly via malic enzyme (McKenna et al., 1995), might also be a compensatory mechanism against the hypometabolism.
It has been reported that oxidative stress induces autophagy impairments, driving the accumulation of dysfunctional mitochondria (Luo et al., 2013). Similarly, we showed that oxidative stress causes defects in the autophagy-mitophagy pathway, as it directly connects cellular clearance mechanisms with mitochondrial function. We suggest that autophagy imbalances are causing an accumulation of dysfunctional mitochondria further prompting the hypometabolism (graphical abstract).
A subtype of reactive astrocytes can be toxic to neurons by promoting the loss of beneficial astrocytic properties such as neural outgrowth and synaptogenesis, thereby resulting in neuronal cell death (Escartin et al., 2021). In the toxic subtype of reactive astrocytes, our study reveals that FTD3 astrocytes upregulate characteristic genes such as SERPING1 and FBLN5. Astrocyte expressing SERPING1 may lead to recruitment of large numbers of T lymphocytes, exacerbating neuroinflammation via complement cascade in the brain (Hennessy et al., 2015). Glial cell reactivity is increasingly connected to neurodegenerative diseases (Liddelow and Barres, 2017); especially in AD, an upregulation of astrocytic pro-inflammatory cytokines such as TNFα and IL-1β has been shown to cause astrocyte reactivity (Oksanen et al., 2017). Likewise in ALS, increased levels of TGF-β1, produced by SOD1 G93A reactive astrocytes, induces cytoplasmic aggregation and impaired autophagy (Tripathi et al., 2017). Here, we showed that mutations in CHMP2B causing FTD3 contribute to astrocyte reactivity by upregulation of LCN2 and GFAP. Supporting our findings, studies suggest that increased levels of LCN2 were detected in the cerebrospinal fluid of patients with AD and in the frontal cortex of patients with FTLD, correlating with reactive astrocyte pathology (Bi et al., 2013). In accordance, we observed an increase in the pro-inflammatory cytokine secretion from FTD3 astrocytes. The results are consistent with previous findings where increases in IL-6 and IL-8 in the brain tissues were associated with poor cognitive performance (Jabbari Azad et al., 2014). It should be noted that these cytokines, when secreted by activated microglia, could induce the formation of reactive astrocytes (Cregg et al., 2014); However, due to the absence of microglia in our cultures, we hypothesize that an autoregulatory cytokine loop drives the reactive astrocytes phenotype in FTD3 astrocytes through NF-κB activation. Finally, we investigated the presence of astrocyte reactivity in CHMP2Bintron5mice brains, where our findings revealed complement protein C3 as an astroglial target of NFκB to be upregulated (Lian et al., 2015).
In summary, our findings show that FTD3 astrocytes have perturbed autophagy with accumulation of amphisomes. This autophagy impairment leads to insufficient mitochondrial turnover with increased fusion and elongated mitochondrial morphology. This kind of mitochondrial fusion mechanism is needed to accommodate the energy demands. Eventually, this continued dysfunction in combination with an increase in ROS results in metabolic failure causing the profound hypometabolism found in FTD3 astrocytes. These cascades of events ultimately cause a shift in astrocyte homeostasis resulting in a switch to a reactive astrocyte phenotype with subsequent increased release of neurotoxic cytokines, leading to NF-κB pathway activation with increased production of GFAP, LCN2, and C3. Finally, we were able to validate the reactive astrocyte phenotype both in vivo and in vitro. Our data provide mechanistic insights into how defective autophagy causes altered mitochondrial dynamics, leading to the adoption of reactive astrocyte properties with increased cytokine release, NF-κB activation, and expression of neurotoxic proteins, indicating how astrocytes contribute to neurodegeneration in FTD3.
Experimental procedures
See supplemental information for detailed descriptions of the methods.
Cell culture, iPSC generation, and astrocyte differentiation
All hiPSC lines used in this study were characterized and published earlier in Rasmussen et al. (2014) and Zhang et al. (2017). Astrocytes differentiation followed a modified protocol (Shaltouki et al., 2013).
WB, ICC, TEM, and qPCR
WB, ICC, TEM, and qPCR methods are described in the supplemental information. See also Table S4.
Metabolomics
Cell extracts were lyophilized and reconstituted in water for Pierce BCA assay and metabolites were mapped using a gas chromatograph (Agilent Technologies 7820A chromatograph, J&W GC column HP-5MS, part no. 19091S-433) coupled to a mass spectrometer (Agilent Technologies, 5977E). Data are presented as labeling (%) of M + X, where M is the mass of the unlabeled molecule and X is the number of labeled C atoms in a given metabolite.
Multiplex array
Cytokine measurements were made using the Meso Scale Discovery, K15067L-1. The commercial human-specific U-PLEX Biomarker Group 1 was used. Samples were measured according to manufactures protocol.
Statistical analysis
For all experiments, data are presented as mean ± standard errors of the mean (SEM) of three independent experiments. Statistical analysis were made in GraphPad Prism 7.03. Statistical analyses were determined using Student's t test or by one-way ANOVA with a Tukey's post test or by two-way ANOVA with Bonferroni post hoc test for differences of mean between each groups. Statistical significance are labeled in the figures as ∗p < 0.05, ∗∗p < 0.01, ∗∗∗p < 0.001, ∗∗∗∗p < 0.0001.
Data and code availability
The datasets used and analyzed during this study are available in the source data file. The dataset generated for RNA-seq has been deposited in the NCBI GEO database under the accession number GEO: GSE141388.
Author contributions
A.C. and K.K.F. performed experimental design. A.C. generated hiPSC-derived astrocytes. A.C. and K.S.D performed most of the experiments. B.I.A. and C.A. performed metabolic profiling. A.C., K.S.D., and K.K.F. interpreted the results and wrote the manuscript. G.I.C. and N.T.D. analyzed RNA-seq data and made gene network analysis under supervision of J.G. A.C. and S.A. were involved in the analyses of RNA-seq data. S.C. helped in data analysis of the qPCR experiment. M.P. prepared samples for TEM. H.H. analyzed TEM samples. S.I.S. and M.M. performed cytokine assays. J.K., P.H., and A.D. edited and approved the paper. All authors read and approved the final version of the paper.
Conflicts of interest
The authors declare no competing interests.
Acknowledgments
We are grateful to Dr. Adrian M. Isaacs for providing CHMP2Bintron5 and control mouse brain samples. The authors are grateful to Philip Seymour for proof reading the paper. We thank Amelia M Hall for her help with TEM analysis. This work was supported by awards from Independent Research Fund Denmark (FTP, grant no. 109799) (K.K.F.), Innovation Fund Denmark (BrainStem, 4108-00008B and NeuroStem, 4096-00001B) (K.K.F.), Alzheimer Foundation Denmark (K.K.F.), Novo Nordisk Foundation (GliAD—NNF18OC0052369 and NNF19OC0058399) ( K.K.F.). A.D. was supported by EUH2020 JPCO-Fund call for Personalized Medicine JPND2019-466-037/2019-2.1.7-ERA-NET-2020-00007 (ADAIR).
Published: October 21, 2021
Footnotes
Supplemental information can be found online at https://doi.org/10.1016/j.stemcr.2021.09.013.
Supplemental information
References
- Aldana B.I., Zhang Y., Jensen P., Chandrasekaran A., Christensen S.K., Nielsen T.T., Nielsen J.E., Hyttel P., Larsen M.R., Waagepetersen H.S., et al. Glutamate-glutamine homeostasis is perturbed in neurons and astrocytes derived from patient iPSC models of frontotemporal dementia. Mol. Brain. 2020;13:1–17. doi: 10.1186/s13041-020-00658-6. [DOI] [PMC free article] [PubMed] [Google Scholar]
- Autret A., Martin S.J. Bcl-2 family proteins and mitochondrial fission/fusion dynamics. Cell. Mol. Life Sci. 2010;67:1599–1606. doi: 10.1007/s00018-010-0286-x. [DOI] [PMC free article] [PubMed] [Google Scholar]
- Axelrod H., Pienta K.J. Axl as a mediator of cellular growth and survival. Oncotarget. 2014;5:8818–8852. doi: 10.18632/oncotarget.2422. [DOI] [PMC free article] [PubMed] [Google Scholar]
- Azevedo F.A.C., Carvalho L.R.B., Grinberg L.T., Farfel J.M., Ferretti R.E.L., Leite R.E.P., Filho W.J., Lent R., Herculano-Houzel S. Equal numbers of neuronal and nonneuronal cells make the human brain an isometrically scaled-up primate brain. J. Comp. Neurol. 2009;513:532–541. doi: 10.1002/cne.21974. [DOI] [PubMed] [Google Scholar]
- Bi F., Huang C., Tong J., Qiu G., Huang B., Wu Q., Li F., Xu Z., Bowser R., Xia X.G., et al. Reactive astrocytes secrete lcn2 to promote neuron death. Proc. Natl. Acad. Sci. U S A. 2013;110:4069–4074. doi: 10.1073/pnas.1218497110. [DOI] [PMC free article] [PubMed] [Google Scholar]
- Chen Y., Xia K., Chen L., Fan D. Increased interleukin-6 levels in the astrocyte-derived exosomes of sporadic amyotrophic lateral sclerosis patients. Front. Neurosci. 2019;13:574. doi: 10.3389/fnins.2019.00574. [DOI] [PMC free article] [PubMed] [Google Scholar]
- Cregg J.M., DePaul M.A., Filous A.R., Lang B.T., Tran A., Silver J. Functional regeneration beyond the glial scar. Exp. Neurol. 2014;253:197–207. doi: 10.1016/j.expneurol.2013.12.024. [DOI] [PMC free article] [PubMed] [Google Scholar]
- Crites K.S.M., Morin G., Orlando V., Patey N., Cantin C., Martel J., Brochiero E., Mailhot G. CFTR Knockdown induces proinflammatory changes in intestinal epithelial cells. J. Inflamm. 2015;12:62. doi: 10.1186/s12950-015-0107-y. [DOI] [PMC free article] [PubMed] [Google Scholar]
- Danbolt N.C. Glutamate uptake. Prog. Neurobiol. 2001;65:1–105. doi: 10.1016/s0301-0082(00)00067-8. [DOI] [PubMed] [Google Scholar]
- Dassati S., Waldner A., Schweigreiter R. Apolipoprotein D takes center stage in the stress response of the aging and degenerative brain. Neurobiol. Aging. 2014;35:1632–1642. doi: 10.1016/j.neurobiolaging.2014.01.148. [DOI] [PMC free article] [PubMed] [Google Scholar]
- Ding W.X., Yin X.M. Mitophagy: mechanisms, pathophysiological roles, and analysis. Biol. Chem. 2012;393:547–564. doi: 10.1515/hsz-2012-0119. [DOI] [PMC free article] [PubMed] [Google Scholar]
- Edens B.M., Miller N., Ma Y.C. Impaired autophagy and defective mitochondrial function: converging paths on the road to motor neuron degeneration. Front. Cell. Neurosci. 2016;10:44. doi: 10.3389/fncel.2016.00044. [DOI] [PMC free article] [PubMed] [Google Scholar]
- Escartin C., Galea E., Lakatos A., O’Callaghan J.P., Petzold G.C., Serrano-Pozo A., Steinhäuser C., Volterra A., Carmignoto G., Agarwal A., et al. Reactive astrocyte nomenclature, definitions, and future directions. Nat. Neurosci. 2021;24:312. doi: 10.1038/s41593-020-00783-4. [DOI] [PMC free article] [PubMed] [Google Scholar]
- Fonseca T.B., Sánchez-Guerrero Á., Milosevic I., Raimundo N. Mitochondrial fission requires DRP1 but not dynamins. Nature. 2019;570:E34–E42. doi: 10.1038/s41586-019-1296-y. [DOI] [PubMed] [Google Scholar]
- Fraczek L.A., Martin C.B., Martin B.K. c-Jun and c-Fos regulate the complement factor H promoter in murine astrocytes. Mol. Immunol. 2011;49:201–210. doi: 10.1016/j.molimm.2011.08.013. [DOI] [PMC free article] [PubMed] [Google Scholar]
- Gopal S. Syndecans in inflammation at a glance. Front. Immunol. 2020;11:1–5. doi: 10.3389/fimmu.2020.00227. [DOI] [PMC free article] [PubMed] [Google Scholar]
- Haim L.B., Carrillo-de Sauvage M.A., Ceyzériat K., Escartin C. Elusive roles for reactive astrocytes in neurodegenerative diseases. Front. Cell. Neurosci. 2015;9:278. doi: 10.3389/fncel.2015.00278. [DOI] [PMC free article] [PubMed] [Google Scholar]
- Heindryckx F., Li J.P. Role of proteoglycans in neuro-inflammation and central nervous system fibrosis. Matrix Biol. 2018;68–69:589–601. doi: 10.1016/j.matbio.2018.01.015. [DOI] [PubMed] [Google Scholar]
- Heneka M.T., Carson M.J., El Khoury J., Landreth G.E., Brosseron F., Feinstein D.L., Jacobs A.H., Wyss-Coray T., Vitorica J., Ransohoff R.M., et al. Neuroinflammation in Alzheimer’s disease. Lancet Neurol. 2015;14:388–405. doi: 10.1016/S1474-4422(15)70016-5. [DOI] [PMC free article] [PubMed] [Google Scholar]
- Hennessy E., Griffin E.W., Cunningham C. Astrocytes are primed by chronic neurodegeneration to produce exaggerated chemokine and cell infiltration responses to acute stimulation with the cytokines IL-1β and TNF-α. J. Neurosci. 2015;35:8411–8422. doi: 10.1523/JNEUROSCI.2745-14.2015. [DOI] [PMC free article] [PubMed] [Google Scholar]
- Holzerova E., Danhauser K., Haack T.B., Kremer L.S., Melcher M., Ingold I., Kobayashi S., Terrile C., Wolf P., Schaper J., et al. Human thioredoxin 2 deficiency impairs mitochondrial redox homeostasis and causes early-onset neurodegeneration. Brain. 2016;139:346–354. doi: 10.1093/brain/awv350. [DOI] [PubMed] [Google Scholar]
- Jabbari Azad F., Talaei A., Rafatpanah H., Yousefzadeh H., Jafari R., Talaei A., Farid Hosseini R. Association between cytokine production and disease severity in Alzheimer’s disease. Iran. J. Allergy Asthma. Immunol. 2014;13:433–439. [PubMed] [Google Scholar]
- Jäger S., Bucci C., Tanida I., Ueno T., Kominami E., Saftig P., Eskelinen E.L. Role for Rab7 in maturation of late autophagic vacuoles. J. Cell Sci. 2004;117:4837–4848. doi: 10.1242/jcs.01370. [DOI] [PubMed] [Google Scholar]
- Krasniak C.S., Ahmad S.T. The role of CHMP2BIntron5 in autophagy and frontotemporal dementia. Brain Res. 2016;1649:151–157. doi: 10.1016/j.brainres.2016.02.051. [DOI] [PMC free article] [PubMed] [Google Scholar]
- Lahousse S.A., Stopa E.G., Mulberg A.E., De La Monte S.M. Reduced expression of the cystic fibrosis transmembrane conductance regulator gene in the hypothalamus of patients with Alzheimer’s disease. J. Alzheimer’s Dis. 2003;5:455–462. doi: 10.3233/jad-2003-5605. [DOI] [PubMed] [Google Scholar]
- Lee F.S., Peters R.T., Dang L.C., Maniatis T. MEKK1 activates both IκB kinase α and IκB kinase β. Proc. Natl. Acad. Sci. U S A. 1998;95:9319–9324. doi: 10.1073/pnas.95.16.9319. [DOI] [PMC free article] [PubMed] [Google Scholar]
- Lee J.A., Beigneux A., Ahmad S.T., Young S.G., Gao F.B. ESCRT-III dysfunction causes autophagosome accumulation and neurodegeneration. Curr. Biol. 2007;17:1561–1567. doi: 10.1016/j.cub.2007.07.029. [DOI] [PubMed] [Google Scholar]
- Lee J.A., Liu L., Gao F.B. Autophagy defects contribute to neurodegeneration induced by dysfunctional ESCRT-III. Autophagy. 2009;5:1070–1072. doi: 10.4161/auto.5.7.9823. [DOI] [PubMed] [Google Scholar]
- Lee S., Park J.Y., Lee W.H., Kim H., Park H.C., Mori K., Suk K. Lipocalin-2 is an autocrine mediator of reactive astrocytosis. J. Neurosci. 2009;29:234–249. doi: 10.1523/JNEUROSCI.5273-08.2009. [DOI] [PMC free article] [PubMed] [Google Scholar]
- Li X., Yan M., Hu L., Sun L., Zhang F., Ji H., Jiang J., Wang P., Liu H., Gao Y., et al. Involvement of Src-suppressed C kinase substrate in experimental autoimmune encephalomyelitis: a link between release of astrocyte proinflammatory factor and oligodendrocyte apoptosis. J. Neurosci. Res. 2010;88:1858–1871. doi: 10.1002/jnr.22355. [DOI] [PubMed] [Google Scholar]
- Lian H., Yang L., Cole A., Sun L., Chiang A.C.A., Fowler S.W., Shim D.J., Rodriguez-Rivera J., Taglialatela G., Jankowsky J.L., et al. Nfκb-activated astroglial release of complement C3 compromises neuronal morphology and function associated with Alzheimer’s disease. Neuron. 2015;85:101–115. doi: 10.1016/j.neuron.2014.11.018. [DOI] [PMC free article] [PubMed] [Google Scholar]
- Liddelow S.A., Barres B.A. Reactive astrocytes: production, function, and therapeutic potential. Immunity. 2017;46:957–967. doi: 10.1016/j.immuni.2017.06.006. [DOI] [PubMed] [Google Scholar]
- Liddelow S.A., Guttenplan K.A., Clarke L.E., Bennett F.C., Bohlen C.J., Schirmer L., Bennett M.L., Münch A.E., Chung W.S., Peterson T.C., et al. Neurotoxic reactive astrocytes are induced by activated microglia. Nature. 2017;541:481–487. doi: 10.1038/nature21029. [DOI] [PMC free article] [PubMed] [Google Scholar]
- Lindquist S.G., Braendgaard H., Svenstrup K., Isaacs A.M., Nielsen J.E. Frontotemporal dementia linked to chromosome 3 (FTD-3) - current concepts and the detection of a previously unknown branch of the Danish FTD-3 family. Eur. J. Neurol. 2008;15:667–670. doi: 10.1111/j.1468-1331.2008.02144.x. [DOI] [PubMed] [Google Scholar]
- Lu J., Holmgren A. Thioredoxin system in cell death progression. Antioxid. Redox Signal. 2012;17:1738–1747. doi: 10.1089/ars.2012.4650. [DOI] [PubMed] [Google Scholar]
- Luo C., Li Y., Wang H., Feng Z., Li Y., Long J., Liu J. Mitochondrial accumulation under oxidative stress is due to defects in autophagy. J. Cell. Biochem. 2013;114:212–219. doi: 10.1002/jcb.24356. [DOI] [PubMed] [Google Scholar]
- McKenna M.C., Tildon J.T., Stevenson J.H., Huang X., Kingwell K.G. Regulation of mitochondrial and cytosolic malic enzymes from cultured rat brain astrocytes. Neurochem. Res. 1995;20:1491–1501. doi: 10.1007/BF00970599. [DOI] [PubMed] [Google Scholar]
- McKenna M.C., Dienel G.A., Sonnewald U., Waagepetersen H.S., Schousboe A. Basic Neurochemistry. Elsevier; 2012. Energy metabolism of the brain; pp. 200–231. [Google Scholar]
- Mortiboys H., Aasly J., Bandmann O. Ursocholanic acid rescues mitochondrial function in common forms of familial Parkinson’s disease. Brain. 2013;136:3038–3050. doi: 10.1093/brain/awt224. [DOI] [PubMed] [Google Scholar]
- Nakamura S., Yoshimori T. New insights into autophagosome-lysosome fusion. J. Cell Sci. 2017;130:1209–1216. doi: 10.1242/jcs.196352. [DOI] [PubMed] [Google Scholar]
- Oksanen M., Petersen A.J., Naumenko N., Puttonen K., Lehtonen Š., Gubert Olivé M., Shakirzyanova A., Leskelä S., Sarajärvi T., Viitanen M., et al. PSEN1 mutant iPSC-derived model reveals severe astrocyte pathology in Alzheimer’s disease. Stem Cell Reports. 2017;9:1885–1897. doi: 10.1016/j.stemcr.2017.10.016. [DOI] [PMC free article] [PubMed] [Google Scholar]
- Osborn L.M., Kamphuis W., Wadman W.J., Hol E.M. Astrogliosis: an integral player in the pathogenesis of Alzheimer’s disease. Prog. Neurobiol. 2016;144:121–141. doi: 10.1016/j.pneurobio.2016.01.001. [DOI] [PubMed] [Google Scholar]
- Pugsley H.R. Assessing autophagic flux by measuring LC3, p62, and LAMP1 co-localization using multispectral imaging flow cytometry. J. Vis. Exp. 2017;1:55637. doi: 10.3791/55637. [DOI] [PMC free article] [PubMed] [Google Scholar]
- Qian K., Huang H., Peterson A., Hu B., Maragakis N.J., Ming G.L., Chen H., Zhang S.C. Sporadic ALS astrocytes induce neuronal degeneration in vivo. Stem Cell Reports. 2017;8:843–855. doi: 10.1016/j.stemcr.2017.03.003. [DOI] [PMC free article] [PubMed] [Google Scholar]
- Radford R.A., Morsch M., Rayner S.L., Cole N.J., Pountney D.L., Chung R.S. The established and emerging roles of astrocytes and microglia in amyotrophic lateral sclerosis and frontotemporal dementia. Front. Cell. Neurosci. 2015;9:27. doi: 10.3389/fncel.2015.00414. [DOI] [PMC free article] [PubMed] [Google Scholar]
- Rasmussen M.A., Holst B., Tümer Z., Johnsen M.G., Zhou S., Stummann T.C., Hyttel P., Clausen C. Transient p53 suppression increases reprogramming of human fibroblasts without affecting apoptosis and DNA damage. Stem Cell Rep. 2014;3:404–413. doi: 10.1016/j.stemcr.2014.07.006. [DOI] [PMC free article] [PubMed] [Google Scholar]
- Rea S.L., Majcher V., Searle M.S., Layfield R. SQSTM1 mutations - bridging Paget disease of bone and ALS/FTLD. Exp. Cell Res. 2014;325:27–37. doi: 10.1016/j.yexcr.2014.01.020. [DOI] [PubMed] [Google Scholar]
- Shaltouki A., Peng J., Liu Q., Rao M.S., Zeng X. Efficient generation of astrocytes from human pluripotent stem cells in defined conditions. Stem Cells. 2013;31:941–952. doi: 10.1002/stem.1334. [DOI] [PubMed] [Google Scholar]
- Silva J.M., Rodrigues S., Sampaio-Marques B., Gomes P., Neves-Carvalho A., Dioli C., Soares-Cunha C., Mazuik B.F., Takashima A., Ludovico P., et al. Dysregulation of autophagy and stress granule-related proteins in stress-driven Tau pathology. Cell Death Differ. 2019;26:1411–1427. doi: 10.1038/s41418-018-0217-1. [DOI] [PMC free article] [PubMed] [Google Scholar]
- Skibinski G., Parkinson N.J., Brown J.M., Chakrabarti L., Lloyd S.L., Hummerich H., Nielsen J.E., Hodges J.R., Spillantini M.G., Thusgaard T., et al. Mutations in the endosomal ESCRTIII-complex subunit CHMP2B in frontotemporal dementia. Nat. Genet. 2005;37:806–808. doi: 10.1038/ng1609. [DOI] [PubMed] [Google Scholar]
- Sofroniew M.V. Astrocyte barriers to neurotoxic inflammation. Nat. Rev. Neurosci. 2015;16:249–263. doi: 10.1038/nrn3898. [DOI] [PMC free article] [PubMed] [Google Scholar]
- Starnes T., Broxmeyer H.E., Robertson M.J., Hromas R. Cutting edge: IL-17D, a novel member of the IL-17 family, stimulates cytokine production and inhibits hemopoiesis. J. Immunol. 2002;169:642–646. doi: 10.4049/jimmunol.169.2.642. [DOI] [PubMed] [Google Scholar]
- Tripathi P., Rodriguez-Muela N., Klim J.R., de Boer A.S., Agrawal S., Sandoe J., Lopes C.S., Ogliari K.S., Williams L.A., Shear M., et al. Reactive astrocytes promote ALS-like degeneration and intracellular protein aggregation in human motor neurons by disrupting autophagy through TGF-β1. Stem Cell Reports. 2017;9:667–680. doi: 10.1016/j.stemcr.2017.06.008. [DOI] [PMC free article] [PubMed] [Google Scholar]
- Urwin H., Authier A., Nielsen J.E., Metcalf D., Powell C., Froud K., Malcolm D.S., Holm I., Johannsen P., Brown J., et al. Disruption of endocytic trafficking in frontotemporal dementia with CHMP2B mutations. Hum. Mol. Genet. 2010;19:2228–2238. doi: 10.1093/hmg/ddq100. [DOI] [PMC free article] [PubMed] [Google Scholar]
- West R.J.H., Ugbode C., Fort-Aznar L., Sweeney S.T. Neuroprotective activity of ursodeoxycholic acid in CHMP2BIntron5 models of frontotemporal dementia. Neurobiol. Dis. 2020;144:105047. doi: 10.1016/j.nbd.2020.105047. [DOI] [PMC free article] [PubMed] [Google Scholar]
- Westermann B. Mitochondrial fusion and fission in cell life and death. Nat. Rev. Mol. Cell Biol. 2010;11:872–884. doi: 10.1038/nrm3013. [DOI] [PubMed] [Google Scholar]
- Xia Y., Wu Z., Su B., Murray B., Karin M. JNKK1 organizes a MAP kinase module through specific and sequential interactions with upstream and downstream components mediated by its amino- terminal extension. Genes Dev. 1998;12:3369–3381. doi: 10.1101/gad.12.21.3369. [DOI] [PMC free article] [PubMed] [Google Scholar]
- Xie Y., Zhou B., Lin M.Y., Wang S., Foust K.D., Sheng Z.H. Endolysosomal deficits augment mitochondria pathology in spinal motor neurons of asymptomatic fALS mice. Neuron. 2015;87:355–370. doi: 10.1016/j.neuron.2015.06.026. [DOI] [PMC free article] [PubMed] [Google Scholar]
- Yoon Y., Krueger E.W., Oswald B.J., McNiven M.A. The mitochondrial protein hFis1 regulates mitochondrial fission in mammalian cells through an interaction with the dynamin-like protein DLP1. Mol. Cell. Biol. 2003;23:5409–5420. doi: 10.1128/MCB.23.15.5409-5420.2003. [DOI] [PMC free article] [PubMed] [Google Scholar]
- Yu R., Lendahl U., Nistér M., Zhao J. Regulation of mammalian mitochondrial dynamics: opportunities and challenges. Front. Endocrinol. (Lausanne). 2020;11:374. doi: 10.3389/fendo.2020.00374. [DOI] [PMC free article] [PubMed] [Google Scholar]
- Zhang X., Ge Y.-L., Zhang S.-P., Yan P., Tian R.-H. Downregulation of KDR expression induces apoptosis in breast cancer cells. Cell. Mol. Biol. Lett. 2014;19:527–541. doi: 10.2478/s11658-014-0210-8. [DOI] [PMC free article] [PubMed] [Google Scholar]
- Zhang Y., Schmid B., Nikolaisen N.K., Rasmussen M.A., Aldana B.I., Agger M., Calloe K., Stummann T.C., Larsen H.M., Nielsen T.T., et al. Patient iPSC-derived neurons for disease modeling of frontotemporal dementia with mutation in CHMP2B. Stem Cell Reports. 2017;8:648–658. doi: 10.1016/j.stemcr.2017.01.012. [DOI] [PMC free article] [PubMed] [Google Scholar]
- Zhao D., Hong D., Zhang W., Yao S., Qi X., Lv H., Zheng R., Feng L., Huang Y., Yuan Y., et al. Mutations in mitochondrially encoded complex i enzyme as the second common cause in a cohort of Chinese patients with mitochondrial myopathy, encephalopathy, lactic acidosis and stroke-like episodes. J. Hum. Genet. 2011;56:759–764. doi: 10.1038/jhg.2011.96. [DOI] [PubMed] [Google Scholar]
Associated Data
This section collects any data citations, data availability statements, or supplementary materials included in this article.
Supplementary Materials
Data Availability Statement
The datasets used and analyzed during this study are available in the source data file. The dataset generated for RNA-seq has been deposited in the NCBI GEO database under the accession number GEO: GSE141388.