

Abstract
Background
frailty shows an upward trajectory with age, and higher levels increase the risk of mortality. However, it is less known whether the shape of frailty trajectories differs by age at death or whether the rate of change in frailty is associated with mortality.
Objectives
to assess population frailty trajectories by age at death and to analyse whether the current level of the frailty index (FI) i.e. the most recent measurement or the person-specific rate of change is more predictive of mortality.
Methods
3,689 individuals from three population-based cohorts with up to 15 repeated measurements of the Rockwood frailty index were analysed. The FI trajectories were assessed by stratifying the sample into four age-at-death groups: <70, 70–80, 80–90 and >90 years. Generalised survival models were used in the survival analysis.
Results
the FI trajectories by age at death showed that those who died at <70 years had a steadily increasing trajectory throughout the 40 years before death, whereas those who died at the oldest ages only accrued deficits from age ~75 onwards. Higher level of FI was independently associated with increased risk of mortality (hazard ratio 1.68, 95% confidence interval 1.47–1.91), whereas the rate of change was no longer significant after accounting for the current FI level. The effect of the FI level did not weaken with time elapsed since the last measurement.
Conclusions
Frailty trajectories differ as a function of age-at-death category. The current level of FI is a stronger marker for risk stratification than the rate of change.
Keywords: frailty, trajectories, mortality, age at death, older people
Key Points
Frailty shows an upward trajectory with age, but it is unknown whether population frailty trajectories differ by age at death.
Less is also known whether it is the level or the rate of change that is more predictive of mortality.
Those who died at <70 years had the highest levels and rates of change in frailty from midlife onwards.
Those who died at the oldest ages only accrued increase in frailty from age ~75 onwards
The current level of FI is as a stronger marker for risk stratification than the rate of change.
Introduction
Aging is a highly heterogeneous process with substantial between-individual variation in health and functioning. One way to capture this heterogeneity is to measure the level of frailty. Frailty is a clinically recognised condition associated with decreased physiological reserves and functioning across multiple organ systems [1]. It is a major public health concern and is associated with a variety of adverse outcomes, such as hospitalisations, disability and death [2]. While there is yet no widely accepted consensus on the operationalisation of frailty, the two principal models are the frailty phenotype (FP) and the Rockwood frailty index (FI). The FP views frailty as a physical syndrome and categorises individuals as robust, pre-frail, and frail based on weak grip strength, slow walking speed, exhaustion and low energy expenditure [3]. The FI is based on a broader, multidimensional definition of frailty; it is a continuous score that measures the accumulation of health deficits across medical, physiological and (psycho) social domains [4]. Due to these properties, the FI also allows for feasible assessment of population frailty trajectories and identification of subtle changes therein.
Population estimates from longitudinal studies [5], including ours [6], have unequivocally shown that the FI shows an upward trajectory with age. A few studies have also looked at frailty trajectories in relation to death across old age [7–9] and at the end of life [10], and found that higher or rapidly increasing frailty trajectories were associated with worse survival. It is thus pertinent to assess population frailty trajectories considering not only time to death, but also age at death, to assess whether those who die at younger ages have different frailty trajectories from those who die at older ages. Ascertaining such differences will aid in understanding individual differences in frailty trajectories and their relationship to mortality. Another understudied question in the relationship between frailty trajectories and mortality is whether the person-specific rate of change is associated with mortality, and if so, whether it captures the risk better than the current (most recent) level of frailty. Towards these goals, we first wanted to examine whether people of different age at death have distinct FI trajectories before death across adulthood and into old age by analysing FI trajectories in four age-at-death groups (<70, 70–80, 80–90 and >90 years). We next assessed whether the level and rate of change in FI differ across the age-at-death groups, and lastly analysed whether it is the current level of FI or the person-specific rate of change in FI that is more predictive of all-cause mortality.
Methods
Study sample
The study sample comprised three longitudinal Swedish Twin Registry [11] cohorts: A Longitudinal Study of Gender Differences in Health Behavior and Health among Elderly [12] (GENDER), the Origins of Variance in the Oldest-Old: Octogenarian Twins [13] (OCTO-Twin) and the Swedish Adoption/Twin Study of Aging [14] (SATSA). The procedures of recruiting and assessing the participants were very similar across the cohorts. GENDER is an unlike-sex twin study, comprising two questionnaire and three in-person testing (IPT) waves across 13 years, aimed at investigating health differences in aging between men and women. At baseline, the sample consisted of 1,210 individuals, aged between 68 and 88 years. OCTO-Twin is a same-sex twin study of the aetiology of individual differences among the oldest-old. The sample consisted of five IPT waves across 10 years and included 702 individuals aged 80 and older at baseline. SATSA is a same-sex twin study with nine questionnaire and 10 IPT waves across 30 years. In the present study, the second SATSA questionnaire wave was regarded as the baseline, with 1,637 individuals aged between 29 and 96 years participating. For SATSA, the FI was not available in the first and sixth questionnaire waves or in the first and fourth IPT waves, leaving us with 15 waves of data across 27 years in the present study. For GENDER and OCTO-Twin, all five waves had the FI available and were thus included. The number of individuals by the number of waves they participated in are presented in Appendix 1 available in Age and Ageing online, and the data collection periods for each cohort are presented in Appendix 2 available in Age and Ageing online. The distribution of the last available FI measurement across the waves for individuals included in the survival analysis (see Statistical analysis) is presented in Appendix 3 available in Age and Ageing online.
FI assessment
For all the cohorts, the FI was created based on the Rockwood deficit accumulation model [4] according to a standard procedure [15]. Detailed description of the procedures is provided in Appendix 4 available in Age and Ageing online. In brief, items on signs, symptoms, diseases, disabilities and psychosocial well-being were included in the FI, and the sum of the deficits present for an individual was divided by the total number of deficits considered, resulting in a value ranging from 0 to 1.0. The items, 42 in SATSA and GENDER and 41 in OCTO-Twin, were identical across the waves within each cohort and identical or similar across the cohorts (Appendix 5 available in Age and Ageing online). For the survival analysis (see Statistical analysis), both the level of FI and rate of change were multiplied by 10 to facilitate interpretation, so that the hazard ratios (HRs) associated with the FI level and change represent increments of 0.1 in these measures. The modelled estimate of the FI level was based on the current FI i.e. the most recent measurement at any given time. The rate of change in FI was defined as the difference between the current i.e. most recent and the first FI measurement divided by the number of years between the measurements. In the model, the FI level measured at the beginning of each time interval (from the latest to the next FI measurement occasion or death/censoring) was hence coupled with an FI change until that measurement, yielding multiple (within-individual) FI change measurements where available.
Mortality data
The dates of death for all-cause mortality were derived from the Swedish National Death Registry through 15 June 2019 for all cohorts.
Statistical analysis
The FI trajectories were assessed up to 40 years before death and the full sample was stratified into four age-at-death groups at 10-year intervals: <70, 70–80, 80–90 and >90 years. We first assessed the FI trajectories in the age-at-death groups by using generalised additive model-fitted regression lines in ggplot2. We then fitted a mixed model for each of the age-at-death groups, with the fixed effect of age as a natural spline term with three degrees of freedom, including sex and random intercepts at the twin pair and individual level. In the next analysis, we assessed whether the FI level and rate of change differ across these age-at-death groups, by taking the first available FI level and rate of change from each individual in the age range of 50–70. We chose the age period of 50–70 years to this analysis as this was the period of the greatest age overlap in the FI trajectories across the age-at-death groups. 992 and 584 individuals had an FI level and FI change (i.e. at least two FI measurements), respectively, available in this age range. The Wilcoxon rank sum test was used for the comparisons, using those who died <70 years as the reference category.
Lastly, we used generalised survival models [16, 17] with attained age as timescale to assess the effects of the FI and the rate of change in FI on mortality in the full sample (without age range restrictions) accounting for repeated measurements and covariates. Individuals were included in the analysis if they had a minimum of two FI measurements at least 1 year apart; this yielded 2,677 individuals and 10,438 measurements in the full sample. We wanted to see whether the effects of the current (most recent) FI level and FI change on mortality are different depending on age at measurement or time since measurement, and thus included an interaction between age (centred at 74 years based on cohort mean at baseline) and these two variables. Sex, smoking status and body mass index (BMI) assessed at each FI measurement occasion were used as time-varying covariates. Smoking status was an ordinal variable scored: non-smoker = 1, ex-smoker = 2 and current-smoker = 3. BMI was assessed as self-reported weight in kilograms divided by height in meters squared and used as continuous variable. The non-independence of the twin pairs was accounted for by using robust standard errors. As regression models rely on the assumption that predictor variables are measured without an error, there is a possibility that the estimates of the predictors (here the level and the rate of change in the FI) are down-biased [18]. Hence, as a sensitivity analysis, we fitted joint modes to our data by first regressing the time-varying FI on an age spline in a mixed model and then used the fitted data at event times to predict the outcome (death) in a Cox model. In the joint model, the FI level is thus a predicted value of the FI at any given time and the rate of change is a derivative of the FI based on the age spline at given times. Sex, BMI and smoking were included as covariates. Detailed descriptions of the models are provided in Appendix 4 available in Age and Ageing online. Statistical significance was set to P < 0.05. R version 3.6.1 was used in the modelling.
Results
Characteristics of each of the cohorts and the full sample (GENDER, OCTO-Twin and SATSA pooled, comprising 2,677 individuals included in the survival analysis) at baseline i.e. when the FI was first assessed for each individual are presented in Table 1. Baseline characteristics of the 2,677 individuals included in the survival analysis vs. the 1,012 individuals excluded from the analysis are presented in Appendix 6 available in Age and Ageing online. Those who were excluded were older at baseline and had higher FI levels. Sample characteristics for each cohort at each wave are presented in Appendices 7–9 available in Age and Ageing online. Distributions of the FI and yearly FI change are presented in Supplementary Figures in Appendices 10 and 11 available in Age and Ageing online, respectively.
Table 1 .
Sample characteristics at baseline i.e. when the FI was first assessed for the 2,677 individuals included in the survival analysis
| GENDER | OCTO-Twin | SATSA | Full sample | |
|---|---|---|---|---|
| N waves | 5 | 5 | 15 | 15 |
| N individuals | 611 | 525 | 1,541 | 2,677 |
| Women (%) | 310 (50.7) | 344 (65.5) | 906 (58.8) | 1,560 (58.3) |
| Age range | 68–83 | 79–98 | 29–89 | 29–98 |
| Age (SD) | 72.9 (2.8) | 83.2 (2.9) | 60.1 (13.1) | 67.6 (13.7) |
| Age, men (SD) | 72.7 (2.7) | 82.7 (2.5) | 59.3 (12.4) | 66.7 (13.1) |
| Age, women (SD) | 73.1 (2.9) | 83.5 (3.0) | 60.7 (13.5) | 68.2 (14.1) |
| FI, median (min, max) | 0.06 (0, 0.52) | 0.20 (0, 0.57) | 0.07 (0, 0.57) | 0.08 (0, 0.57) |
| FI, median men (min, max) | 0.06 (0, 0.52) | 0.17 (0.02, 0.56) | 0.07 (0, 0.54) | 0.07 (0, 0.56) |
| FI, median women (min, max) | 0.06 (0, 0.46) | 0.22 (0, 0.57) | 0.08 (0, 0.57) | 0.10 (0, 0.57) |
| FI change, median (min, max) | 0.01 (−0.14, 0.19) | 0.00 (−0.16, 0.10) | 0.00 (−0.06, 0.10) | 0.00 (−0.16, 0.19) |
| BMI (SD) | 25.2 (3.2) | 24.7 (3.7) | 24.9 (3.6) | 24.9 (3.6) |
| Smoking status | ||||
| Non-smoker (%) | 374 (61.6) | 350 (67.0) | 1,078 (70.7) | 1,802 (67.9) |
| Ex-smoker (%) | 178 (29.3) | 128 (24.5) | 84 (5.5) | 390 (14.7) |
| Current smoker (%) | 55 (9.1) | 44 (8.4) | 363 (23.8) | 462 (17.4) |
| N deaths (%) | 557 (91.2) | 525 (100) | 1,012 (65.7) | 2,094 (78.2) |
| By age at death | ||||
| <70 years (%) | 0 | 0 | 83 (8.1) | 83 (4.0) |
| 70–80 years (%) | 65 (11.7) | 0 | 219 (21.4) | 284 (13.6) |
| 80–90 years (%) | 265 (47.6) | 229 (43.6) | 452 (44.3) | 946 (45.2) |
| >90 years (%) | 227 (40.8) | 296 (56.4) | 258 (25.3) | 781 (37.3) |
| Time to follow-up, median (min, max)a | 16.4 (1.9, 24.6) | 7.5 (1.9, 23.4) | 22.9 (1.9, 31.6) | 17.0 (1.9, 31.6) |
Abbreviations: BMI, body mass index; FI, frailty index; SD, standard deviation
aTime to mortality follow-up in years since the last FI assessment. The FI change is based on the change between first and last available FI measurement.
Assessment of the FI trajectories by age at death revealed differences across the four groups, most notably between those who died at <70 years and those who died at 80–90 and >90 years of age (Figure 1). Those who died before 70 years had a steadily increasing trajectory throughout the ~40 years before death, whereas those who died in the oldest ages only accrued deficits from ~75 years onwards. The confidence intervals were nevertheless wide at both ends of the trajectories, making interpretations feasible only at the middle parts. Figure 2 with the regression lines from the mixed models illustrates that with the exception of those who died before 70 years, men had lower levels of FI across the age-at-death groups. Assessing the differences in the FI level and rate of change revealed significant differences across the age at-death-groups; those who died at age 70 or younger presented with the highest FI levels and rates of change at ages 50 to 70 years (Figure 3).
Figure 1 .
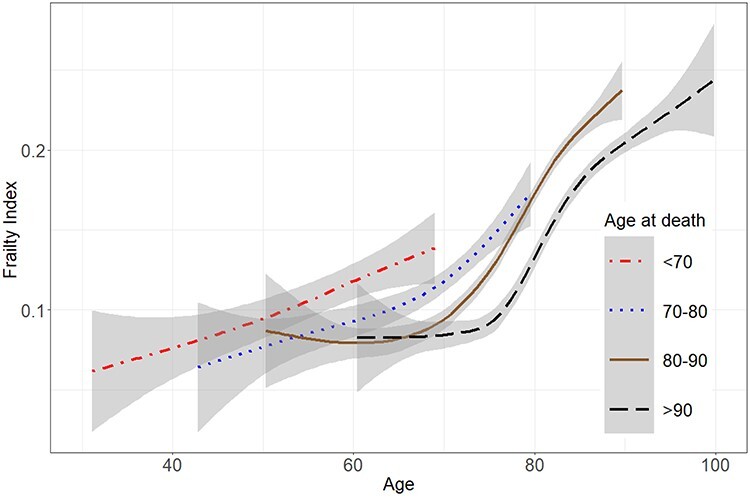
Frailty trajectories by age at death in 3,689 individuals. Middle parts of the trajectories suggest significant differences in frailty trajectories. The grey-shaded areas represent 95% confidence intervals.
Figure 2 .
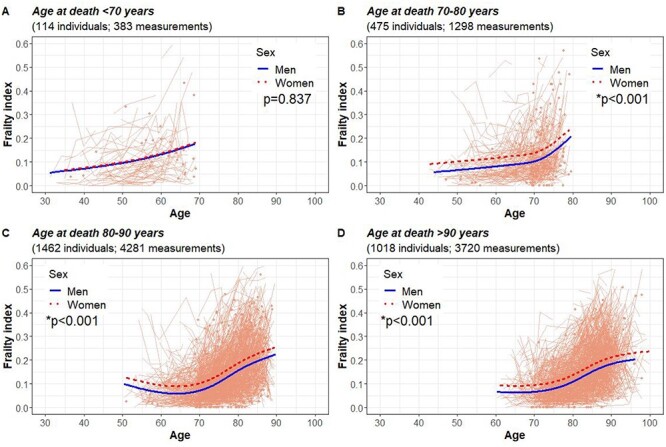
Frailty trajectories by age at death and sex in individuals who died at age <70 years (A), 70–80 years (B), 80–90 years (C) and >90 years (D). The light orange spaghetti lines represent individual observations. *P for difference between men and women.
Figure 3 .
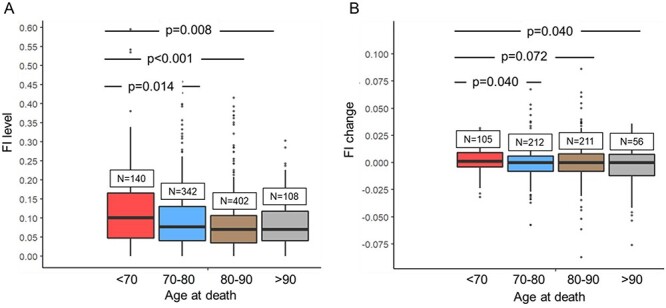
Frailty index (FI) levels (A) and rates of change (B) by age-at death (<70 years, 70–80 years, 80–90 years >90 years). The values are based on the first available FI and FI change measured between ages 50–70 years. P-values are based on the Wilcoxon rank sum test.
In the generalised survival models, we first assessed the effect of the FI level on mortality (Table 2A). In model 1, we included only sex as a covariate, in model 2 we added the age interaction for the FI, and in model 3 we added BMI and smoking as time-varying covariates (Table 2A). After adjusting for sex, smoking and BMI (Table 2A, model 3), a 10% increase in the FI was associated with a 69% increase in the risk of mortality. We next built similar models for FI change, and found that after adjusting for sex, smoking and BMI, a 10% increase in the yearly rate of change in FI was associated with a 90% increase in the risk of mortality (Table 2B, model 2). When including the level of FI into the model, the association with FI change attenuated to the null, whereas the association with FI level remained significant (Table 2B, model 3). The interaction terms for age at measurement indicated that the risk carried by the FI was significantly higher at younger-old ages, decreasing by 3% every year after age 74 (the centring age), whereas no age interaction was found for FI change (Table 2B, model 4). The risks carried by the FI level or FI change were not affected by time elapsed since their measurement (Table 2B, model 4). The baseline FI was significantly and inversely correlated with the rate of change in FI (Spearman’s r = −0.26, P < 0.001). The same models fitted separately for each cohort revealed similar results compared to the full sample (Appendices 12–14 available in Age and Ageing online). A sensitivity analysis assessing the imputation was performed to examine the associations of the FI level and FI change with mortality using the complete case data (participants with no missing data across the FI items). Highly similar results were observed as with the imputed datasets (Appendices 15–18 available in Age and Ageing online).
Table 2 .
Associations between a 10% increase in the level of FI and all-cause mortality (A) and between 10% increase in the rate of change in FI and all-cause mortality (B) in the full sample of 2,677 individuals
| A | ||||
|---|---|---|---|---|
| Model 1 | Model 2 | Model 3 | ||
| HR (95% CI) | HR (95% CI) | HR (95% CI) | ||
| FI | 1.29 (1.24, 1.34)* | 1.68 (1.59, 1.78)* | 1.69 (1.59, 1.79)* | |
| Sex | 0.57 (0.53, 0.63)* | 0.57 (0.53, 0.63)* | 0.60 (0.54, 0.66)* | |
| FI × age at measurement | 0.78 (0.75, 0.81)* | 0.97 (0.97, 0.98)* | ||
| BMI | 0.98 (0.97, 0.99)* | |||
| Smoking | 1.16 (1.08, 1.25)* | |||
|
*P<0.05. Age at measurement refers to attained age at the FI assessment, centred at 74 years. The FI level is based on the current FI i.e., the most recent measurement at any given time Model 1: FI + sex (ref. male) Model 2: FI + sex (ref. male) + FI × age at FI measurement Model 3: FI + sex (ref. male) + FI × age at FI measurement + BMI + smoking Abbreviations: BMI, body mass index; CI, confidence interval; FI, frailty index; HR, hazard ratio |
||||
| B | ||||
| Model 1 | Model 2 | Model 3 | Model 4 | |
| HR (95% CI) | HR (95% CI) | HR (95% CI) | HR (95% CI) | |
| FI change | 1.63 (1.27, 2.10)* | 1.90 (1.37, 2.65)* | 0.97 (0.72, 1.31) | 1.16 (0.34, 3.95) |
| Sex | 0.63 (0.57, 0.69)* | 0.65 (0.59, 0.72)* | 0.62 (0.56, 0.68)* | 0.60 (0.54, 0.66)* |
| FI change × age at measurement | 0.98 (0.94, 1.02) | 1.00 (0.95, 1.04) | ||
| BMI | 0.99 (0.98, 1.00) | 0.99 (0.98, 0.99)* | 0.98 (0.96, 0.99)* | |
| Smoking | 1.22 (1.13, 1.31)* | 1.21 (1.12, 1.30)* | 1.16 (1.08, 1.25)* | |
| FI | 1.27 (1.21, 1.33)* | 1.68 (1.47, 1.91)* | ||
| FI × age at measurement | 0.97 (0.97, 0.97)* | |||
| FI × time since measurement | 1.00 (0.99, 1.01) | |||
| FI change × time since measurement | 0.97 (0.89, 1.05) | |||
* P < 0.05.Age at measurement refers to attained age at the FI or FI change assessment, centred at 74 years. The FI level is based on the current FI i.e. the most recent measurement at any given time. The rate of change in FI is defined as the difference between the current i.e. most recent and the first FI measurement divided by the number of years between the measurements. Time since measurement refers to the time since the last available FI assessment
Model 1: FI change + sex (ref. male)
Model 2: FI change + sex (ref. male) + FI change × age at FI measurement + BMI + smoking
Model 3: FI change + sex (ref. male) + FI change × age at FI measurement + BMI + smoking + FI
Model 4: FI change + sex (ref. male) + FI change × age at FI measurement + BMI + smoking + FI + FI × age at FI measurement + FI × time since FI measurement + FI change × time since FI measurement
Abbreviations: BMI, body mass index; CI, confidence interval; FI, frailty index; HR, hazard ratio
Results from the joint models showed that a greater FI change was significantly associated with an increased risk of mortality when assessed individually (HR 1.36; confidence interval [CI] 1.25, 1.47; Appendix 19 available in Age and Ageing online, model 1), but when the FI level was included in the model, the estimate of the FI change turned negative (HR 0.82; CI 0.74, 0.92, Appendix 19 available in Age and Ageing online; model 2), while the FI level was positively associated with mortality (HR 1.77; CI 1.70, 1.85; Appendix 19 available in Age and Ageing online; model 2), analogously to the generalised survival model (Table 2B). Overall, we found no support to the hypothesis that our estimates in the generalised survival model (Table 2B) were down-biased.
Discussion
In this analysis, we found that the frailty trajectories across 40 years before death differed by age at death, with all the four age-at-death groups (<70, 70–80, 80–90 and >90 years) showing district trajectories. Those who died at age 70 or younger experienced a steady increase in frailty throughout the 40 years of follow-up until death, whereas those dying older than 80 or 90 years started to accumulate deficits only after age 70. Those living up to the oldest ages nevertheless accrued the highest absolute levels of frailty, but the accumulation of deficits was restricted to the last two decades of life. With the exception of those dying at age 70 or younger, men had lower trajectories than women across the age-at-death groups. Assessing differences in the FI level and rate of change across the age-at-death groups revealed that from midlife onwards, from age 50 to 70 years, those who died at age 70 or younger presented with the highest FI levels and rates of change. In the mortality analysis, both the level and the rate of change in frailty were predictive of mortality when assessed individually. However, when assessed simultaneously in a multivariate model, only the level of frailty remained significant, with a 10% increase in the FI associated with a 68% increase in the risk of mortality. The risk carried by the FI was age varying with greater relative risks observed at younger-old ages than in old age—a finding that is in line with our previous observations [19–21]. Time elapsed since the last measurement did not affect the risks associated with the FI.
To the best of our knowledge, the present study is the first to look at frailty trajectories by age at death. Similar analysis have previously been performed on blood pressure [22] and comorbidities [23], showing that age at death shapes the trajectories of these phenotypes. Analyses of comorbidity trajectories that were assessed across 6 years before death showed that those dying at age >100 had fewer comorbidities throughout the follow-up than those dying at age >80 or >90. This is somewhat opposite to what we found for frailty; the highest levels were observed among those who lived longest and vice versa, suggesting that accruing deficits might be relatively less detrimental in old age than in midlife. Our observation from the survival modelling that higher frailty seems more detrimental in younger-old ages than in old age supports this hypothesis. However, it is also possible that the nature of the deficits accrued in midlife differs from those typically accrued in old age, and these differences might modify the frailty-associated risk. Regardless of the underlying mechanisms, it is of importance to understand how frailty changes over time when age at death—or the proximity to death—is taken into account. With the current understanding of calendar age being the major driver of normative progression in frailty, our results add to this relationship by showing that from midlife onwards, time to death seems to shape the frailty trajectories, too. As for clinical implications, the fact that those who died at age <70 had higher FI levels and rates of change from age 50 onwards compared to those dying at older ages, suggests that a middle-aged individual presenting with a high level of frailty could be subjected to supportive measures and a closer monitoring of their frailty progression.
The question whether it is the baseline level or the person-specific rate of change that is more predictive of mortality has been addressed in two previous studies. In an analysis of 832 older individuals, the level and rate of change in a composite measure of physical frailty were tested for their associations with the risk of death [8]. The authors concluded that the baseline frailty and annual change in frailty were relatively independently associated with all-cause mortality. A recent study on four longitudinal cohorts found that higher rate of increase in the FI predicts mortality independent of the baseline FI [9]. While they also reported that the current (most recent) FI predicts mortality in their sample, they only differentiated between the baseline FI and FI change in the framework of joint modelling, and not between current FI and FI change [9]. Also, a study looking at clusters of FI trajectories i.e. not specifically indexing person-specific change, reported that individuals in the highest frailty cluster have worse survival, even after adjusting for baseline FI [7].
Our study specifically focused on the current (most recent) FI; when controlling the association between the FI change and mortality for the current FI, the FI change was no longer significant, indicating that the present frailty status is more predictive of mortality than the past trajectory. As we also observed an inverse correlation between the baseline FI and the delta FI (difference between the baseline and last available FI), it appears that those experiencing greatest increases in frailty during the follow-up start off from a lower baseline level of frailty. A similar observation was made by Stow et al. who analysed end-of-life frailty trajectories. They found that while those individuals who experienced a rapidly rising trajectory had the worst survival, they also started from a lower baseline level than those experiencing a stable or moderate growth [10]. Another study looking at late-life frailty trajectories found evidence for a terminal decline in frailty, so that there is an acceleration in the deficit accumulation rate approximately 3 years before death [24]. Relying merely on the baseline frailty might thus not identify all individuals at risk of death. In a recent study, Thompson et al. addressed the effect of the recurrence of the frailty measurement, and found that frailty measured at follow-up was a stronger predictor of 10-year mortality than frailty at baseline, suggesting that more recent assessment improves prediction [25].
This study has some limitations. The FI was based on self-reported data, so there is a possibility of misclassification. A comparative study by Theou et al. has however demonstrated that an FI constructed exclusively from test-based measures yields an FI similar in characteristics to a self-report-based FI [26]. For best predictive ability, self-reported and test-based measures should be combined [26]. As our FIs also included several items related to chronic conditions, it is possible that part of the effect of the FI is driven by multimorbidity. Indeed, there is evidence that chronic conditions and multimorbidity associate with worsening frailty over time, regardless of which definition (FI or FP) is used [27, 28]. However, the association between multimorbidity and mortality was found to attenuate to null when the FI was added to the model, suggesting that frailty explains the variance in mortality better than a mere number of diseases [28]. As in all longitudinal studies, attrition due to dropout might have affected the frailty trajectories, resulting in underestimation of the rate of change. However, inclusion of the OCTO-Twin and GENDER studies allowed us to oversample late life, increasing precision and generalisability at old age. In addition, in the IPTs of all three studies, research nurses visited the participants at their residence, enabling data collection to continue even after entry into assisted living facilities. The strengths of this study also include complete coverage of mortality, frequent repeated measurements of frailty and the ability to track frailty trajectories for up to 40 years before death.
In summary, this study finds that frailty trajectories differ as a function of age-at-death category, the most prominent feature being that there is a delay in the accrual of deficits among those who die at very old age. As frailty assessment is becoming more widely used in clinical decision-making processes, our results suggest that regular frailty assessments are useful in informing decisions, with the most recent assessment being more informative than the past change. Higher level of frailty in a middle-aged or younger-old adult gives cause for a closer monitoring and care need assessments, whereas higher frailty in older age is relatively less alarming.
Supplementary Material
Acknowledgements
Dr. Alexander Ploner is acknowledged for statistical support.
Contributor Information
Ge Bai, Department of Medical Epidemiology and Biostatistics, Karolinska Institutet, Stockholm, Sweden.
Agnieszka Szwajda, Department of Medical Epidemiology and Biostatistics, Karolinska Institutet, Stockholm, Sweden.
Yunzhang Wang, Department of Medical Epidemiology and Biostatistics, Karolinska Institutet, Stockholm, Sweden.
Xia Li, Department of Medical Epidemiology and Biostatistics, Karolinska Institutet, Stockholm, Sweden.
Hannah Bower, Clinical Epidemiology Division, Department of Medicine Solna, Karolinska Institutet, Stockholm, Sweden.
Ida K Karlsson, Department of Medical Epidemiology and Biostatistics, Karolinska Institutet, Stockholm, Sweden; School of Health and Welfare, Institute of Gerontology and Aging Research Network—Jönköping (ARN-J), Jönköping University, Jönköping, Sweden.
Boo Johansson, Department of Psychology, Centre for Ageing and Health (AgeCap), University of Gothenburg, Gothenburg, Sweden.
Anna K Dahl Aslan, Department of Medical Epidemiology and Biostatistics, Karolinska Institutet, Stockholm, Sweden; School of Health Sciences, University of Skövde, Skövde, Sweden.
Nancy L Pedersen, Department of Medical Epidemiology and Biostatistics, Karolinska Institutet, Stockholm, Sweden.
Sara Hägg, Department of Medical Epidemiology and Biostatistics, Karolinska Institutet, Stockholm, Sweden.
Juulia Jylhävä, Department of Medical Epidemiology and Biostatistics, Karolinska Institutet, Stockholm, Sweden.
Declaration of Conflicts of Interest
None.
Declaration of Sources of Funding
National Institutes of Health (grant numbers R01 AG04563, AG10175, AG028555, AG08861-09); the MacArthur Foundation Research Network on Successful Aging; the Swedish Council for Working Life and Social Research (FAS/FORTE) (grant numbers 97:0147:1B to N.L.P., 2009-0795 to N.L.P.); the Swedish Research Council (grant numbers 825-2007-7460, 825-2009-6141, 521-2013-8689, 2015-03255, 2018-02077 to J.J., 2016-03081, 2019-01272 to S.H.); JPND/Swedish Research Council (2015-06796 to N.L.P.); FORTE (2013-2292 to N.L.P.); the Loo & Hans Osterman Foundation to S.H. and J.J.; the Foundation for Geriatric Diseases to S.H.; the Magnus Bergwall Foundation to S.H.; the Strategic Research Program in Epidemiology at Karolinska Institutet to S.H. and J.J. and the King Gustaf V’s and Queen Victoria’s Freemason Foundation to S.H. and China Scholarship Council to G.B. and X.L. The financial sponsors had no role in the design, execution, analysis and interpretation of data, or writing of the study.
Ethical Approval
All participants have given informed consent. This study was approved by the Regional Ethics Review Board in Stockholm (Dnr 2015/1729-31/5).
References
- 1. Clegg A, Young J, Iliffe S, Rikkert MO, Rockwood K. Frailty in elderly people. Lancet 2013; 381: 752–62. [DOI] [PMC free article] [PubMed] [Google Scholar]
- 2. Vermeiren S, Vella-Azzopardi R, Beckwee D et al. Frailty and the prediction of negative health outcomes: a meta-analysis. J Am Med Dir Assoc 2016; 17: 1163 e1–e17. [DOI] [PubMed] [Google Scholar]
- 3. Fried LP, Tangen CM, Walston J et al. Frailty in older adults: evidence for a phenotype. J Gerontol A Biol Sci Med Sci 2001; 56: M146–56. [DOI] [PubMed] [Google Scholar]
- 4. Rockwood K, Mitnitski A. Frailty in relation to the accumulation of deficits. J Gerontol A Biol Sci Med Sci 2007; 62: 722–7. [DOI] [PubMed] [Google Scholar]
- 5. Welstead M, Jenkins ND, Russ T, Luciano M, Muniz-Terrera G. A systematic review of frailty trajectories: their shape and influencing factors. Gerontologist 2020. [DOI] [PMC free article] [PubMed] [Google Scholar]
- 6. Raymond E, Reynolds CA, Dahl Aslan AK et al. Drivers of frailty from adulthood into old age: results from a 27-year longitudinal population-based study in Sweden. J Gerontol A Biol Sci Med Sci 2020; 75: 1943–50. [DOI] [PMC free article] [PubMed] [Google Scholar]
- 7. Chamberlain AM, Finney Rutten LJ, Manemann SM et al. Frailty trajectories in an elderly population-based cohort. J Am Geriatr Soc 2016; 64: 285–92. [DOI] [PMC free article] [PubMed] [Google Scholar]
- 8. Buchman AS, Wilson RS, Bienias JL, Bennett DA. Change in frailty and risk of death in older persons. Exp Aging Res 2009; 35: 61–82. [DOI] [PMC free article] [PubMed] [Google Scholar]
- 9. Stolz E, Hoogendijk EO, Mayerl H, Freidl W. Frailty changes predict mortality in four longitudinal studies of aging. Series A: J Gerontol, 2020. [DOI] [PMC free article] [PubMed] [Google Scholar]
- 10. Stow D, Matthews FE, Hanratty B. Frailty trajectories to identify end of life: a longitudinal population-based study. BMC Med 2018; 16: 171. [DOI] [PMC free article] [PubMed] [Google Scholar]
- 11. Lichtenstein P, De Faire U, Floderus B, Svartengren M, Svedberg P, Pedersen NL. The Swedish Twin Registry: a unique resource for clinical, epidemiological and genetic studies. J Intern Med 2002; 252: 184–205. [DOI] [PubMed] [Google Scholar]
- 12. Gold CH, Malmberg B, McClearn GE, Pedersen NL, Berg S. Gender and health: a study of older unlike-sex twins. J Gerontol B Psychol Sci Soc Sci 2002; 57: S168–76. [DOI] [PubMed] [Google Scholar]
- 13. McClearn GE, Johansson B, Berg S et al. Substantial genetic influence on cognitive abilities in twins 80 or more years old. Science 1997; 276: 1560–3. [DOI] [PubMed] [Google Scholar]
- 14. Finkel D, Pedersen. Processing speed and longitudinal trajectories of change for cognitive abilities: the swedish adoption/twin study of aging. Aging Neuropsychol Cogn 2004; 11: 325–45. [Google Scholar]
- 15. Searle SD, Mitnitski A, Gahbauer EA, Gill TM, Rockwood K. A standard procedure for creating a frailty index. BMC Geriatr 2008; 8: 24. [DOI] [PMC free article] [PubMed] [Google Scholar]
- 16. Liu XR, Pawitan Y, Clements MS. Generalized survival models for correlated time-to-event data. Stat Med 2017; 36: 4743–62. [DOI] [PubMed] [Google Scholar]
- 17. Liu XR, Pawitan Y, Clements M. Parametric and penalized generalized survival models. Stat Methods Med Res 2018; 27: 1531–46. [DOI] [PubMed] [Google Scholar]
- 18. Arisido MW, Antolini L, Bernasconi DP, Valsecchi MG, Rebora P. Joint model robustness compared with the time-varying covariate Cox model to evaluate the association between a longitudinal marker and a time-to-event endpoint. BMC Med Res Methodol 2019; 19: 222. [DOI] [PMC free article] [PubMed] [Google Scholar]
- 19. Li X, Ploner A, Karlsson IK et al. The frailty index is a predictor of cause-specific mortality independent of familial effects from midlife onwards: a large cohort study. BMC Med 2019; 17: 94. [DOI] [PMC free article] [PubMed] [Google Scholar]
- 20. Williams DM, Jylhava J, Pedersen NL, Hagg S. A frailty index for UK biobank participants. J Gerontol A Biol Sci Med Sci 2019; 74: 582–7. [DOI] [PMC free article] [PubMed] [Google Scholar]
- 21. Jiang M, Foebel AD, Kuja-Halkola R et al. Frailty index as a predictor of all-cause and cause-specific mortality in a Swedish population-based cohort. Aging (Albany NY) 2017; 9: 2629–46. [DOI] [PMC free article] [PubMed] [Google Scholar]
- 22. Delgado J, Bowman K, Ble A et al. Blood pressure trajectories in the 20 years before death. JAMA Intern Med 2018; 178: 93–9. [DOI] [PMC free article] [PubMed] [Google Scholar]
- 23. Gellert P, von Berenberg P, Oedekoven M et al. Centenarians differ in their comorbidity trends during the 6 years before death compared to individuals who died in their 80s or 90s. J Gerontol A Biol Sci Med Sci 2018; 73: 1357–62. [DOI] [PubMed] [Google Scholar]
- 24. Stolz E, Mayerl H, Hoogendijk EO, Armstrong JJ, Roller-Wirnsberger R, Freidl W. Acceleration of health deficit accumulation in late-life: evidence of terminal decline in frailty index three years before death in the US Health and Retirement Study. Ann Epidemiol 2021; 58: 156–61. [DOI] [PubMed] [Google Scholar]
- 25. Thompson MQ, Theou O, Tucker GR, Adams RJ, Visvanathan R. Recurrent measurement of frailty is important for mortality prediction: findings from the North West Adelaide Health Study. J Am Geriatr Soc 2019; 67: 2311–7. [DOI] [PubMed] [Google Scholar]
- 26. Theou O, O‘Connell MDL, King-Kallimanis BL, O'Halloran AM, Rockwood K, Kenny RA. Measuring frailty using self-report and test-based health measures. Age Ageing 2015; 44: 471–7. [DOI] [PMC free article] [PubMed] [Google Scholar]
- 27. Thompson MQ, Theou O, Adams RJ, Tucker GR, Visvanathan R. Frailty state transitions and associated factors in South Australian older adults. Geriatr Gerontol Int 2018; 18: 1549–55. [DOI] [PubMed] [Google Scholar]
- 28. Oude Voshaar RC, Jeuring HW, Borges MK et al. Course of frailty stratified by physical and mental multimorbidity patterns: a 5-year follow-up of 92,640 participants of the Life Lines cohort study. BMC Med 2021; 19: 29. [DOI] [PMC free article] [PubMed] [Google Scholar]
Associated Data
This section collects any data citations, data availability statements, or supplementary materials included in this article.