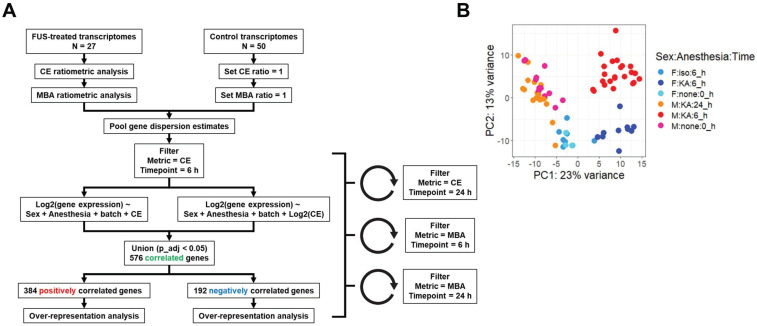
Figure 2.
Overview of dataset processing and variability. (A) Flow chart describing computational processing pipeline. Untreated and FUS treated samples from multiple studies were pooled and analyzed for contrast enhancement (CE) and microbubble activation (MBA). Linear and exponential models were fit for each prediction metric (CE or MBA) and timepoint (6 h vs 24 h post treatment), followed by bioinformatics analyses. (B) Principle components analysis of RNA-seq transcript counts after variance stabilizing transformation. Each dot represents a single sample, color coded according to the sample characteristics including sex, anesthetic, and harvest timepoint.

