Figure 6.
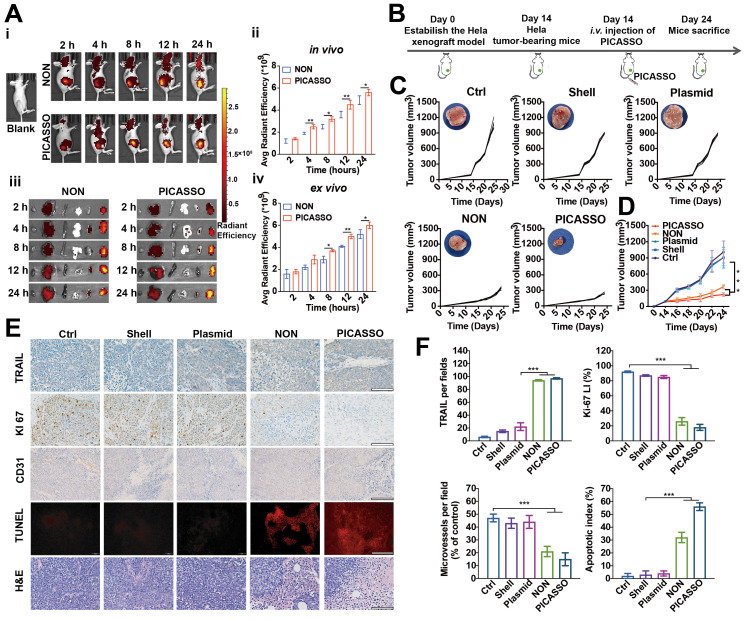
Biodistribution and anti-tumor efficacy of PICASSO in vivo. (A) Fluorescence photographs and quantitative intensity of HeLa xenograft tumor models after intravenous administration of different groups (ex vivo images from left to right: heart, liver, spleen, lung, kidney, and tumor). (B) Schematic diagram of in vivo treatment of HeLa xenograft tumor models. (C) Individual tumor growth profiles and average tumor volume (D) of mice treated with various agents. (E) IHC analyses of the expression of TRAIL, KI67, and CD31 in tumor sections from different groups as well as H&E and TUNEL staining (scale bar: 50 μm). (F) Mean TRAIL, mean Ki67 LI, microvessels density and apoptosis index in each treatment group. * p < 0.05, ** p < 0.01 and *** p < 0.001.

