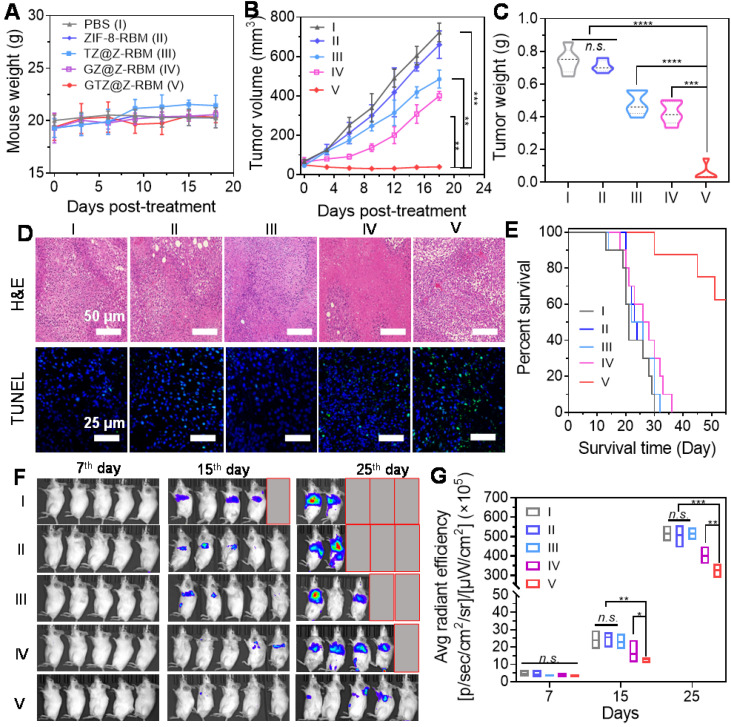
Figure 5.
In vivo cancer therapy and suppression of tumor metastasis. (A) Weight of mice (n = 5) treated with different formations. (B) Tumor volume changes of mice (n = 5) injected with different formations. (C) Tumor weight of mice on day 18 post treatment. (D) Representative H&E and TUNEL staining images of tumor tissues after different treatments. (E) Morbidity-free survival of mice with metastatic 4T1 tumors after various treatments to eliminate primary tumors. (F) In vivo bioluminescence images and (G) Quantitative analysis to track the spreading and growth of i.v. injected 4T1-luc cancer cells in different groups of mice after various treatments. Various groups are indicated: PBS (I), ZIF-8-RBM (II), TZ@Z-RBM (III), GZ@Z-RBM (IV) and GTZ@Z-RBM (V).

