Abstract
Purpose
To compare the performance of energy-integrating detector (EID) CT, photon-counting detector CT (PCCT), and high-resolution PCCT (HR-PCCT) for the visualization of coronary plaques and reduction of stent artifacts in a phantom model.
Materials and Methods
An investigational scanner with EID and PCCT subsystems was used to image a coronary artery phantom containing cylindrical probes simulating different plaque compositions. The phantom was imaged with and without coronary stents using both subsystems. Images were reconstructed with a clinical cardiac kernel and an additional HR-PCCT kernel. Regions of interest were drawn around probes and evaluated for in-plane diameter and a qualitative comparison by expert readers. A linear mixed-effects model was used to compare the diameter results, and a Shrout-Fleiss intraclass correlation coefficient was used to assess consistency in the reader study.
Results
Comparing in-plane diameter to the physical dimension for nonstented and stented phantoms, measurements of the HR-PCCT images were more accurate (nonstented: 4.4% ± 1.1 [standard deviation], stented: −9.4% ± 4.6) than EID (nonstented: 15.5% ± 4.0, stented: −19.5% ± 5.8) and PCCT (nonstented: 19.4% ± 2.5, stented: −18.3% ± 4.4). Our analysis of variance found diameter measurements to be different across image groups for both nonstented and stented cases (P < .001). HR-PCCT showed less change on average in percent stenosis due to the addition of a stent (−5.5%) than either EID (+90.5%) or PCCT (+313%). For both nonstented and stented phantoms, observers rated the HR-PCCT images as having higher plaque conspicuity and as being the image type that was least impacted by stent artifacts, with a high level of agreement (interclass correlation coefficient = 0.85).
Conclusion
Despite increased noise, HR-PCCT images were able to better visualize coronary plaques and reduce stent artifacts compared with EID or PCCT reconstructions.
Keywords: CT-Spectral Imaging (Dual Energy), Phantom Studies, Cardiac, Physics, Technology Assessment
© RSNA, 2021
Keywords: CT-Spectral Imaging (Dual Energy), Phantom Studies, Cardiac, Physics, Technology Assessment
Summary
High-resolution photon-counting CT images enable improved visualization and quantitative assessment of coronary plaques and stents as assessed in a phantom model.
Key Points
■ Photon-counting CT (PCCT) is a developing technology that can improve the visualization of coronary plaques and stents by using high-resolution imaging techniques.
■ High-resolution PCCT (HR-PCCT) images enabled more accurate measurements of coronary diameter than either photon-counting or energy-integrating CT with and without stents.
■ Physician experts in cardiac CT found HR-PCCT images to offer better plaque conspicuity and less blooming artifact than either photon-counting or energy-integrating CT.
Introduction
CT is particularly useful for the characterization of coronary plaques as a biologic marker for cardiac risk and evaluation of treatment options (1–4). Imaging of plaques requires high-resolution images to determine plaque composition and structure. Further, imaging of in-stent lumen is an important factor, which can be complicated by metal blooming artifact (5).
Recently, photon-counting detectors have been incorporated within CT systems (6). Unlike conventional energy-integrating detectors (EIDs), which use a scintillator and photodiode method to integrate detected photon signals into electrical signals, photon-counting detectors directly measure photon energy using a single semiconductor layer. Photon-counting CT (PCCT) offers several advantages over conventional CT, including improvements in contrast-to-noise ratio (CNR) (7) and reduced blooming artifact (8). Previous evaluations of coronary stents using PCCT have found that the technology can acquire images with higher resolution, reduced blooming artifact for a variety of stents, and improved luminal visibility (9–11).
Previous studies have focused on visualization of coronary stents rather than the in-stent lumen, including coronary plaques. In this work, a custom phantom mimicking a variety of plaque compositions was imaged with and without stents using an investigational scanner with EID and PCCT subsystems. Images were reconstructed using standard clinical parameters (EID, PCCT) and a specialized high-resolution PCCT (HR-PCCT) kernel with performance comparison that was based on diameter measurements and qualitative comparison by expert readers. The purpose was to compare the performance of EID, PCCT, and HR-PCCT images for the visualization of coronary plaques and reduction of stent artifacts. HR-PCCT could improve plaque diameter measurement and visualization due to more precise rendition of plaque and stent boundaries.
Materials and Methods
Investigational Scanner and Image Acquisition
An investigational CT scanner (SOMATOM CounT; Siemens Healthineers) (12,13) with EID and photon-counting subsystems was used. The A tube and detector (50-cm field of view) was identical to that in a commercial dual-source CT scanner (SOMATOM Flash; Siemens), while in the B tube and detector pair, the conventional detector was replaced with a photon-counting detector (27.5-cm field of view) (14). We used the sharp mode (15) of PCCT, which allows high resolution imaging (0.45 × 0.45-mm2 pixel aperture). Due to the reduced field of view of the B tube subsystem, an A tube data completion scan was performed to prevent truncation artifacts during reconstruction (16).
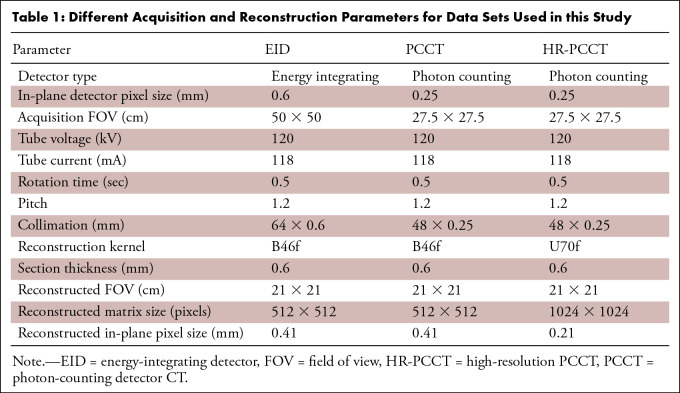
Scan parameters are listed in Table 1. The tube current was selected on the basis of tube current modulation settings for a clinical EID scan of our phantom. Collimation was 64 × 0.6 mm and 48 × 0.25 mm for EID and PCCT scans, respectively. Each scan was repeated five times and reconstructed to a 21-cm field of view and a 0.6-mm section thickness. EID and PCCT reconstructions were completed using filtered back projection with a standard cardiac EID kernel (B46f) with a 512 × 512 matrix. A high-resolution kernel (U70f) designed for HR-PCCT data and larger matrix size (1024 × 1024 pixels) was used on PCCT data. For an equitable comparison, a full-spectrum PCCT image containing signal between 25 and 120 kV was used.
Table 1:
Different Acquisition and Reconstruction Parameters for Data Sets Used in this Study
Coronary Plaque Phantom and Coronary Stents
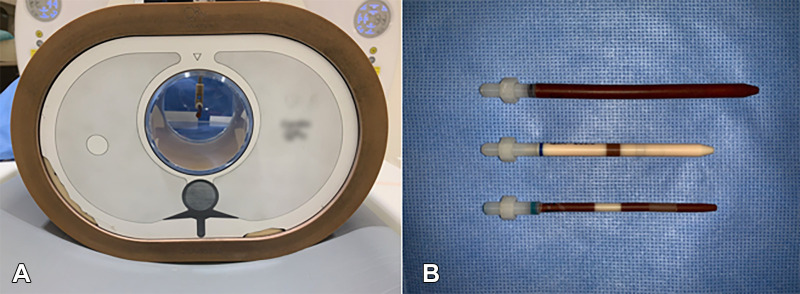
The coronary plaque phantom consisted of custom 3- or 5-mm diameter cylindrical probes (Quality Assurance in Radiology and Medicine [QRM]), each containing two or three plaque models with differing composition (fatty, fibrofatty, and calcified) and stenosis (15%–75%). The lumen within each probe mimicked iodine enhancement of about 400 HU at 120 kV. Half included a 0.75-mm-thick vessel wall around the lumen.
The probes were placed inside a water bath and thorax phantom (QRM) to simulate realistic attenuation (Fig 1). Probes were additionally fitted with pre-expanded cobalt chromium stents (Multi-Link Vision; Abbott Vascular) to match the probes (Fig 2).
Figure 1:
Coronary phantom. (A) Front view of the thorax phantom containing a probe. The thorax phantom was used to house probes and simulate realistic attenuation. (B) Three probes (top, 5-mm probe with variable plaque component; middle, 3-mm probe containing calcium; bottom, 3-mm probe containing two different stenosis models) represent variability across the data set.
Figure 2:
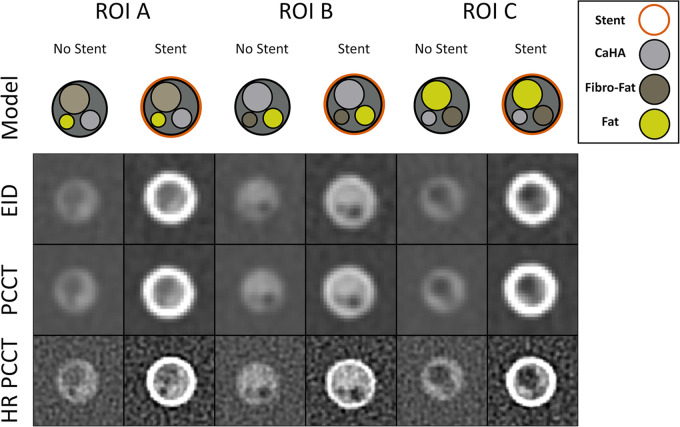
Coronary phantom content and imaging. Each column shows a different region of interest (ROI), with the detailed 5-mm probe content shown in the top row. Cross-sections of the probe at energy-integrating detector (EID; second row), photon-counting CT (PCCT; third row), and high-resolution PCCT (HR-PCCT; fourth row) with and without stents. Window and level for unstented cases was 1600 HU and 300 HU and for stented cases was 1000 HU and 250 HU, respectively.
Image Segmentation and Quantitative Analysis
Region of interest (ROI) selection and image analysis was performed using a custom image analysis program (MATLAB; Mathworks). To assess noise in the three image groups, three ROIs containing only water were drawn in each image and the standard deviation of Hounsfield unit value calculated. Calcium contrast was evaluated by drawing ROIs around each calcified insert, thresholding the calcium from background, and then calculating the difference between background and calcium. CNR was evaluated by dividing contrast and noise measurements.
Cross-sectional analysis used the 5-mm probe that had the most complex plaque structure (Fig 2). ROIs around each plaque component were segmented using a semiautomated random forest classifier (ITK-Snap, version 3.6.0). First, volumes around each plaque model in the probe were manually extracted from each image. Then, five spherical seeds were placed within the lumen at the proximal, distal, and central sections of each extracted volume. An active contour was used to grow the seeds to identify a region. This method of segmentation was chosen to include the coronary lumen but exclude the stent from the segmented region. Before analysis, a morphologic opening and closing operation was performed to fill any holes in the segmentation.
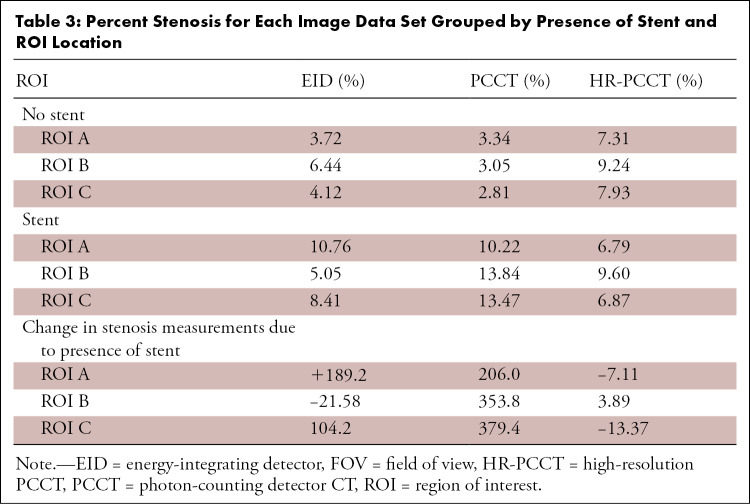
Analysis was performed using a previously described method (17,18) and carried out on a section-by-section basis, for a total of 85–370 images depending on data set and specific ROI. Briefly, a native MATLAB function (contour.m) was used to calculate isolevel contours defining the edge of the segmented lumen. The area was then calculated from the contour, and the equivalent diameter was calculated from the area. The relative percent difference between measured and physical diameter was calculated. Additionally, after removing outliers using the quartile rule, we calculated the stenosis for each image and ROI group by the following equation:
 |
Qualitative Observer Study
Three physicians with 16 (M.Y.C.), 12 (S.M.S.), and 6 (W.P.B.) years of experience interpreting cardiovascular CT participated as readers in two studies. Both studies were an alternative forced-rank design where readers were asked to rank images from each of the three reconstruction sets (EID, PCCT, HR-PCCT). In the first study, readers ranked images of nonstented probes in order of plaque conspicuity for 50 image triplets. In the second study, readers ranked images of stented probes in order of which artifact would least impinge on their ability to discern internal plaque content for 40 image triplets. The observers were blinded to the reconstruction type. A custom web application (JavaScript version 1.7) was designed to perform this study. Images were presented with a fixed window width of 1600 HU and level of 300 HU for the first task and a width of 1000 HU and level of 250 HU for the second task.
Statistical Analysis
Statistical analysis was completed using R Statistical Software (version 1.2.50; R Studio: Integrated Development Environment for R). To compare the diameter between the three investigated imaging modes, we used a linear mixed-effects model with imaging mode as a fixed effect and ROI as a random effect to account for variability across different plaques on the coronary phantom. Normality was evaluated with a Shapiro-Wilk test. One-way analysis of variance was used to compare models. We also used these parametric models to test our hypotheses by generating all pairwise comparisons among means of diameter measurements from imaging modes. This was done by using generalized linear hypothesis (glht function, R package multcomp) while testing for significant difference (19). P values were adjusted for multiple comparison for the false discovery rate (20), thus P less than .015 indicated statistical significance. Shrout-Fleiss intraclass correlation coefficient was used to assess the consistency of rankings of the observer study among the three readers (21).
Results
Quantitative Evaluation
Comparing PCCT and EID images reconstructed with a clinical cardiac kernel, PCCT and EID images yielded 31.7 HU ± 1.0 and 43.4 HU ± 1.2 noise values, respectively, exhibiting an average 27.0% lower value for PCCT compared with EID. The PCCT images had improved calcium contrast and an overall CNR improvement of 52.8% over EID (Table 2). For HR-PCCT, the noise value was 322.3 HU ± 8.1, leading to an average of 78.5% lower CNR than PCCT and 67.8% lower than EID.
Table 2:
Calcium Contrast-to-Noise Ratio for Each Image Data Set Grouped by Concentration and Size of Insert
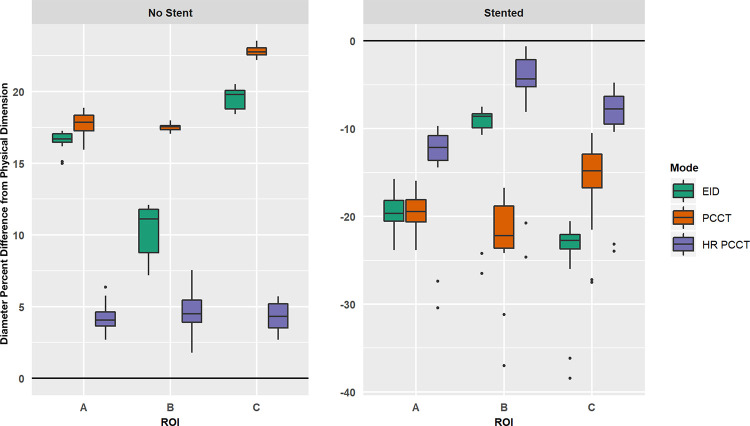
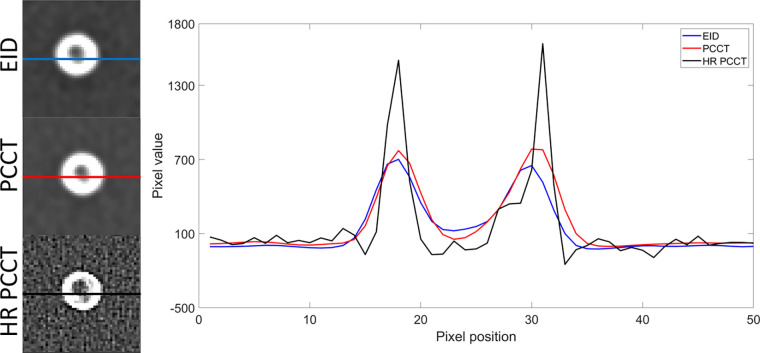
Without a stent, the measured diameter of the coronary probe was overestimated, while the presence of a stent led to the underestimation of the diameter (Fig 3). HR-PCCT images showed the least percent difference from the physical diameter (no stent: 4.4% ± 1.1, stent: −9.4% ± 4.6) when compared with EID (no stent: 15.5% ± 4.0, stent: −19.5% ± 5.8) or PCCT (no stent: 19.4% ± 2.5, stent: −18.3% ± 4.35). The Shapiro-Wilk test showed both nonstented and stented data sets were normally distributed (P < .001). Analysis of variance showed diameter measurements to be different among the three investigated image modes in both stented (P < .001) and nonstented (P < .001) cases. Pairwise comparisons showed differences in measurements of diameter between all combinations of pairs across image sets when the phantom was scanned without a stent (all adjusted, P < .001). For stented cases, measurements were different between HR-PCCT and both EID and PCCT (adjusted P < .001). There was no evidence of difference between EID and PCCT measurements (adjusted P = .2). These results are shown qualitatively for a selected case (Fig 4). HR-PCCT images showed the least change on average in stenosis due to the presence of a stent (−5.5%) when compared with EID (+90.5%) or PCCT (+313%) (Table 3).
Figure 3:
Boxplots of relative percent difference between measured and known physical dimension of coronary probes. Results shown for unstented (left) and stented (right) cases, with x-axis indicating specific region of interest (ROI). Note, the diameter was underestimated in the stented case and thus produced a negative relative percent difference. EID = energy-integrating detector, HR-PCCT = high-resolution PCCT, PCCT = photon-counting CT.
Figure 4:
Line profiles of mean intensity images in a 5-mm phantom with three plaque components. The line profiles of energy-integrating detector (EID), photon-counting CT (PCCT), and high-resolution PCCT (HR-PCCT) for the three modes are shown. HR-PCCT shows less metal artifact and better representation of internal plaque components as seen in the middle of the image.
Table 3:
Percent Stenosis for Each Image Data Set Grouped by Presence of Stent and ROI Location
Qualitative Observer Study
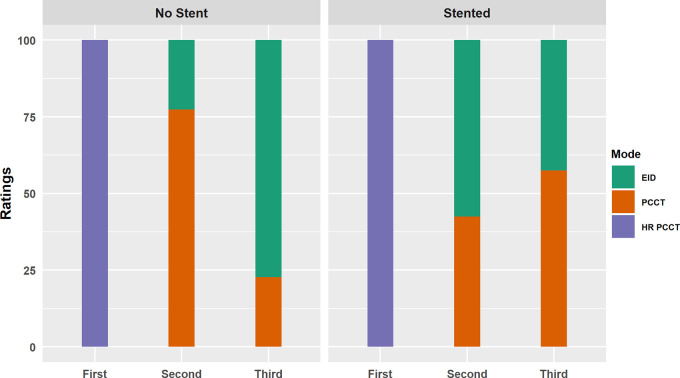
Next, a reader study was performed to assess which images had higher plaque conspicuity (for nonstented probes) and which images had the least impeding artifacts for discerning internal plaque content (for stented probes). For both tasks, all three readers ranked the HR-PCCT images first (Fig 5). For the nonstented task, two of the three readers rated PCCT images as having higher plaque conspicuity over EID images, ranking them second for 62% and 92% of cases. The third reader ranked them equally, with PCCT images ranked second in 50% of cases. For the stented task, two readers rated EID higher over PCCT, with EID ranking second in 58% and 78% of cases, while the third reader ranked PCCT second in 63% of cases. Intraclass correlation coefficient was 0.85, indicating a high level of consistency across readers.
Figure 5:
Aggregated results of the observer studies for the unstented (left) and stented (right) cases. For unstented cases, observers were asked to select the image that had the highest plaque conspicuity. For the stented cases, observers were asked to select the image that was least impacted by stent artifact. Rating shown on the x-axis, with each bar representing the percentage of each image mode receiving that score. EID = energy-integrating detector, HR-PCCT = high-resolution PCCT, PCCT = photon-counting CT.
Discussion
In this study, we aimed to determine the impact of an HR-PCCT kernel for assessing coronary plaques imaged with and without stents in a phantom model. Our study was designed to complement prior studies of stent visualization with PCCT (9–11). PCCT technology was shown to have both quantitative and qualitative advantages over EID. HR-PCCT reconstructions showed the highest overall performance in quantitative evaluation of lumen diameter. We attribute this improvement to two factors. First, high-resolution images had a more precise rendition of the high-contrast shape boundaries and lengths, even at the cost of noisier images. Second, the high-resolution images were less susceptible to metal blooming artifacts, which translated into better preservation of coronary shape and estimation of dimensions. This finding was directly reflected in the stenosis measurements, in which HR-PCCT had the least error between stented and nonstented cases among the three modes.
HR-PCCT images were also preferentially selected in qualitative evaluation across all readers for both plaque conspicuity and stent artifact reduction. Despite the increased noise in the high-resolution images, better delineation of plaque boundaries and reduced blooming artifact led to higher qualitative image quality. When comparing EID and PCCT results, PCCT showed an advantage for plaque conspicuity, but neither had a notable advantage for stent artifact reduction. Thus, the noise and contrast advantages of PCCT over EID scans would not necessarily translate into improved clinical performance. However, these results are still encouraging for PCCT, as most radiologists are naturally biased toward familiar imaging technology over a new one that might render the image in an unfamiliar fashion.
We found similar results in our study compared with previous studies about imaging cardiac stents with PCCT. Mannil et al (9) used an identical PCCT system to compare EID and PCCT images of stents reconstructed with the B46f kernel. They found comparable image quality between the two, although PCCT offered an advantage in terms of in-stent diameter and attenuation. Von Spiczak et al (10) compared PCCT images with several high-resolution reconstructions, including iterative reconstruction, and found that these produced noisier images with more accurate in-stent diameter and attenuation measurements. While we used a different high-resolution kernel (U70f vs D70f or I70f), our findings agree with the results of both studies. Symons et al (22) used the same scanner with a different set of kernels to study several stents and found that an HR-PCCT reconstruction had noisier images with better lumen visualization, while EID and PCCT reconstructions with similar kernels produced similar results. Finally, Bratke et al (11) and Sigovan et al (23) used a different prototype system and found that PCCT images had a larger lumen diameter, less noise, and better qualitative results than EID images. Our findings agree with these prior studies, although the differences between investigational and prototype scanners means that the relationship between EID and PCCT can be affected by other external factors.
There were study limitations related to the investigational nature of the scanner. The EID subsystem was not equipped with electrocardiographic gating, which limits the comparison to stationary images. While motion would degrade image quality, we would expect a similar level of degradation for both EID and PCCT images with comparable temporal resolution, thus preserving the relative advantage of PCCT technology. Also, the reconstruction and acquisition were based on current clinical practice for EID. The study relied on filtered back projection, as iterative image reconstruction kernels were not optimized for PCCT data. The image segmentation could have an impact on the quantitative findings; however, the same algorithm was used for all acquisitions. Future development of PCCT could offer higher performance for visualizing and quantifying coronary plaques and stents, especially with the incorporation of other techniques such as beam filtration and material decomposition. As this was a proof-of-concept study, only one type of stent was studied. We would expect similar results for other stents with variation attributable to differences in composition and structure.
The higher spatial resolution of the PCCT detector offers potential for improved plaque characterization and the evaluation of in-stent restenosis. Despite increased noise, HR-PCCT images showed more accurate characterization of coronary diameter in the absence and presence of stents in a phantom model. Additionally, clinicians found HR-PCCT images to have increased plaque conspicuity and reduced stent blooming artifact when compared with PCCT or EID images.
Supported in part by the National Institutes of Health (NIH) Clinical Center Radiology and Imaging Sciences, the National Institute of Biomedical Imaging and Bioengineering (grant no. R01 EB001838), NIH Graduate Partnership Program, and the NIH Intramural Research Program (grant nos. NIH Z01 1ZID BC011242, CL040015, and 1ZIAHL006220).
The NIH and Siemens Medical Solutions have a Cooperative Research and Development Agreement providing material support, including the photon-counting CT system.
Disclosures of conflicts of interest: J.R.R. No relevant relationships. F.F. No relevant relationships. T.R. No relevant relationships. M.N. No relevant relationships. P.S. No relevant relationships. S.M.S. No relevant relationships. W.P.B. No relevant relationships. B.S. No relevant relationships. A.A.M. No relevant relationships. W.F.P. Grants or contracts from Philips and Boston Scientific (Cooperative Research and Development Agreements with NIH). E.C.J. No relevant relationships. E.S. Relationships unrelated to the present publication: GE, Siemens, Imalogix, 12Sigma, SunNuclear, Nanox, Metis Health Analytics, Cambridge University Press, and Wiley and Sons. M.Y.C. No relevant relationships.
Abbreviations:
- CNR
- contrast-to-noise ratio
- EID
- energy-integrating detector CT
- HR-PCCT
- high-resolution PCCT
- PCCT
- photon-counting CT
- QRM
- Quality Assurance in Radiology and Medicine
- ROI
- region of interest
References
- 1. Motoyama S , Ito H , Sarai M , et al . Plaque characterization by coronary computed tomography angiography and the likelihood of acute coronary events in mid-term follow-up . J Am Coll Cardiol 2015. ; 66 ( 4 ): 337 – 346 . [DOI] [PubMed] [Google Scholar]
- 2. Motoyama S , Sarai M , Harigaya H , et al . Computed tomographic angiography characteristics of atherosclerotic plaques subsequently resulting in acute coronary syndrome . J Am Coll Cardiol 2009. ; 54 ( 1 ): 49 – 57 . [DOI] [PubMed] [Google Scholar]
- 3. Motoyama S , Sarai M , Narula J , Ozaki Y . Coronary CT angiography and high-risk plaque morphology . Cardiovasc Interv Ther 2013. ; 28 ( 1 ): 1 – 8 . [DOI] [PubMed] [Google Scholar]
- 4. Nikolaou K , Alkadhi H , Bamberg F , Leschka S , Wintersperger BJ . MRI and CT in the diagnosis of coronary artery disease: indications and applications . Insights Imaging 2011. ; 2 ( 1 ): 9 – 24 . [DOI] [PMC free article] [PubMed] [Google Scholar]
- 5. Ghekiere O , Salgado R , Buls N , et al . Image quality in coronary CT angiography: challenges and technical solutions . Br J Radiol 2017. ; 90 ( 1072 ): 20160567 . [DOI] [PMC free article] [PubMed] [Google Scholar]
- 6. Willemink MJ , Persson M , Pourmorteza A , Pelc NJ , Fleischmann D . Photon-counting CT: technical principles and clinical prospects . Radiology 2018. ; 289 ( 2 ): 293 – 312 . [DOI] [PubMed] [Google Scholar]
- 7. Gutjahr R , Halaweish AF , Yu Z , et al . Human imaging with photon counting-based computed tomography at clinical dose levels: Contrast-to-noise ratio and cadaver studies . Invest Radiol 2016. ; 51 ( 7 ): 421 – 429 . [DOI] [PMC free article] [PubMed] [Google Scholar]
- 8. Zhou W , Bartlett DJ , Diehn FE , et al . Reduction of metal artifacts and improvement in dose efficiency using photon-counting detector computed tomography and tin filtration . Invest Radiol 2019. ; 54 ( 4 ): 204 – 211 . [DOI] [PMC free article] [PubMed] [Google Scholar]
- 9. Mannil M , Hickethier T , von Spiczak J , et al . Photon-counting CT: high-resolution imaging of coronary stents . Invest Radiol 2018. ; 53 ( 3 ): 143 – 149 . [DOI] [PubMed] [Google Scholar]
- 10. von Spiczak J , Mannil M , Peters B , et al . Photon counting computed tomography with dedicated sharp convolution kernels: tapping the potential of a new Technology for Stent Imaging . Invest Radiol 2018. ; 53 ( 8 ): 486 – 494 . [DOI] [PubMed] [Google Scholar]
- 11. Bratke G , Hickethier T , Bar-Ness D , et al . Spectral photon-counting computed tomography for coronary stent imaging: Evaluation of the potential clinical impact for the delineation of in-stent restenosis . Invest Radiol 2020. ; 55 ( 2 ): 61 – 67 . [DOI] [PubMed] [Google Scholar]
- 12.Kappler S, Glasser F, Janssen S, Kraft E, Reinwand M. A research prototype system for quantum-counting clinical CT. In: Editor A, Editor B, eds. Proceedings of SPIE: medical imaging 2010—physics of medical imaging. Vol 7622. Bellingham, Wash: International Society for Optics and Photonics, 2010; 76221Z. [Google Scholar]
- 13. Kappler S , Hannemann T , Kraft E , et al . First results from a hybrid prototype CT scanner for exploring benefits of quantum-counting in clinical CT . In: Editor A , Editor B , eds. Proceedings of SPIE: medical imaging 2012—physics of medical imaging . Vol 8313 . Bellingham, Wash: : International Society for Optics and Photonics; , 2012. ; 83130X . [Google Scholar]
- 14. Yu Z , Leng S , Jorgensen SM , et al . Evaluation of conventional imaging performance in a research whole-body CT system with a photon-counting detector array . Phys Med Biol 2016. ; 61 ( 4 ): 1572 – 1595 . [DOI] [PMC free article] [PubMed] [Google Scholar]
- 15.Leng S, Gutjahr R, Ferrero A, et al. Ultra-high spatial resolution multi-energy CT using photon counting detector technology. In: Editor A, Editor B, eds. Proceedings of SPIE: medical imaging 2017—physics of medical imaging. Vol 10132. Bellingham, Wash: International Society for Optics and Photonics, 2017; 101320Y. [DOI] [PMC free article] [PubMed] [Google Scholar]
- 16. Yu Z , Leng S , Li Z , et al . How low can we go in radiation dose for the data-completion scan on a research whole-body photon-counting computed tomography system . J Comput Assist Tomogr 2016. ; 40 ( 4 ): 663 – 670 . [DOI] [PMC free article] [PubMed] [Google Scholar]
- 17.Richards T, Segars P, Samei E. Variability of stenosis characterization: impact of coronary vessel motion in cardiac CT. In: Editor A, Editor B, eds. Proceedings of SPIE: medical imaging 2018—title. Vol 10573. Bellingham, Wash: International Society for Optics and Photonics, 2018; 105733Z. [Google Scholar]
- 18. Richards T , Sturgeon GM , Ramirez-Giraldo JC , et al . Quantification of uncertainty in the assessment of coronary plaque in CCTA through a dynamic cardiac phantom and 3D-printed plaque model . J Med Imaging (Bellingham) 2018. ; 5 ( 1 ): 013501 . [DOI] [PMC free article] [PubMed] [Google Scholar]
- 19. Hothorn T , Bretz F , Westfall P . Simultaneous inference in general parametric models . Biom J 2008. ; 50 ( 3 ): 346 – 363 . [DOI] [PubMed] [Google Scholar]
- 20. Benjamini Y , Hochberg Y . Controlling the false discovery rate: a practical and powerful approach to multiple testing . J R Stat Soc Ser B Methodol 1995. ; 57 ( 1 ): 289 – 300 . [Google Scholar]
- 21. Shrout PE , Fleiss JL . Intraclass correlations: uses in assessing rater reliability . Psychol Bull 1979. ; 86 ( 2 ): 420 – 428 . [DOI] [PubMed] [Google Scholar]
- 22. Symons R , De Bruecker Y , Roosen J , et al . Quarter-millimeter spectral coronary stent imaging with photon-counting CT: Initial experience . J Cardiovasc Comput Tomogr 2018. ; 12 ( 6 ): 509 – 515 . [DOI] [PubMed] [Google Scholar]
- 23. Sigovan M , Si-Mohamed S , Bar-Ness D , et al . Feasibility of improving vascular imaging in the presence of metallic stents using spectral photon counting CT and K-edge imaging . Sci Rep 2019. ; 9 ( 1 ): 19850 . [DOI] [PMC free article] [PubMed] [Google Scholar]


