

Abstract
Objective: Increased hemoglobin (Hb) A2 level is an important diagnostic marker for β-thalassemia carrier screening. The level of Hb A2 is also useful for differentiating several thalassemia syndromes. We have examined data bases for reduced Hb A2 expression in a large cohort of Thai subjects. Methods: A study was done on 1,498 subjects with non-thalassemia and various types of thalassemia and Hb variants to determine the effect of thalassemia genotypes and on 103 women of reproductive age to determine the effect of iron deficiency. Hb analysis was done using capillary electrophoresis, and thalassemia genotypes were defined by DNA analysis. Serum ferritin was measured using chemiluminescent microparticle immunoassay. Results: Subjects were divided into 35 groups based on iron status, Hb, and DNA analysis. Decreased Hb A2 level was observed in those with Hb Q-Thailand, δ-hemoglobinopathies, δβ0-thalassemia, Hb Lepore, iron deficiency, α-thalassemia, and especially Hb Constant Spring (Hb CS). While β-thalassemia carriers with Hb H disease still had elevated Hb A2 levels, most of the β-thalassemia carriers with Hb H-CS disease had Hb A2 less than 3.5% as a diagnostic cut-off. The lowest Hb A2 level was observed in those with Hb H-CS disease. Conclusion: Iron deficiency, Hb CS trait, homozygous Hb CS, and Hb H disease may reduce Hb A2 level, leading possibly to misdiagnosis of β-thalassemia, especially in carriers with borderline Hb A2. Hb CS showed the strongest effect on Hb A2 expression. Understanding the basis for reduced Hb A2 expression may help reduce the diagnostic pitfalls of β-thalassemia in the region.
Keywords: Thalassemia, Hb A2 level, Hb constant spring, Hb H disease, β-thalassemia, iron deficiency
Introduction
Hb A (α2β2) is the major Hb component of normal humans after the age of 1-year old, composing more than 96% of total Hb, followed by 2.5-3.5% of Hb A2 (α2δ2) and less than 1.0% of Hb F (α2γ2). An increased Hb A2 level to more than 3.5% has been used as a marker of a β-thalassemia carrier. Many factors in both acquired and inherited conditions can affect Hb A2 level. Hyperthyroidism, megaloblastic anemia, antiretroviral therapy, homozygous Hb S with α-thalassemia, some unstable hemoglobin variants, triplicated α gene (ααα), pseudoxanthoma elasticum, and hypertrophic osteoarthropathy have been associated with elevated Hb A2 level, leading to a false positive for β-thalassemia screening and difficulty with genetic counseling. In contrast, severe iron deficiency anemia, sideroblastic anemia, silent β-thalassemia alleles, δ-thalassemia, δβ-thalassemia, α-chain variants, δ-chain variants, Hb H disease, hereditary persistence of fetal Hb, Hb Lepore, and erythroleukemia have been associated with decreased Hb A2 level. These could interfere with screening for β-thalassemia carrier, affecting a prevention and control program of thalassemia [1,2]. Although this is an important issue in operating a prevention and control program, few systematic studies have been conducted in each population. We describe in this study, for the first time in Thailand, the genetic and non-genetic bases for reduced Hb A2 expression in a large cohort of Thai individuals.
Materials and methods
Subjects
Ethical approval of the study protocol was obtained from the Institutional Review Board (IRB) of Khon Kaen University, Khon Kaen, Thailand (HE612242). Retrospective data at the thalassemia service unit of the Centre for Research and Development of Medical Diagnostic Laboratories (CMDL), Faculty of Associated Medical Sciences, Khon Kaen University, Thailand, were collected from a total of 1,498 unrelated subjects. These included subjects with non-thalassemia, α-thalassemia, δ-thalassemia, δ-globin chain variants, δβ0-thalassemia, Hb variants, β-thalassemia, and Hb E carriers. Complete blood count was performed using a standard blood cell counter. Hb analysis was performed using capillary electrophoresis (CapillaryS 2; Sebia, Lisses, France).
Iron status
Iron deficiency was examined in 103 women of reproductive age, including 60 subjects with non-thalassemia and 43 carriers of Hb E (HBB: c.79G>A). Serum ferritin (SF) was measured by the chemiluminescent microparticle immunoassay (CMIA) (Abbott Laboratories, Inc.). Samples with possible infection and/or inflammation were excluded by C-reactive protein level (CRP) using CRP Latex Test Kit (Plasmatec Laboratory Products Ltd.). Iron deficiency (ID) was defined as SF less than 15 µg/L; and iron deficiency anemia (IDA) was described as SF less than 15 µg/L and Hb less than 12.0 g/dL [3].
DNA analysis
Common α-thalassemia --SEA, --THAI , -α3.7, -α4.2, Hb Constant Spring (HBA2: c.427T>C) and Hb Pakse’ (HBA2: c.429A>T), α globin gene triplication (ααα), δ-hemoglobinopathies, high Hb F determinants, Hb variants, and β-thalassemia mutations found in Thailand were identified routinely using PCR-related techniques as described elsewhere [4-9].
Statistical analysis
Data were analyzed using the STATATM version 10.0 (Stata Corp, Texas, USA). Due to non-normal distribution of many variables, non-parametric statistics were applied. Hematologic differences among three or more groups were tested with the Kruskal-Wallis test. The differences between the two independent groups were subsequently analyzed by the Mann-Whitney U test. Statistical significance was set at P value <0.05.
Results
Due to the diverse molecular heterogeneity of thalassemia in Thailand, subjects can be divided into 35 different groups according to iron status and globin genotypes. Table 1 reveals all hematologic parameters and results of Hb analysis using capillary electrophoresis of all groups. Figure 1 specifically shows the comparison of Hb A2 in these groups of subjects. Subjects with non-thalassemia (group 1) had, as expected, normal hematologic features with Hb A2 2.75±0.28%. Significant reduction in Hb A2 levels was observed in groups 2-6 for Hb Q-Thailand (HBA1: c.223G>C), δ-hemoglobinopathies, δβ0-thalassemia, and Hb Lepore. In each group, this was associated with reduced mean corpuscular volume (MCV) and mean corpuscular Hb (MCH). A reduction in Hb A2 as compared to the non-thalassemia group was also observed in α-thalassemia in groups 7-12. In these groups of α-thalassemia, descending order of Hb A2 reduction was observed for α+-thalassemia trait, α0-thalassemia trait, Hb CS trait, homozygous Hb CS, Hb H disease, and Hb H-CS disease. Interestingly, although Hb CS is a non-deletional α+-thalassemia allele, it was associated with a lower Hb A2 expression as compared to α0-thalassemia. This is also the case for β-thalassemia trait (groups 13-19) in which greater reduction in Hb A2 expression was observed for β-thalassemia trait with Hb CS trait (group 16; 5.43±0.68%), β-thalassemia trait with homozygous Hb CS (group 17; 3.8%) and β-thalassemia trait with Hb H-CS disease (group 19; 3.16±0.33%) as compared to those of plain β-thalassemia traits (group 13; 5.74±0.63%). In contrast, no significant difference in Hb A2 expression was observed for patients who were double heterozygotes for β-thalassemia and α+-thalassemia (group 14; 5.80±0.67%) and double heterozygotes for β-thalassemia and α0-thalassemia (group 15; 5.74±0.76%), as compared to the plain β-thalassemia trait mentioned above. It is noteworthy that although patients with β-thalassemia trait with Hb H disease had Hb A2 within the diagnostic range for β-thalassemia (group 18; 4.23±0.33%), those with Hb H-CS disease had Hb A2 less than the diagnostic cut-off for β-thalassemia carrier (Hb A2>3.5%). Detailed hematologic features of these subjects with β-thalassemia trait/Hb H disease (cases BH1-4) and β-thalassemia trait/Hb H-CS disease (cases BH5-9) are listed in Table 2. It is not unexpected that a combination of β-thalassemia trait and δ-hemoglobinopathies (groups 20 & 21) could lead to normal Hb A2 β-thalassemia as described previously [6]. We observed a slight reduction in Hb A2 expression in double heterozygous β-thalassemia/Hb Q-Thailand (group 22; 5.13±0.21 %), but still within the diagnostic range for the β-thalassemia trait.
Table 1.
Hematologic features of subjects with non-thalassemia, various thalassemia genotypes, and Hb E with or without iron deficiency. Values are presented as mean ± standard deviation or as raw data where appropriate
| No | Groups | α-genotype | β-genotype | n | Hb A2 (%) | Hb E (%) | Hb F (%) | Hb Bart’s (%) | Hb H (%) | Hb ConSp (%) | Abn Hb (%) | Hb A2’ (%) | RBC (1012/L) | Hb (g/dL) | HCT (%) | MCV (fL) | MCH (pg) |
|
| |||||||||||||||||
| 1 | Non-thal | αα/αα | βA/βA | 192 | 2.75±0.28a | 0 | 0.1±0.3 | 0 | 0 | 0 | 0 | 0 | 4.9±0.4 | 14.0±1.3 | 42.1±3.9 | 86.4±5.4 | 28.8±2.0 |
| 2 | Hb Q-Thailand trait | -αQT/αα | βA/βA | 42 | 1.89±0.17a | 0 | * | 0 | 0 | 0 | 26.7±4.4* | 0.7±0.1 | 5.0±0.7 | 13.0±1.7 | 40.0±5.2 | 79.0±6.0 | 25.8±1.7 |
| 3 | δ-thal trait | αα/αα | βA/βA, δth/δA | 10 | 1.40±0.39a | 0 | 0.1±0.4 | 0 | 0 | 0 | 0 | 0 | 4.8±0.5 | 12.8±2.3 | 39.6±6.7 | 81.7±8.7 | 26.4±3.3 |
| 4 | δ-chain variant | αα/αα | βA/βA, δX/δA | 9 | 1.29±0.21a | 0 | 0.1±0.1 | 0 | 0 | 0 | 0 | 0.9±0.2 | 4.8±0.6 | 12.8±1.9 | 39.1±6.4 | 80.8±8.6 | 26.5±2.5 |
| 5 | db0-thal trait | αα/αα | δβ0/βA | 55 | 2.25±0.32a | 0 | 22.1±5.2 | 0 | 0 | 0 | 0 | 0 | 4.7±0.7 | 11.9±1.6 | 36.6±4.7 | 76.6±4.6 | 24.8±1.7 |
| 6 | Hb Lepore trait | αα/αα | δβ+/βA | 27 | 2.34±0.23a | 0 | 2.9±1.3 | 0 | 0 | 0 | 10.2±1.3 | 0 | 5.5±0.7 | 12.2±1.4 | 39.0±4.0 | 70.7±3.7 | 22.2±1.1 |
|
| |||||||||||||||||
| 7 | α+-thal trait | -α/αα | βA/βA | 81 | 2.60±0.26a,b | 0 | 0.2±0.4 | 0 | 0 | 0 | 0 | 0 | 4.8±0.6 | 12.5±1.3 | 38.6±4.5 | 80.4±5.0 | 26.2±2.1 |
| 8 | α0-thal trait | --/αα | βA/βA | 112 | 2.36±0.20a,c | 0 | 0.1±0.3 | 0 | 0 | 0 | 0 | 0 | 5.7±0.7 | 11.8±1.5 | 37.6±4.8 | 66.4±3.8 | 20.9±1.4 |
| 9 | Hb ConSp trait | αCSα/αα | βA/βA | 125 | 2.21±0.27a,b | 0 | 0.3±0.6 | 0 | 0 | 0.5±0.2 | 0 | 0 | 5.0±0.6 | 12.8±1.6 | 39.5±4.8 | 79.5±5.3 | 25.9±2.3 |
| 10 | Homozygous Hb CS | αCSα/αCSα | βA/βA | 28 | 1.34±0.21a,c | 0 | 1.5±1.9 | 0.1±0.3 | 0 | 4.6±0.8 | 0 | 0.4±0.2 | 4.3±0.5 | 10.7±1.3 | 34.3±4.1 | 78.9±5.5 | 24.5±1.7 |
| 11 | Hb H disease | --/-α | βA/βA | 52 | 1.06±0.28a,d | 0 | 0.3±0.6 | 0.5±0.9 | 2.2±2.8 | 0 | 0 | 0 | 5.1±0.9 | 9.2±1.4 | 29.9±5.3 | 58.7±6.8 | 17.9±1.5 |
| 12 | Hb H-CS disease | --/αCSα | βA/βA | 25 | 0.57±0.20a,d | 0 | 0.4±0.8 | 1.7±1.9 | 8.4±5.3 | 2.5±1.0 | 0 | 0.1±0.1 | 4.2±0.9 | 8.3±1.6 | 29.6±5.6 | 70.3±6.6 | 19.6±1.6 |
|
| |||||||||||||||||
| 13 | β-thal trait | αα/αα | βth/βA | 318 | 5.74±0.63e | 0 | 1.3±1.0 | 0 | 0 | 0 | 0 | 0 | 5.5±0.9 | 11.5±1.8 | 35.7±5.4 | 64.7±4.9 | 20.8±1.9 |
| 14 | β-thal trait with α+-thal | -α/αα | βth/βA | 87 | 5.80±0.67f | 0 | 1.3±1.3 | 0 | 0 | 0 | 0 | 0 | 5.3±0.8 | 11.6±1.7 | 35.7±5.4 | 67.7±5.0 | 22.0±2.4 |
| 15 | β-thal trait with α0-thal | --/αα | βth/βA | 22 | 5.74±0.76 | 0 | 1.1±1.1 | 0 | 0 | 0 | 0 | 0 | 5.3±0.9 | 11.9±1.8 | 37.2±5.6 | 69.7±4.7 | 22.7±1.9 |
| 16 | β-thal trait with Hb CS trait | αCSα/αα | βth/βA | 34 | 5.43±0.68e,f | 0 | 1.3±1.1 | 0 | 0 | 0.1±0.2 | 0 | 0 | 5.7±0.9 | 12.9±1.7 | 39.9±5.5 | 70.8±5.7 | 23.1±2.3 |
| 17 | β-thal trait with homozygous Hb CS | αCSα/αCSα | βth/βA | 1 | 3.8 | 0 | 1.7 | 0 | 0 | 1.6 | 0 | 0 | 3.5 | 8.2 | 24.5 | 69.2 | 23.0 |
| 18 | β-thal trait with Hb H disease | --/-α | βth/βA | 4 | 4.23±0.33e,g | 0 | 9.0±5.0 | 0.4±0.2 | 0 | 0 | 0 | 0 | 5.1±1.9 | 9.3±0.5 | 28.3±2.3 | 54.8±2.4 | 18.1±1.4 |
| 19 | β-thal trait with Hb H-CS disease | --/αCSα | βth/βA | 5 | 3.16±0.33e,g | 0 | 1.5±0.7 | 0.9±0.9 | 0 | 1.6±0.5 | 0 | small | 4.9±0.6 | 8.4±1.2 | 29.2±3.1 | 59.6±8.3 | 17.0±1.7 |
| 20 | β-thal trait with δ-thal | αα/αα | βth/βA, δth/δA | 1 | 2.6 | 0 | 5.7 | 0 | 0 | 0 | 0 | 0 | 4.3 | 8.1 | 29.4 | 69.0 | 19.0 |
| 21 | β-thal with δ-chain variant | αα/αα | βth/βA, dX/dA | 1 | 2.1 | 0 | 1.9 | 0 | 0 | 0 | 0 | 2.2 | na | na | na | 60.0 | 20.3 |
| 22 | β-thal with Hb Q-Thailand | -αQT/αα | βth/βA | 3 | 5.13±0.21 | 0 | * | 0 | 0 | 0 | 16.0±0.9* | 1.6±0.9 | 4.8 | 10.0 | 31.3 | 65.3 | 20.8 |
|
| |||||||||||||||||
| 23 | Hb E trait | αα/αα | βE/βA | 78 | 3.83±0.33h | 25.5±1.0 | 0.4±0.6 | 0 | 0 | 0 | 0 | 0 | 5.0±0.8 | 13.0±1.2 | 40.2±3.6 | 75.9±5.6 | 25.0±1.9 |
| 24 | Hb E trait with α+-thal | -α/αα | βE/βA | 32 | 3.82±0.33i | 23.7±1.3 | 0.3±0.8 | 0 | 0 | 0 | 0 | 0 | 5.7±0.6 | 14.7±1.6 | 44.6±4.4 | 78.1±3.1 | 25.6±0.9 |
| 25 | Hb E trait with α0-thal | --/αα | βE/βA | 51 | 4.06±0.27h,j | 16.2±0.8 | 0.5±0.7 | 0 | 0 | 0 | 0 | 0 | 5.7±0.7 | 12.1±1.6 | 37.9±4.8 | 67.3±3.0 | 21.6±1.0 |
| 26 | Hb E trait with Hb CS trait | αCSα/αα | βE/βA | 46 | 3.47±0.23h,i | 22.8±1.2 | 0.5±0.5 | 0 | 0 | 0.1±0.3 | 0 | 0 | 4.7±0.6 | 12.7±1.7 | 39.0±4.9 | 82.0±3.5 | 26.8±1.6 |
| 27 | Hb E trait with homozygous Hb CS | αCSα/αCSα | βE/βA | 9 | 2.40±0.20h,j | 18.4±0.9 | 1.4±0.6 | 0 | 0 | 3.8±0.6 | 0 | 0.8±0.3** | 5.0±0.3 | 11.8±0.9 | 36.2±3.1 | 74.3±4.4 | 24.1±1.3 |
| 28 | AEBart’s disease | --/-α | βE/βA | 17 | 3.55±0.40k | 11.5±0.9 | 1.9±2.3 | 0.3±0.4 | 0 | 0 | 0 | 0 | 5.6±0.9 | 9.1±1.2 | 28.3±4.4 | 50.6±3.7 | 16.3±1.5 |
| 29 | CS AEBart’s disease | --/αCSα | βE/βA | 31 | 2.17±0.29h,k | 11.4±1.6 | 1.9±1.8 | 1.5±1.3 | 0 | 1.6±0.7 | 0 | 0.3±0.2** | 4.3±0.7 | 7.3±0.9 | 25.0±3.2 | 57.3±6.8 | 16.8±1.5 |
|
| |||||||||||||||||
| 30 | Non-thal | αα/αα | βA/βA | 22 | 2.65±0.20l | 0 | 0.2±0.7 | 0 | 0 | 0 | 0 | 0 | 4.6±0.4 | 13.1±0.9 | 39.1±2.7 | 84.7±4.9 | 28.3±1.9 |
| 31 | Non-thal with ID | αα/αα | βA/βA | 10 | 2.46±0.23l,m | 0 | 0.2±0.6 | 0 | 0 | 0 | 0 | 0 | 5.0±0.3 | 12.4±0.3 | 39.1±1.2 | 78.5±2.8 | 25.0±1.5 |
| 32 | Non-thal with IDA | αα/αα | βA/βA | 28 | 2.29±0.31l,m | 0 | 0.1±0.1 | 0 | 0 | 0 | 0 | 0 | 4.6±0.3 | 10.8±0.9 | 34.5±2.7 | 74.6±6.2 | 23.3±2.3 |
| 33 | Hb E trait | αα/αα | βE/βA | 32 | 3.44±0.30n | 25.1±1.0 | 0.2±0.4 | 0 | 0 | 0 | 0 | 0 | 5.0±0.5 | 12.7±1.0 | 38.8±3.3 | 77.8±3.7 | 25.4±1.4 |
| 34 | Hb E trait with ID | αα/αα | βE/βA | 3 | 3.13±0.35 | 24.7±1.1 | 0 | 0 | 0 | 0 | 0 | 0 | 5.1±0.3 | 12.8±1.2 | 39.7±3.4 | 77.4±1.8 | 25.0±0.9 |
| 35 | Hb E trait with IDA | αα/αα | βE/βA | 9 | 3.13±±0.41n | 24.3±1.8 | 0.2±0.5 | 0 | 0 | 0 | 0 | 0 | 4.7±0.4 | 10.8±1.1 | 34.0±2.6 | 72.4±8.2 | 23.0±3.2 |
Abbreviation: na, not available; CS, Hb Constant Spring; thal, thalassemia; ID, iron deficiency; IDA, iron deficiency anemia; QT, Hb Q-Thailand.
Significant difference from non-thalassemia (P<0.0001; Mann-Whitney U test).
Significant difference between α+-thal and Hb CS carrier (P<0.0001; Mann-Whitney U test).
Significant difference between α0-thal trait and homozygous Hb CS (P<0.0001; Mann-Whitney U test).
Significant difference between Hb H-disease and Hb H-CS disease (P<0.0001; Mann-Whitney U test).
Significant difference from β-thal trait (β-thal trait with Hb CS with P=0.0047, β-thal trait with Hb H-disease with P=0.0008 and β-thal trait with Hb H-CS disease with P=0.0001; Mann-Whitney U test).
Significant difference between β-thal trait with α+-thal and β-thal trait with Hb CS (P=0.0088; Mann-Whitney U test).
Significant difference between β-thal trait with Hb H disease and β-thal trait with Hb H-CS disease (P=0.0139; Mann-Whitney U test).
Significant difference from Hb E trait (P<0.0001; Mann-Whitney U test).
Significant difference between Hb E trait with α+-thal and Hb E trait with Hb CS trait (P<0.0001; Mann-Whitney U test).
Significant difference between Hb E trait with α0-thal and Hb E trait with homozygous Hb CS (P<0.0001; Mann-Whitney U test).
Significant difference between AEBart’s disease and CS AEBart’s disease (P<0.0001; Mann-Whitney U test).
Significant difference from non-thal without ID (Non-thal with ID with P=0.0160 and non-thal with IDA with P<0.0001) (P<0.0001; Mann-Whitney U test).
Significant difference between non-thal with ID and non-thal with IDA (P=0.0242; Mann-Whitney U test).
Significant difference between Hb E trait without ID and Hb E trait with IDA (P=0.0411; Mann-Whitney U test).
Co-migrated between Hb Q-Thailand and Hb F on CE system;
Co-migrated between Hb E-CS and Hb A2-CS on CE system.
Figure 1.
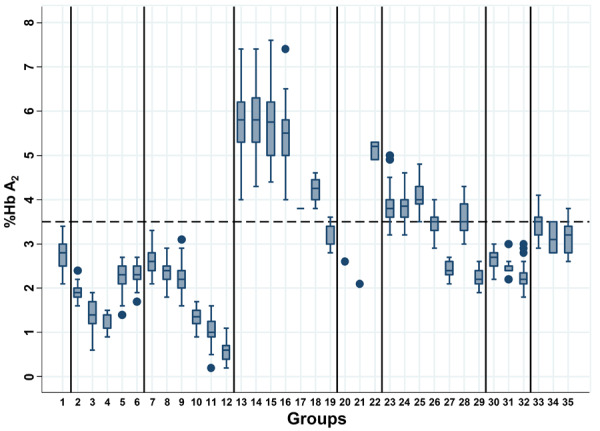
Plots of Hb A2 levels among Thai subjects with non-thalassemia, various thalassemia genotypes, non-thalassemia with ID and IDA, and Hb E with or without ID and IDA. Numbers 1-35 demonstrate plots of the groups of subjects as described in Table 1.
Table 2.
Hematologic findings of adult subjects with combined β-thalassemia trait and Hb H-disease and Hb H-CS disease
| Case no. | Hb type | Hb A2 (%) | Hb F (%) | Hb Bart’s (%) | Hb H (%) | Hb CS (%) | RBC (×1012/L) | Hb (g/dL) | HCT (%) | MCV (fL) | MCH (pg) | MCHC (g/dL) | RDW (%) | α-genotype | β-genotype |
|---|---|---|---|---|---|---|---|---|---|---|---|---|---|---|---|
| Hb H disease | |||||||||||||||
| BH-1 | A2 FABart’s | 3.8 | 11.3 | 0.4 | 0 | 0 | 5.10 | 8.8 | 27.7 | 53.6 | 17.4 | 32.5 | na | --/-α3.7 | β27(+C)/βA |
| BH-2 | A2 ABart’s | 4.2 | 9.9 | 0.3 | 0 | 0 | 5.35 | 9.3 | 30.8 | 57.5 | 17.3 | 30.1 | 17.8 | --/-α3.7 | β71/72(+A)/βA |
| BH-3 | A2 FABart’s | 4.3 | 12.9 | 0.7 | 0 | 0 | na | na | na | na | na | na | na | --/-α3.7 | β-28(A-G)/βA |
| BH-4 | A2 ABart’s | 4.6 | 1.7 | 0.2 | 0 | 0 | 4.97 | 9.8 | 26.4 | 53.2 | 19.7 | 37.1 | 12.4 | --/-α3.7 | β17(A-T)/βA |
| Hb H-CS disease | |||||||||||||||
| BH-5 | CS A2 ABart’s | 2.8 | 1.2 | 0.7 | 0 | 2.4 | 4.20 | 8.2 | 31.4 | 74.1 | 19.5 | 26.3 | 28.9 | --/αCSα | βDhonburi/βA |
| BH-6 | CS A2 ABart’s | 3.0 | 2.6 | 0.6 | 0 | 1.4 | 4.50 | 6.8 | 25.3 | 56.1 | 15.0 | 26.9 | 33.0 | --/αCSα | βDhonburi /βA |
| BH-7 | CS A2 ABart’s | 3.0 | 1.4 | 0.3 | 0 | 1.7 | 4.89 | 8.0 | 27.0 | 55.2 | 16.4 | 29.7 | 22.7 | --/αCSα | β43(G-T) /βA |
| BH-8 | CS A2 ABart’s | 3.4 | 1.1 | 0.4 | 0 | 1.1 | 5.45 | 8.8 | 29.2 | 53.6 | 16.2 | 30.3 | 24.6 | --/αCSα | βIVSI-1(G-T)/βA |
| BH-9 | CS A2 ABart’s | 3.6 | 1.0 | 2.5 | 0 | 1.6 | 5.6 | 10.0 | 33.0 | 59.0 | 17.7 | 30.1 | na | --/αCSα | β3.4kb del /βA |
Abbreviation: na, not available.
Interesting data on Hb A2 expression were also noted for those subjects with Hb E in groups 23-29. Unlike Hb-HPLC analysis which could not separate Hb E and Hb A2, Hb A2 could be reported in the presence of Hb E by capillary electrophoresis. As shown in Table 1, the plain Hb E trait (group 23) had a Hb A2 of 3.83±0.33%. No significant difference in Hb A2 expression was observed between subjects with plain Hb E trait and Hb E trait with α+-thalassemia (group 24) and the AEBart’s disease (group 28). In contrast, a significantly higher Hb A2 level was observed in those with Hb E trait with α0-thalassemia (group 25; 4.06±0.27%). As for α- and β-thalassemias mentioned above, we observed significantly lower Hb A2 levels in those of subjects with double heterozygosity for Hb E/Hb CS (group 26; 3.47±0.23%), Hb E trait with homozygous Hb CS (group 27; 2.40±0.20%), and Hb CS AEBart’s disease (group 29; 2.17±0.29%). These confirmed a stronger effect of Hb CS on Hb A2 expression in these Thai individuals with several forms of thalassemia. It seems likely that the reduction in Hb A2 expression depends on the number of α-globin gene defects and a co-inheritance with Hb CS. Figure 2 demonstrates Hb analysis profiles of these respective thalassemia genotypes with Hb CS on capillary electrophoresis.
Figure 2.

Representative Hb capillary electrophoresis profiles of subjects with various genotypes of Hb CS including: Hb CS trait (A), homozygous Hb CS (B), Hb H-CS disease (C), β-thalassemia trait with Hb CS (D), β-thalasssemia trait with homozygous Hb CS (E), β-thalassemia trait with Hb H-CS disease (F), double heterozygous Hb E/Hb CS (G), Hb E trait with homozygous Hb CS (H), and Hb CS-AEBart’s disease (I). Hb A, Hb A2, Hb F, Hb Bart’s, Hb H, Hb CS, Hb A2-CS, and Hb E-CS are indicated.
Since iron deficiency (ID) and iron deficiency anemia (IDA) are among the non-genetic factors affecting Hb A2 expression, we have looked at this factor in women of reproductive age with non-thalassemia (groups 30-32) and Hb E trait (groups 33-35). As shown in Table 1, a significant reduction in Hb A2 expression was observed for ID and IDA in both groups of subjects.
Discussion
Hb A2 results from a tetrameric assembly of two α- and two δ-globin chains (α2δ2). It is usually synthesized at a low level in normal adult individuals (2.5-3.5%). Increased Hb A2 level is an important diagnostic marker of a β-thalassemia carrier. Several genetic and acquired conditions are causes of a reduced Hb A2 expression, leading to a misdiagnosis of β-thalassemia carrier [1,2]. Genetic factors include α-thalassemia and those conditions related to reduced δ-globin chain synthesis, e.g., δ-thalassemia, δβ-thalassemia, γδβ-thalassemia, and δ-globin chain variants. Among the acquired conditions affecting Hb A2 expression are severe iron deficiency, lead poisoning, sideroblastic anemia, and myeloproliferative disorders [10]. Data on these should be addressed in each population in areas of high thalassemia prevalence like Southeast Asia. We reported in this study a large cohort of adult Thai subjects that have several conditions, including α-thalassemia, δ-hemoglobinopathies, high Hb F determinants, Hb Lepore, and especially Hb CS and iron deficiency, that are related to the reduced phenotypic expression of Hb A2.
As shown in Table 1, among these conditions, Hb Q-Thailand which is one of the most common α-globin chain variants in the Thai population, should receive special attention. This Hb variant is always detected on a chromosome with α+-thalassemia (4.2 kb deletion) that has been found to be caused by a single founder mutation in the Thai population [11]. Since Hb Q-Thailand is an α-globin chain variant, two Hb variants may be expected, i.e., abnormal Hb A and abnormal Hb A2. In the, heterozygous state, the tetrameric assembly of this α-globin chain variant (αQ) with β-globin and δ-globin chains would lead to the formation of Hb Q-Thailand (αQ 2β2) and Hb A2 variant (αQ 2δ2) in addition to the normal Hb A (α2β2) and Hb A2 (α2δ2). On Hb analysis, these Hb A2 and Hb A2 variants are separated at different zones with different quantities (Table 1). Therefore, a combined level of Hb A2 and Hb A2 variant should be reported as the total Hb A2 level. In this study, we found three subjects who were double heterozygous for β-thalassemia and Hb Q-Thailand (Table 1, group 22). Reduced Hb A2 was noted in these three cases (5.13±0.21%) as compared to the plain β-thalassemia trait (5.74±0.63%). However, a small amount of Hb A2 variant, namely Hb QA2 (1.6±0.9%), was also detected. It is recommended, therefore, that in each case with Hb Q-Thailand, this Hb QA2 should be combined with Hb A2 to get a total Hb A2 level in order not to misdiagnose of β-thalassemia, especially in those with borderline Hb A2 levels [11]. This is also the case for δ-hemoglobinopathies in groups 3 and 4. It is conceivable that the co-inheritance of δ-hemoglobinopathies with β-thalassemia either in cis or in trans may lead to a normal Hb A2 β-thalassemia trait. Although δ-thalassemia is hard to recognize unless appropriate criteria are applied [6], the δ-Hb variant can be identified as an abnormal Hb A2 fraction or Hb A2’ (α2δX 2). Again, a summation of Hb A2 and Hb A2’ must be reported as the total Hb A2 [12,13].
Several high Hb F determinants have been documented in Thailand. Among the mutations reported, the δβ0-thalassemia (12.6 kb deletion) is the most common one. The remaining defects encountered include hereditary persistence of fetal Hb (HPFH)-6, del-inv Aγδβ0-thalassemia, del-inv-ins Aγδβ0-thalassemia, δβ0-thalassemia (11.3 kb deletion), and Chinese Aγδβ0-thalassemia [7,14]. We found that all of them are associated with reduced Hb A2 expression, with a mean level in the pure heterozygotic state ranging from 2.0-2.6% due to the deletion of the δ-globin gene. In fact, this reduced Hb A2 expression is a useful marker for differentiation of compound δβ0-thalassemia/Hb E and β0-thalassemia/Hb E, provided Hb analysis is carried out on capillary electrophoresis, which can report Hb A2 in the presence of Hb E [7]. The reduced Hb A2 levels seen in heterozygosity for Hb Lepore, a δβ+-thalassemia caused by a hybrid δ- and β-globin gene, is not unexpected [15]. It is conceivable that the reduced Hb A2 in these high Hb F conditions does not affect the diagnosis of β-thalassemia carrier; however, the high Hb F nature associated with these conditions may lead to difficulty in the diagnosis of β-thalassemia. Therefore, an accurate diagnosis should be obtained after DNA analysis [14].
Of interest is the finding that co-inheritance of Hb CS with all genotypes listed in Table 1 may dramatically reduce Hb A2 expression. Marked reduction of Hb A2 level was observed in homozygous Hb CS (Table 1, group 10) and Hb H-CS disease (Table 1, group 12). This has been confirmed in group 29 with Hb CS AEBart’s disease, in whom Hb A2 was measured at 2.17±0.29%. As shown in Table 2, when the β-thalassemia trait was encountered in association with Hb H disease (BH1-BH4) and Hb H-CS disease (BH5-BH9), a great difference in Hb A2 level was noted. Although reduced Hb A2 levels were observed in the former with Hb H disease, the levels of Hb A2 were still higher than that of the diagnostic cut-off for β-thalassemia carrier at 3.5%, as also noted previously [16-18]. In contrast, 4 of 5 cases of β-thalassemia carriers with Hb H-CS disease (BH5-BH8) had Hb A2 ranging from 2.8-3.4%, lower than the cut-off level. Accordingly, this should lead to a misdiagnosis of β-thalassemia carrier in a routine setting [19]. The remaining case (BH9) with a similar genotype had Hb A2 of 3.6%. This could be explained by the fact that β-thalassemia, in this case, was caused by a 3.4 kb deletion of a β-globin gene which is known as a high Hb A2 and high Hb F β-thalassemia allele [20]. It is noteworthy that in these cases of β-thalassemia with Hb H and Hb H-CS diseases and CS AEBart’s disease, no Hb H (β4) was identified, due to the decreased β-globin chain synthesis for β-thalassemia and Hb E.
It is known that when α-globin chains are limited in α-thalassemia, α-globin chains have a higher affinity for β-globin chains as compared to δ-globin chains [2]. Low Hb A2 levels were therefore observed in subjects with α-thalassemia. Again, among these α-thalassemia alleles, Hb CS has the strongest effect on Hb A2 expression (Table 1, groups 7-12). Furthermore, we observed that the αCS chains could bind to δ-globin chains to form the Hb A2-CS (αConSp 2δ2), which could be demonstrated as shown in the homozygous Hb CS and Hb H-CS disease in Figure 2. This small amount of Hb A2-CS could lead to a further reduction in Hb A2 level. However, association with α-thalassemia does not always lead to a reduced Hb A2 expression. We reported previously that co-inheritance of α0-thalassemia elevates the Hb A2 level in homozygous Hb E. This is likely because when there is limited availability of α-globin chain in α0-thalassemia, the α-globin chain prefers to bind with the δ-globin chain to form Hb A2 (α2δ2) rather than βE-chain to form Hb E (α2βE 2). Hb A2 is therefore increased while Hb E is reduced, accordingly [21].
For the non-genetic factor, our result confirmed that ID and IDA did result in the reduction of Hb A2 expression in both non-thalassemic individuals and Hb E trait individuals (Table 1, groups 30-32 & groups 33-35). Unfortunately, we did not observe a case of β-thalassemia trait with ID or IDA in this cohort to see whether this combination could alter the diagnosis of β-thalassemia carrier. Iron deficiency is known to be associated with lower expression of the α-globin gene and α-globin chain production [10]. With the small reduction in Hb A2 observed in this study in both non-thalassemic subjects and Hb E traits, it is unlikely that ID would interfere with Hb A2-based identification of β-thalassemia in the Thai population. Studies in other populations have also noted that ID does not compromise the diagnosis of high Hb A2 β-thalassemia trait [22-25]. Although both ID and thalassemia are prevalent in the region [26], screening for ID in a routine β-thalassemia screening is accordingly not necessary.
In conclusion, we demonstrated in a large cohort of Thai subjects that α-hemoglobinopathies, δ-hemoglobinopathies, high Hb F determinants, α-thalassemia, and iron deficiency could lead to a reduced phenotypic expression of Hb A2. Among these genetic and non-genetic factors, δ-hemoglobinopathies and Hb CS showed a dramatic effect on Hb A2 level such that β-thalassemia carrier can be misidentified in a routine setting. Fortunately, many δ-Hb variants and Hb CS can be easily recognized on Hb capillary electrophoresis (Figure 2), and simple DNA testing for the identification of these forms of thalassemia has been described [6,27]. Nonetheless, understanding the basis for lower production of Hb A2 in an area endemic for thalassemia should prove useful for the ongoing thalassemia prevention and control program in the region.
Acknowledgements
This work was supported by Khon Kaen University, Khon Kaen (to Fucharoen S) and Mahasarakham University, Mahasarakham (to Singha K, contract ID 640215/2564), Thailand. SF is a recipient of the Thailand Research Fund (TRF) Research Team Promotion Grant (RTA) of the Thailand Science Research and Innovation (TSRI), Thailand (Contract ID RTA6280005).
Disclosure of conflict of interest
None.
References
- 1.Weatherall DJ, Clegg JB. UK: Blackwell Science Ltd; 2001. The thalassemia syndromes. [Google Scholar]
- 2.Mosca A, Paleari R, Ivaldi G, Galanello R, Giordano PC. The role of haemoglobin A(2) testing in the diagnosis of thalassaemias and related haemoglobinopathies. J Clin Pathol. 2009;62:13–17. doi: 10.1136/jcp.2008.056945. [DOI] [PubMed] [Google Scholar]
- 3.World Health Organization. Geneva: World Health Organization; 2001. Iron deficiency anaemia: assessment, prevention, and control, a guide for programme managers; pp. 1–114. [Google Scholar]
- 4.Chaibunruang A, Prommetta S, Yamsri S, Fucharoen G, Sae-Ung N, Sanchaisuriya K, Fucharoen S. Molecular and hematological studies in a large cohort of α(0)-thalassemia in northeast Thailand: data from a single referral center. Blood Cells Mol Dis. 2013;51:89–93. doi: 10.1016/j.bcmd.2013.04.003. [DOI] [PubMed] [Google Scholar]
- 5.Charoenwijitkul T, Singha K, Fucharoen G, Sanchaisuriya K, Thepphitak P, Wintachai P, Karnpean R, Fucharoen S. Molecular characteristics of α+-thalassemia (3.7 kb deletion) in Southeast Asia: molecular subtypes, haplotypic heterogeneity, multiple founder effects and laboratory diagnostics. Clin Biochem. 2019;71:31–37. doi: 10.1016/j.clinbiochem.2019.06.005. [DOI] [PubMed] [Google Scholar]
- 6.Singha K, Fucharoen G, Fucharoen S. δ-Hemoglobinopathies in Thailand: screening, molecular basis, genotype-phenotype interaction, and implication for prevention and control of thalassemia. Ann Hematol. 2021;100:1953–1963. doi: 10.1007/s00277-021-04510-2. [DOI] [PubMed] [Google Scholar]
- 7.Prakobkaew N, Fucharoen S, Fuchareon G, Siriratmanawong N. Phenotypic expression of Hb F in common high Hb F determinants in Thailand: roles of α-thalassemia, 5’ δ-globin BCL11A binding region and 3’ β-globin enhancer. Eur J Haematol. 2014;92:73–79. doi: 10.1111/ejh.12201. [DOI] [PubMed] [Google Scholar]
- 8.Srivorakun H, Singha K, Fucharoen G, Sanchaisuriya K, Fucharoen S. A large cohort of hemoglobin variants in Thailand: molecular epidemiological study and diagnostic consideration. PLoS One. 2014;9:e108365. doi: 10.1371/journal.pone.0108365. [DOI] [PMC free article] [PubMed] [Google Scholar]
- 9.Yamsri S, Sanchaisuriya K, Fucharoen G, Sae-Ung N, Ratanasiri T, Fucharoen S. Prevention of severe thalassemia in northeast Thailand: 16 years of experience at a single university center. Prenat Diagn. 2010;30:540–546. doi: 10.1002/pd.2514. [DOI] [PubMed] [Google Scholar]
- 10.Steinberg MH, Adams JG 3rd. Hemoglobin A2: origin, evolution, and aftermath. Blood. 1991;78:2165–2177. [PubMed] [Google Scholar]
- 11.Singsanan S, Karnpean R, Fucharoen G, Sanchaisuriya K, Sae-Ung N, Fucharoen S. Hemoglobin Q-Thailand related disorders: origin, molecular, hematological and diagnostic aspects. Blood Cells Mol Dis. 2010;45:210–214. doi: 10.1016/j.bcmd.2010.06.001. [DOI] [PubMed] [Google Scholar]
- 12.Stephens AD, Angastiniotis M, Baysal E, Chan V, Fucharoen S, Giordano PC, Hoyer JD, Mosca A, Wild B. International council for the standardisation of haematology (ICSH), ICSH recommendations for the measurement of haemoglobin A2. Int J Lab Hematol. 2012;34:1–13. doi: 10.1111/j.1751-553X.2011.01368.x. [DOI] [PubMed] [Google Scholar]
- 13.Panyasai S, Fucharoen G, Fucharoen S. Known and new hemoglobin A2 variants in Thailand and implication for β-thalassemia screening. Clin Chim Acta. 2015;438:226–230. doi: 10.1016/j.cca.2014.09.003. [DOI] [PubMed] [Google Scholar]
- 14.Singha K, Fucharoen G, Hama A, Fucharoen S. A novel (A)γδβ(0)-thalassemia caused by DNA deletion-inversion-insertion of the β-globin gene cluster and five olfactory receptor genes: genetic interactions, hematological phenotypes and molecular characterization. Clin Biochem. 2015;48:703–708. doi: 10.1016/j.clinbiochem.2015.03.023. [DOI] [PubMed] [Google Scholar]
- 15.Chaibunruang A, Srivorakun H, Fucharoen S, Fucharoen G, Sae-Ung N, Sanchaisuriya K. Interactions of hemoglobin Lepore (deltabeta hybrid hemoglobin) with various hemoglobinopathies: a molecular and hematological characteristics and differential diagnosis. Blood Cells Mol Dis. 2010;44:140–145. doi: 10.1016/j.bcmd.2009.11.008. [DOI] [PubMed] [Google Scholar]
- 16.Sae-Ung N, Srivorakun H, Fucharoen G, Yamsri S, Sanchaisuriya K, Fucharoen S. Phenotypic expression of hemoglobins A2, E and F in various hemoglobin E related disorders. Blood Cells Mol Dis. 2012;48:11–16. doi: 10.1016/j.bcmd.2011.09.008. [DOI] [PubMed] [Google Scholar]
- 17.Yin XL, Wu ZK, Zhou XY, Zhou TH, Zhou YL, Wang L, Huang J, Zhang XH. Co-inherited β-thalassemia trait and HbH disease: clinical characteristics and interference in diagnosis of thalassemia by high-performance liquid chromatography. Int J Lab Hematol. 2012;34:427–431. doi: 10.1111/j.1751-553X.2012.01415.x. [DOI] [PubMed] [Google Scholar]
- 18.Chen GL, Jiang F, Li J, Zhou JY, Li DZ. Results of coexistence of β-thalassemia minor in Hb H disease patients. Hemoglobin. 2018;42:306–309. doi: 10.1080/03630269.2018.1561461. [DOI] [PubMed] [Google Scholar]
- 19.Li YQ, Li DZ. Hb A2 levels in patients with nondeletional Hb H disease. Int J Lab Hematol. 2012;34:663–664. doi: 10.1111/j.1751-553X.2012.01453.x. [DOI] [PubMed] [Google Scholar]
- 20.Yamsri S, Sanchaisuriya K, Fucharoen G, Sae-Ung N, Fucharoen S. Genotype and phenotype characterizations in a large cohort of β-thalassemia heterozygote with different forms of α-thalassemia in northeast Thailand. Blood Cells Mol Dis. 2011;47:120–124. doi: 10.1016/j.bcmd.2011.05.003. [DOI] [PubMed] [Google Scholar]
- 21.Singha K, Srivorakun H, Fucharoen G, Fucharoen S. Co-inheritance of α0-thalassemia elevates Hb A2 level in homozygous Hb E: diagnostic implications. Int J Lab Hematol. 2017;39:508–512. doi: 10.1111/ijlh.12677. [DOI] [PubMed] [Google Scholar]
- 22.Van Delft P, Lenters E, Bakker-Verweij M, de Korte M, Baylan U, Harteveld CL, Giordano PC. Evaluating five dedicated automatic devices for haemoglobinopathy diagnostics in multi-ethnic populations. Int J Lab Hematol. 2009;31:484–495. doi: 10.1111/j.1751-553X.2009.01158.x. [DOI] [PubMed] [Google Scholar]
- 23.Passarello C, Giambona A, Cannata M, Vinciguerra M, Renda D, Maggio A. Iron deficiency does not compromise the diagnosis of high Hb A2 β-thalassemia trait. Haematologica. 2012;97:472–473. doi: 10.3324/haematol.2011.052357. [DOI] [PMC free article] [PubMed] [Google Scholar]
- 24.Verhovsek M, So CC, O’Shea T, Gibney GT, Ma ES, Steinberg MH, Chui DH. Is Hb A2 level a reliable diagnostic measurement for β-thalassemia trait in people with iron deficiency? Am J Hematol. 2012;87:114–116. doi: 10.1002/ajh.22188. [DOI] [PubMed] [Google Scholar]
- 25.Sherma P, Das R, Trehan A, Bansal D, Chhabra S, Kaur J, Marwaha RK, Verma N, Garewal G. Impact of iron deficiency on hemoglobin A2 in obligatory β-thalassemia heterozygotes. Int J Lab Hematol. 2015;37:105–111. doi: 10.1111/ijlh.12246. [DOI] [PubMed] [Google Scholar]
- 26.Sanchaisuriya K, Fucharoen S, Ratanasiri T, Sanchaisuriya P, Fucharoen G, Dietz E, Schelp FP. Thalassemia and hemoglobinopathies rather than iron deficiency are major causes of pregnancy-related anemia in northeast Thailand. Blood Cells Mol Dis. 2006;37:8–11. doi: 10.1016/j.bcmd.2006.04.006. [DOI] [PubMed] [Google Scholar]
- 27.Fucharoen S, Sanchaisuriya K, Fucharoen G, Panyasai S, Devenish R, Luy L. Interaction of hemoglobin E and several forms of α-thalassemia in Cambodian families. Haematologica. 2003;88:1092–1098. [PubMed] [Google Scholar]