

Abstract
Objective: To investigate the correlations between preoperative diffusion tensor imaging (DTI), a Magnetic Resonance Imaging (MRI)-based technique and surgical outcome in patients with cervical spondylotic myelopathy (CSM). Methods: A retrospective study of 95 patients with CSM who received diagnosis and surgical treatment in our hospital was carried out. According to the recovery rate of the Japanese Orthopaedic Association (JOA) scale at the 1-year postoperative follow-up, the patients were divided into a good recovery group (JOA recovery rate ≥60%, n = 47) and a poor recovery group (JOA recovery rate <60%, n = 48). Patients in both groups underwent diffusion tensor imaging examination before surgery. The preoperative fractional anisotropy (FA) value, apparent diffusion coefficient (ADC) value, longitudinal dispersion (AD) rate, and lateral dispersion (VD) rate were compared between the two groups. Pearson correlation coefficient was used to analyze the correlation between the preoperative DTI quantization parameters (FA, ADC, AD, VD) and the postoperative JOA recovery rate. In addition, we compared the preoperative spinal cord compression ratio (CR), spinal cord cross-sectional area (TA), maximum spinal cord compression (MSCC), and maximum canal compromise (MCC) between the above two groups. The correlations between the four measurements and the postoperative JOA recovery rate were analyzed using Pearson correlation coefficient. Results: The preoperative FA value in the good recovery group was significantly higher than that in the poor recovery group, while the ADC value was significantly lower (both P<0.001). The good recovery group had lower preoperative AD and VD, but there was no statistical significance (both P>0.05). Pearson correlation analysis showed that the preoperative FA value was positively correlated with the JOA recovery rate (P<0.05), while the VD value had significantly negative correlation with the JOA recovery rate (P<0.05). The preoperative ADC and AD values were negatively correlated with JOA recovery rate, whereas there was no statistical significance (both P>0.05). The CR, TA, MSCC and MCC values measured before surgery in the good recovery group were significantly lower than those in the poor recovery group (all P<0.001); were negatively correlated with the JOA recovery rate (all P<0.05), while the correlation with TA was not statistically significant (P>0.05). Conclusion: DTI can evaluate the severity of the patient’s condition before surgery by analyzing the subtle structural changes in patients with CSM. At the same time, the preoperative FA, VD, CR, MSCC, and MCC values are all associated with the surgery efficacy, which paves the way for the next step of clinical treatment.
Keywords: Diffusion tensor imaging, cervical spondylotic myelopathy, Japanese orthopaedic association recovery rate, fractional anisotropy, correlation
Introduction
Cervical spondylotic myelopathy (CSM) whose clinical symptoms including numbness and weakness of the limbs, and sensory motor disorders, is the most serious subtype of cervical spondylosis [1]. The incidence of CSM accounts for about 12% to 30% of cervical spondylosis, with the peak age at onset being 50 years, of which the majority were from males [2]. At this stage, some scholars believe that developmental cervical cone stenosis and cervical degenerative changes are the main pathogenesis of CSM, but its etiology and pathogenesis remain unclear [3]. CSM generally develops slowly, and then gradually worsens. Most patients have mild symptoms at the beginning of the onset, but gradually suffer from paralysis of limbs as the condition worsens [4]. Therefore, once CSM is diagnosed, especially for patients with progressive symptoms who fails conservative treatments, in principle, surgical treatment should be performed as soon as possible. For those without surgical contraindications to relieve the spinal cord compression, control the progress of the disease, and reduce the difficulty of treatment [5,6]. However, some patients miss the best treatment opportunity due to early mild manifestations or inconsistent clinical diagnosis of typical CSM [7]. Moreover, the patient’s spinal cord is irreversibly damaged in the later stages of the disease, which not only increases the difficulty of the operation but also affects the prognosis, so early diagnosis and treatment are extremely important [8]. Therefore, how to improve the early diagnosis rate, especially to predict the prognosis of patients based on the degree of spinal cord injury and functional level, is critical for choosing an appropriate treatment plan and improving the efficacy [9].
Magnetic Resonance Imaging (MRI) is an imaging method that is conducive to displaying soft tissues, including special items such as diffusion tensor imaging (DTI), and is considered to be one of the most effective diagnostic measures for CSM [10]. Conventional magnetic resonance imaging can display the position and shape of each segment of the cervical spine, as well as the degree of compression of the spinal cord. However, spinal cord compression caused by different reasons could not be specifically shown, and the reversibility and degree of damaged spinal cord lesions could not be directly reflected through images either [11]. Thus, it cannot be used to predict the prognosis of patients. The principle of DTI is related to the sensitivity of water molecules. Compared with conventional MRI, DTI can numerically quantify the lesion to observe its subtle structural changes [12]. With this feature, it is increasing widely used in clinical diagnosis of CSM. Vedantam et al. pointed out that the quantitative values of DTI have a significant correlation with the preoperative Japanese Orthopedic Association (JOA) scores, and it is inevitable related to the damaged spinal cord lesions of CSM patients [13]. JOA is a commonly used clinical evaluation system for the degree of spinal cord injury, which is regarded as the representative value of preoperative spinal cord injury [14]. However, there is a study which revealed that the JOA value of CSM patients can change significantly before and after treatment, so the preoperative JOA score cannot be used as an accurate indicator of the severity of spinal cord injury, which is controversial with the above research conclusions [15]. But the degree of change in the JOA score (i.e. JOA recovery rate) before and after surgery still reflect the therapeutic effect [16]. Therefore, this study set the JOA recovery rate as a research indicator reflecting the efficacy of CSM surgery, focusing on observing the correlation between the quantitative value of DTI and the JOA recovery rate, and exploring key indicators related to the postoperative prognosis of patients with CSM, which met the research objective while avoiding the above shortcomings.
Materials and methods
General data
This study was reviewed and approved by the ethics committee of our hospital (approval number: 2020055). A retrospective analysis of 95 patients with CSM who received diagnosis and surgical treatment in our hospital from March 2017 to May 2019 was carried out. According to the JOA recovery at the 1-year postoperative follow-up, they were divided into a good recovery group (JOA recovery rate ≥60%, n = 47) and a poor recovery group (JOA recovery rate <60%, n = 48). Patients in the both groups underwent DTI examination before surgery.
Inclusion criteria: (1) Patients met the diagnostic criteria of CSM formulated by the National Cervical Spondylosis Special Research Conference in 1994, and were confirmed by MRI [16]. (2) Patients were operated by the same group of doctors in our hospital. The surgical procedures included anterior cervical decompression and bone graft fusion with internal fixation (anterior approach), posterior cervical single-door laminoplasty (posterior approach) or a combination of the two. The postoperative reexamination was confirmed by MRI to fully decompress.
Exclusion criteria: (1) Patients had metal implants in the eyeball or body. (2) Patients had undergone cardiac or aneurysm surgery with implantable foreign matter. (3) Patients were accompanied with mental disorders and other diseases that would affect the results of the study.
Methods
Before surgery and during follow-up, GE Signa HDxt 3.0 T magnetic resonance scanner (GE Medical Group, China) was used to perform conventional axial T2-weighted (TR/TE/IR, 9000/120/2100 ms) and sagittal T1-weighted (TR/TE, 600/15 ms), T2-weighted (TR/TE, 5200/140 ms) and cross-sectional T1-weighted (TR/TE, 2070/23 ms), and T2-weighted (TR/TE, 3000/113 ms). Eight-channel coils with 3-mm thickness, 1.0-mm spacing, field of view (FOV) = 240*240 mm, and matrix size of 512*512 were used. The most severely compressed cross-sectional plane was found on the MRI sagittal plane image. The spinal cord compression (CR) rate = smallest anteroposterior diameter of the spinal cord/largest transverse diameter of cord. At the same level, the drawing software illustrated one circle around the cross-section of the spinal cord, and then the cross-sectional area (TA) of the compressed segment of the cervical spinal cord was automatically calculated. The sagittal diameter of the spinal cord at the most severe part of the compression was set as a, the upper normal segment of cervical spinal cord sagittal diameter as b, and the lower normal segment cervical spinal cord sagittal diameter as c. On the T2-weighted sagittal image, the maximum spinal cord compression (MSCC) rate = (a/(b+c))*100%. On the T1-weighted sagittal image, the maximum canal compromise (MCC) rate = (a/(b+c))*100% [17,18].
Philips Ingenia 3.0 T magnetic resonance scanner (Royal Philips, the Netherlands) was used to perform DTI examinations on all patients before surgery. SE-EPI sequence was adopted, and the diffuse gradient field took 36 directions. Parameters: b = 0/800 s/mm2, TR 1677 ms, TE 83 ms, matrix size = 144*144, FOV = 220 mm*220 mm. The matching Siemens Sygno workstation and NEURO3D software were utilized to analyze and measure the post-processing of images and data measurement of each patient, and then we obtained axial preoperative FA, ADC, AD and VD values of the most severely compressed spine segment [19,20].
Outcome measures
The preoperative DTI quantization parameters (FA, ADC, AD, VD) in two groups were compared. ADC = ln(S2-S1)/(b1-b2). The correlations between the four quantitative measurements and the postoperative JOA recovery rate were analyzed using Pearson correlation coefficient. Postoperative JOA recovery rate = ((JOA scores at 1-year postoperative follow-up - preoperative JOA scores)/(17 - preoperative JOA scores)) *100%. The JOA score has a full score of 14 points, of which upper- and lower-extremity function accounts for 4 points each; sensory in the upper-, and lower-extremity, and somatosensory accounts for 2 points each; the bladder function accounts for 2 points. Lower scores represent a more serious nerve damage. Zero is defined as complete abnormality [21].
In addition, the preoperative spinal cord CR, spinal cord TA, MSCC, and MCC were compared between the two groups. The correlations between the four quantitative measurements and the postoperative JOA recovery rate were analyzed using Pearson correlation coefficient.
Statistical analysis
SPSS 21.0 software was used for data analysis. Measurement data was expressed as mean ± standard deviation (x̅ ± sd). Independent t test was carried out for comparison between groups. Comparison of data before and after surgery within the group was represented by paired-sample t test. The rank sum test was utilized for rank variables, denoted by H. Count data were expressed by number or percentage (n/%), and compared with chi-square test, indicated as χ2 . Correlation analysis was performed by Pearson correlation coefficient. P<0.05 meant that the results were statistically different.
Results
Comparison of general data
The preoperative and postoperative JOA scores of patients in the good recovery group were significantly higher than those in the poor recovery group (both P<0.001). There were no significant differences in gender, age, average course of disease or other general data between the two groups (all P>0.05). See Table 1.
Table 1.
Comparison of general data (x̅ ± sd)
| Item | Good recovery group (n = 47) | Poor recovery group (n = 48) | t/χ2/H | P |
|---|---|---|---|---|
| Gender (male/female) | 28/19 | 30/18 | 0.092 | 0.769 |
| Age (year) | 54.2±9.0 | 54.3±9.5 | 0.020 | 0.984 |
| Course of disease (day) | 6.96±1.14 | 7.01±1.07 | 0.221 | 0.826 |
| JOA scale (scores) | ||||
| Before surgery | 10.52±1.92 | 8.55±2.20 | 4.779 | 0.000 |
| After surgery | 14.37±2.15 | 9.65±2.42 | 10.028 | 0.000 |
| Surgical approach (n, %) | 0.437 | 0.804 | ||
| Anterior | 18 (38.30) | 19 (39.58) | ||
| Posterior | 22 (46.81) | 24 (50.00) | ||
| Anterior + posterior | 7 (14.89) | 5 (10.42) | ||
| Time for surgery (h) | 2.44±0.58 | 2.51±0.51 | 0.625 | 0.534 |
| Cases for the most damaged segment (n, %) | 0.466 | 0.923 | ||
| C3-4 | 5 (10.64) | 7 (14.58) | ||
| C4-5 | 17 (36.17) | 18 (37.50) | ||
| C5-6 | 19 (40.42) | 17 (35.42) | ||
| C6-7 | 6 (12.77) | 6 (18.75) |
Note: JOA: Japanese Orthopaedic Association.
Comparison of typical MR images
The preoperative and postoperative MRI of the patients in the two groups clearly showed the position and shape of the most severely compressed cervical spine, whereas there was no significant difference between the groups (all P>0.05). See Figure 1.
Figure 1.

Comparison of typical MRI of two groups before and after surgery. A-D: Sagittal preoperative and postoperative T2-weighted images, axial preoperative and postoperative T2-weighted images in the poor recovery group, respectively; E-H: Sagittal preoperative and postoperative T2-weighted images, axial preoperative and postoperative T2-weighted images in the good recovery group, respectively. MRI: magnetic resonance imaging.
Comparison of preoperative DTI quantization parameters (FA, ADC, AD, VD)
The preoperative FA value in the good recovery group was significantly higher than that in the poor recovery group, while the ADC value was significantly lower (both P<0.001). The good recovery group had lower preoperative AD and VD than the poor recovery group, whereas there was no statistical significance (both P>0.05). See Table 2; Figures 2, 3.
Table 2.
Comparison of preoperative DTI quantitative values (x̅ ± sd)
| Group | FA | ADC | AD | VD |
|---|---|---|---|---|
| Good recovery group (n = 47) | 0.57±0.10 | 1.31±0.21 | 2.25±0.39 | 0.85±0.20 |
| Poor recovery group (n = 48) | 0.46±0.12 | 1.58±0.15 | 2.31±0.43 | 0.94±0.25 |
| t/χ2 | 4.998 | 7.255 | 0.759 | 1.929 |
| P | 0.000 | 0.000 | 0.150 | 0.057 |
Note: DTI: diffusion tensor imaging; FA: fractional anisotropy; ADC: apparent diffusion coefficient; AD: longitudinal dispersion; VD: lateral dispersion.
Figure 2.
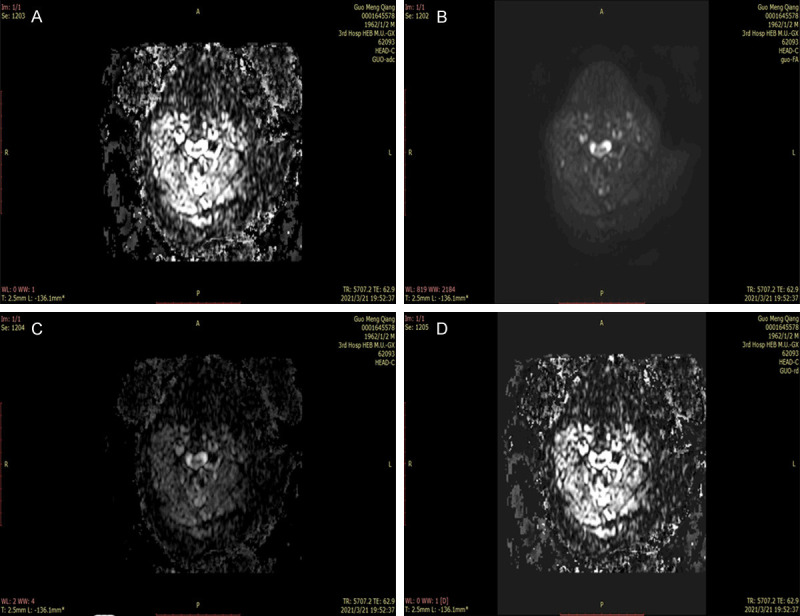
Quantitative parameters of preoperative DTI in the poor recovery group. A-D: Preoperative FA, ADC, AD, and VD images in the poor recovery group, respectively. DTI: diffusion tensor imaging; FA: fractional anisotropy; ADC: apparent diffusion coefficient; AD: longitudinal dispersion; VD: lateral dispersion.
Figure 3.
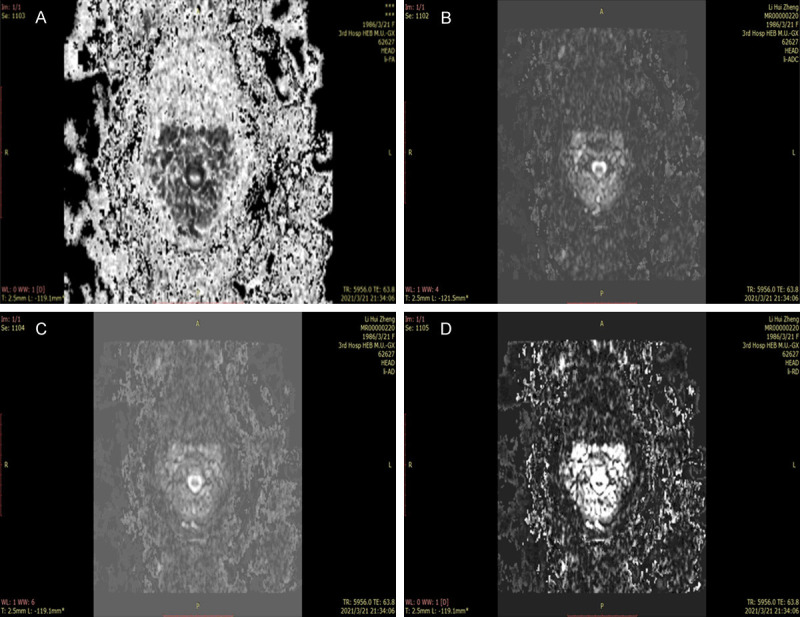
Quantitative parameters of preoperative DTI in the good recovery group. A-D: Preoperative FA, ADC, AD, and VD images in the good recovery group, respectively. DTI: diffusion tensor imaging; FA: fractional anisotropy; ADC: apparent diffusion coefficient; AD: longitudinal dispersion; VD: lateral dispersion.
Pearson correlation analysis of preoperative DTI quantization parameters and the postoperative JOA recovery rate
Pearson correlation analysis showed that preoperative ADC and AD values of patients were negatively correlated with JOA recovery rate, but there was no statistical significance (both P>0.05). The preoperative FA value was positively correlated with the JOA recovery rate, while the VD value was negatively correlated with the JOA recovery rate (both P<0.05). See Figure 4.
Figure 4.
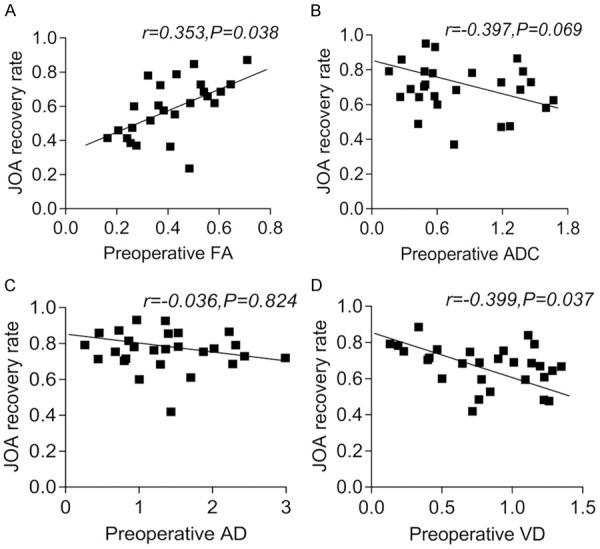
Pearson correlation analysis between the preoperative DTI quantitative values and the postoperative JOA recovery rate. A: Pearson correlation analysis between preoperative FA and postoperative JOA recovery rate; B: Pearson correlation analysis between preoperative ADC and postoperative JOA recovery rate; C: Pearson correlation analysis between preoperative AD and postoperative JOA recovery rate; D: Pearson correlation analysis between preoperative VD and postoperative JOA recovery rate. DTI: diffusion tensor imaging; FA: fractional anisotropy; ADC: apparent diffusion coefficient; AD: longitudinal dispersion; VD: lateral dispersion; JOA: Japanese Orthopaedic Association.
Comparison of preoperative CR, TA, MSCC and MCC values
The CR, TA, MSCC and MCC values measured before surgery in the good recovery group were significantly lower than those in the poor recovery group (all P<0.001). See Table 3.
Table 3.
Comparison of preoperative CR, TA, MSCC and MCC values (x̅ ± sd)
| Group | CR (%) | TA (cm2) | MSCC (%) | MCC (%) |
|---|---|---|---|---|
| Good recovery group (n = 47) | 27.00±4. 02 | 0.46±0.11 | 31.07±4.24 | 30.27±4.10 |
| Poor recovery group (n = 48) | 39.27±5.21 | 0.60±0.13 | 43.21±5.23 | 42.99±5.14 |
| t/χ2 | 12.825 | 5.463 | 12.416 | 13.312 |
| P | 0.000 | 0.000 | 0.000 | 0.000 |
Note: CR: compression ratio; TA: cross-sectional area; MSCC: maximum spinal cord compression; MCC: maximum canal compromise.
Pearson correlation analysis of preoperative CR, TA, MSCC and MCC values and postoperative JOA recovery rate
Pearson correlation analysis revealed that preoperative TA value was positively correlated with the JOA recovery rate, but the correlation was not statistically significant (P>0.05); while the preoperative CR, MSCC and MCC values were significantly and negatively correlated with the JOA recovery rate (all P<0.05). See Figure 5.
Figure 5.
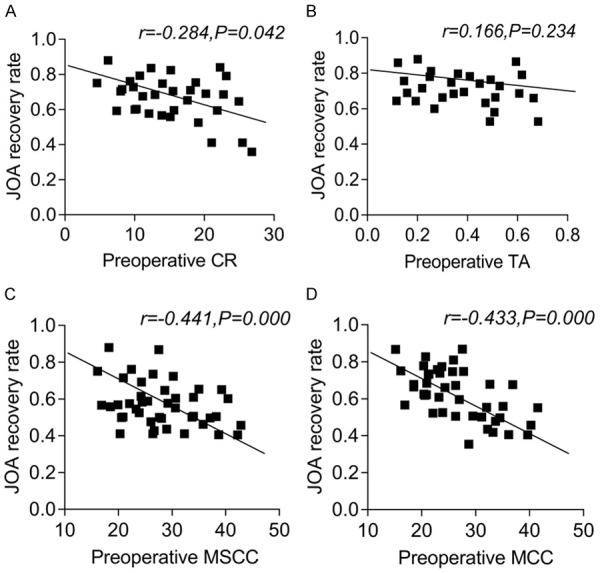
Pearson correlation analysis of preoperative CR, TA, MSCC and MCC values and postoperative JOA improvement rate. A: Pearson correlation analysis between FA and postoperative JOA recovery rate; B: Pearson correlation analysis between ADC and postoperative JOA recovery rate; C: Pearson correlation analysis between AD and postoperative JOA recovery rate; D: Pearson correlation analysis between VD and postoperative JOA recovery rate. CR: compression ratio; TA: cross-sectional area; MSCC: maximum spinal cord compression; MCC: maximum canal compromise; FA: fractional anisotropy; ADC: apparent diffusion coefficient; AD: longitudinal dispersion; VD: lateral dispersion; JOA: Japanese Orthopaedic Association.
Discussion
DTI can reflect the changes in the microstructure of the diseased part through the quantitative numerical response of the micro-molecular changes, and differentiate the spinal cord injury of each of the patients examined. Additionally, it can give certain guidance to clinicians in the planning of the treatment to minimize the interference of subjective judgment caused by the limited preoperative diagnostic materials. Hence, the clinical treatment plan is more in line with the actual situation of the patient, especially for patients with severe disease but not obvious symptoms and signs, which can greatly improve their prognosis [22,23].
In this study, DTI, a MRI-based technique was adopted and the correlation between various parameters and the surgical efficacy of CSM patients was analyzed. The surgical outcome indicated the preoperative FA value was significantly higher in the good recovery group than in the poor recovery group, while the ADC value was significantly lower, which suggests that higher preoperative FA value revealed lower ADC value and better prognosis. The above conclusion is consistent with the findings of Rindler et al. that DTI had a significant relationship with the preoperative severity and postoperative outcome of patients with CSM after 310 days of follow-up [24]. The principle is under long-term compression of the injured cervical spinal cord, the nerve cells within the spinal cord gradually atrophy and the cytoplasm decreases. The changes in the intracellular mechanism lead to disturbances in the intracellular and extracellular balance, which in turn results in extracellular edema, gaps enlargement, and acceleration of extracellular free water activity [25]. The FA value represents the proportion of the anisotropic component of the water molecules in the measurement area in the entire dispersion tensor, larger value stands for better integrity of the nerve fiber bundles, and thus better prognosis [26]. The ADC value mainly depends on the mobility of water molecules inside and outside the cells. The greater degree of diffusion of water molecules represents the greater ADC value. This means that the spinal cord in the measured area is insufficiently perfused, the local cells are subjected to ischemia and hypoxia, and have caused certain damage to the cells. On the contrary, the damage to the lesion is less [27].
At the same time, from the Pearson correlation analysis results, we found that the preoperative FA value had positive correlation with the JOA recovery rate, while the VD had significantly negative correlation. It was revealed that the changes of the lesions before and after surgery were obviously related to the preoperative FA and VD values, but have nothing to do with the preoperative ADC and AD values. This may occur because the ADC and AD values are easily affected by the change of free water in the patient’s spinal cord. Therefore, the value will change at any time during the patient’s movement or the treatment process, leading to interference factors with the surgical efficacy, so there is no correlation between the two and the JOA recovery rate. The FA value reflected by it will not change in a short period of time after surgery. Under the same surgical conditions, the postoperative nerve fiber integrity of patients with severe damage is still lower than that of patients with less damage, and their prognosis is generally worse than that of patients with mild damage. There are few external factors that interfere with the change of FA value, and the quantitative value is stable, so it is positively correlated with the JOA recovery rate, which can indirectly indicate the prognosis [28]. Theoretically, the VD value has the same theory as the AD value. Perhaps due to the limitation of the number of cases in this study, the random error was large, and the results obtained cannot represent the overall condition [29].
In this study, The CR, TA, MSCC and MCC values measured before surgery in the good recovery group were significantly lower than those in the poor recovery group. Pearson correlation analysis revealed that the preoperative CR, MSCC and MCC values were significantly negatively correlated with the JOA recovery rate, while preoperative TA value was positively correlated with the JOA recovery rate, but there was no statistical significance. This indicated a correlation between CR, MSCC, MCC values and the prognosis of patients with CSM. The larger values indicated worse prognosis, and patients with better prognosis may have a smaller TA value, but the two were not related, which is consistent with the research results of Gibson [30]. MSCC and CR represent the degree of compression of the injured spinal cord. The heavier the compression, the smaller the sagittal diameter of the spinal cord and the larger the value. MCC is on behalf of the percentage of invasion in the sagittal plane of the compressed part in the entire spinal canal. The larger the percentage of invasion, the larger the value, which indirectly indicates more severe damage. At the same time, the heavier the compression is, the more severe the injury is, then under the same treatment conditions, the patients have a longer recovery time and a lower JOA recovery rate. Therefore, these three are negatively correlated with the JOA recovery rate [31]. However, although the TA value reflects the cross-sectional area of the measured spinal cord compression plane, it can be affected by many other uncontrollable variables such as height, weight, and gender. Therefore, the preoperative TA value cannot reflect the accuracy of the measured early spinal cord lesions. There is no correlation with JOA recovery rate [32].
In the past, the relationship between the postoperative DTI and JOA recovery rate or the relationship between preoperative DTI and preoperative or postoperative JOA value was used to study the correlation between DTI and the prognosis of CSM patients. But the effects of postoperative DTI are inevitably affected by surgery and stress response, and the evaluation time after surgery cannot be used as a basis for formulating a surgical plan; the JOA value will automatically change with the spinal cord injury time, which affects the reliability of the experimental results. Therefore, we chose the preoperative DTI and JOA recovery rate as the research point, which not only conforms to the research theme, but also avoids the above shortcomings, and can be used for preoperative evaluation and treatment plan formulation. Besides, with the in-depth analysis of the relationship between the preoperative examination results of CSM patients and the prognosis of the operation, through the accumulation of many experimental experiences and different research angles, the accuracy and reliability of the relevant research are gradually improved. By this way, clinicians are guided to predict and evaluate the prognosis of each patient before surgery, so as to facilitate the formulation of reasonable treatment plans and improve the living standards of patients to a certain extent.
However, this study still has some limitations, such as the small sample size, short follow-up time, contingency of experimental results, and error caused by the individual factors, which need further research.
In summary, diffusion tensor imaging analyzes the subtle structural changes in patients with CSM, and can evaluate the severity of the patient’s condition before surgery. Meanwhile, the preoperative FA, VD, CR, MSCC, and MCC values are all associated with the efficacy of surgery, which paves the way for the next step of clinical treatment.
Disclosure of conflict of interest
None.
References
- 1.Badhiwala JH, Ahuja CS, Akbar MA, Witiw CD, Nassiri F, Furlan JC, Curt A, Wilson JR, Fehlings MG. Degenerative cervical myelopathy-update and future directions. Nat Rev Neurol. 2020;16:108–124. doi: 10.1038/s41582-019-0303-0. [DOI] [PubMed] [Google Scholar]
- 2.Pehlivanoglu T, Wuertz-Kozak K, Heider F, Sauer D, Wanke-Jellinek L, Mayer M, Mehren C. Clinical and radiographic outcome of patients with cervical spondylotic myelopathy undergoing total disc replacement. Spine (Phila Pa 1976) 2019;44:1403–1411. doi: 10.1097/BRS.0000000000003079. [DOI] [PubMed] [Google Scholar]
- 3.Maier IL, Hofer S, Joseph AA, Merboldt KD, Eggert E, Behme D, Schregel K, von der Brelie C, Rohde V, Koch J, Psychogios MN, Frahm J, Liman J, Bähr M. Quantification of spinal cord compression using T1 mapping in patients with cervical spinal canal stenosis-preliminary experience. Neuroimage Clin. 2019;21:101639. doi: 10.1016/j.nicl.2018.101639. [DOI] [PMC free article] [PubMed] [Google Scholar]
- 4.Sun B, Shi C, Wu H, Xu Z, Lin W, Shen X, Wu XD, Zhang Y, Yuan W. Application of zero-profile spacer in the treatment of three-level cervical spondylotic myelopathy: 5-year follow-up results. Spine (Phila Pa 1976) 2020;45:504–511. doi: 10.1097/BRS.0000000000003312. [DOI] [PubMed] [Google Scholar]
- 5.Zhang H, Guan L, Hai Y, Liu Y, Ding H, Chen X. Multi-shot echo-planar diffusion tensor imaging in cervical spondylotic myelopathy. Bone Joint J. 2020;102-B:1210–1218. doi: 10.1302/0301-620X.102B9.BJJ-2020-0468.R1. [DOI] [PubMed] [Google Scholar]
- 6.Madhu SV, Aslam M, Siddiqui AA, Goyal S, Mishra BK. Association of copeptin with sense of coherence in individuals with varying degrees of glucose intolerance. Psychosom Med. 2020;82:181–186. doi: 10.1097/PSY.0000000000000768. [DOI] [PubMed] [Google Scholar]
- 7.Machino M, Ando K, Kobayashi K, Ota K, Morozumi M, Tanaka S, Ito K, Kato F, Ishiguro N, Imagama S. Postoperative resolution of MR T2 increased signal intensity in cervical spondylotic myelopathy: the impact of signal change resolution on the outcomes. Spine (Phila Pa 1976) 2019;44:E1241–E1247. doi: 10.1097/BRS.0000000000003128. [DOI] [PubMed] [Google Scholar]
- 8.Ueberschaer M, Patzig M, Mueller K, Schwarting J, Trabold R, Tonn JC. Case report of a cervical myelomalacia caused by a thoracolumbar intradural disc herniation leading to intracranial hypotension. J Neurol. 2020;267:3421–3424. doi: 10.1007/s00415-020-10247-1. [DOI] [PMC free article] [PubMed] [Google Scholar]
- 9.Vivodtzev I, Picard G, O’Connor K, Taylor JA. Serotonin 1A agonist and cardiopulmonary improvements with whole-body exercise in acute, high-level spinal cord injury: a retrospective analysis. Eur J Appl Physiol. 2021;121:453–463. doi: 10.1007/s00421-020-04536-w. [DOI] [PMC free article] [PubMed] [Google Scholar]
- 10.Udalov OG, Mair LO, Martinez-Miranda L, Weinberg IN, Beloborodov IS. Hybrid magneto-electric materials for sensing of weak electric field using magnetic-resonance imaging. IEEE Trans Magn. 2020;56:1–7. [Google Scholar]
- 11.De A, Chowdhury AS. DTI based Alzheimer’s disease classification with rank modulated fusion of CNNs and random forest. Expert Syst Appl. 2020;169:114338. [Google Scholar]
- 12.Lee E, Lee JW, Bae YJ, Kim HJ, Kang Y, Ahn JM. Reliability of pre-operative diffusion tensor imaging parameter measurements of the cervical spine in patients with cervical spondylotic myelopathy. Sci Rep. 2020;10:17410. doi: 10.1038/s41598-020-74624-6. [DOI] [PMC free article] [PubMed] [Google Scholar]
- 13.Vedantam A, Rao A, Kurpad SN, Jirjis MB, Eckardt G, Schmit BD, Wang MC. Diffusion tensor imaging correlates with short-term myelopathy outcome in patients with cervical spondylotic myelopathy. World Neurosurg. 2017;97:489–494. doi: 10.1016/j.wneu.2016.03.075. [DOI] [PubMed] [Google Scholar]
- 14.Rajasekaran S, Kanna RM, Chittode VS, Maheswaran A, Aiyer SN, Shetty AP. Efficacy of diffusion tensor imaging indices in assessing postoperative neural recovery in cervical spondylotic myelopathy. Spine (Phila Pa 1976) 2017;42:8–13. doi: 10.1097/BRS.0000000000001667. [DOI] [PubMed] [Google Scholar]
- 15.Luo G, Zhu Y, Wang R, Tong Y, Lu W, Wang H. Random forest-based classsification and analysis of hemiplegia gait using low-cost depth cameras. Med Biol Eng Comput. 2020;58:373–382. doi: 10.1007/s11517-019-02079-7. [DOI] [PubMed] [Google Scholar]
- 16.Yeh KT, Chen IH, Lee RP, Yu TC, Peng CH, Liu KL, Wang JH, Wu WT. Two surgical strategies for treating multilevel cervical spondylotic myelopathy combined with kyphotic deformity. Medicine (Baltimore) 2020;99:e19215. doi: 10.1097/MD.0000000000019215. [DOI] [PMC free article] [PubMed] [Google Scholar]
- 17.Shahar D, Sayers MGL. Changes in the sagittal cranio-cervical posture following a 12-week intervention using a simple spinal traction device. Spine (Phila Pa 1976) 2019;44:447–453. doi: 10.1097/BRS.0000000000002874. [DOI] [PubMed] [Google Scholar]
- 18.Malik PRA, Doumouras AG, Malhan RS, Lee Y, Boudreau V, Barlow K, Karpinski M, Anvari M. Obesity, cancer, and risk reduction with bariatric surgery. Surg Clin North Am. 2021;101:239–254. doi: 10.1016/j.suc.2020.12.003. [DOI] [PubMed] [Google Scholar]
- 19.Cindil E, Sendur HN, Cerit MN, Dag N, Erdogan N, Celebi FE, Oner Y, Tali T. Validation of combined use of DWI and percentage signal recovery-optimized protocol of DSC-MRI in differentiation of high-grade glioma, metastasis, and lymphoma. Neuroradiology. 2021;63:331–342. doi: 10.1007/s00234-020-02522-9. [DOI] [PubMed] [Google Scholar]
- 20.Stabinska J, Ljimani A, Frenken M, Feiweier T, Lanzman RS, Wittsack HJ. Comparison of PGSE and steam DTI acquisitions with varying diffusion times for probing anisotropic structures in human kidneys. Magn Reson Med. 2020;84:1518–1525. doi: 10.1002/mrm.28217. [DOI] [PubMed] [Google Scholar]
- 21.Kawaguchi Y, Imagama S, Iwasaki M, Kaito T, Koda M, Chikuda H, Hasegawa T, Mori K, Yoshii T. Japanese orthopaedic association (JOA) clinical practice guidelines on the management of ossification of the spinal ligament, 2019. J Orthop Sci. 2021;26:1–45. doi: 10.1016/j.jos.2020.07.027. [DOI] [PubMed] [Google Scholar]
- 22.Gatto RG, Weissmann C. Diffusion tensor imaging in preclinical and human studies of Huntington’s disease: what have we learned so far? Curr Med Imaging Rev. 2019;15:521–542. doi: 10.2174/1573405614666181115113400. [DOI] [PubMed] [Google Scholar]
- 23.Passias PG, Horn SR, Oh C, Lafage R, Lafage V, Smith JS, Line B, Protopsaltis TS, Yagi M, Bortz CA, Segreto FA, Alas H, Diebo BG, Sciubba DM, Kelly MP, Daniels AH, Klineberg EO, Burton DC, Hart RA, Schwab FJ, Bess S, Shaffrey CI, Ames CP. Predicting the occurrence of postoperative distal junctional kyphosis in cervical deformity patients. Neurosurgery. 2020;86:E38–E46. doi: 10.1093/neuros/nyz347. [DOI] [PubMed] [Google Scholar]
- 24.Jannati A, Ryan M, Block G, Kayarian F, Pascual-Leone A. P223 utility of continuous theta-burst stimulation of motor cortex as a biomarker for adults with autism spectrum disorder: the role of BDNF and APOE polymorphisms. Clin Neurophysiol. 2020;131:e142–e143. [Google Scholar]
- 25.Willsey MS, Collins KL, Conrad EC, Chubb HA, Patil PG. Diffusion tensor imaging reveals microstructural differences between subtypes of trigeminal neuralgia. J Neurosurg. 2019 doi: 10.3171/2019.4.JNS19299. [Epub ahead of print] [DOI] [PubMed] [Google Scholar]
- 26.Rindler RS, Chokshi FH, Malcolm JG, Eshraghi SR, Mossa-Basha M, Chu J, Kurpad SN, Ahmad F. Spinal diffusion tensor imaging in the evaluation of pre- and post-operative severity in cervical spondylotic myelopathy: a systematic review of the literature. World Neurosurgery. 2016;99:150–158. doi: 10.1016/j.wneu.2016.11.141. [DOI] [PubMed] [Google Scholar]
- 27.Barrera CA, Bedoya MA, Delgado J, Berman JI, Chauvin NA, Edgar JC, Jaramillo D. Correlation between diffusion tensor imaging parameters of the distal femoral physis and adjacent metaphysis, and subsequent adolescent growth. Pediatr Radiol. 2019;49:1192–1200. doi: 10.1007/s00247-019-04443-z. [DOI] [PubMed] [Google Scholar]
- 28.Zhang C, Zhang Q, Pang Y, Song X, Zhou N, Wang J, He L, Lv J, Song Y, Cheng Y, Yang X. The protective effects of melatonin on oxidative damage and the immune system of the Chinese mitten crab (eriocheir sinensis) exposed to deltamethrin. Sci Total Environ. 2019;653:1426–1434. doi: 10.1016/j.scitotenv.2018.11.063. [DOI] [PubMed] [Google Scholar]
- 29.Yang X, Dong M, Li S, Chai R, Zhang Z, Li N, Zhang L. Diffusion-weighted imaging or dynamic contrast-enhanced curve: a retrospective analysis of contrast-enhanced magnetic resonance imaging-based differential diagnoses of benign and malignant breast lesions. Eur Radiol. 2020;30:4795–4805. doi: 10.1007/s00330-020-06883-w. [DOI] [PubMed] [Google Scholar]
- 30.Gibson J, Nouri A, Krueger B, Lakomkin N, Nasser R, Gimbel D, Cheng J. Degenerative cervical myelopathy: a clinical review. Yale J Biol Med. 2018;91:43–48. [PMC free article] [PubMed] [Google Scholar]
- 31.Lawrence JJ, Coenen W, Sánchez A, Pawlak G, Martínez-Bazán C, Haughton V, Lasheras JC. On the dispersion of a drug delivered intrathecally in the spinal canal. J Fluid Mech. 2019;861:679–720. [Google Scholar]
- 32.Liu H, MacMillian EL, Jutzeler CR, Ljungberg E, MacKay AL, Kolind SH, Mädler B, Li DKB, Dvorak MF, Curt A, Laule C, Kramer JLK. Assessing structure and function of myelin in cervical spondylotic myelopathy: evidence of demyelination. Neurology. 2017;89:602–610. doi: 10.1212/WNL.0000000000004197. [DOI] [PMC free article] [PubMed] [Google Scholar]