Abstract
Background: Bone morphogenetic proteins (BMPs) are members of the transforming growth factor-β superfamily, known to promote the tumor invasion and metastasis. There are continual progresses in understanding the role of BMP signaling pathways in carcinogenesis. However, the biological significance of BMPs in human melanoma has received very little attention. The study aimed to explore the effect of BMP inhibition on melanoma treated with LDN193189 (BMP inhibitor) using a quantitative proteomics approach in a melanoma xenograft model. Materials and methods: Melanoma tumor was induced in C57BL6 mice and treated intraperitoneally with LDN193189 for ten consecutive days. Post-treatment, tumors were collected, and comparative proteomics was performed using a high-resolution Orbitrap Fusion Tribrid mass spectrometer. Results: Treatment of melanoma with LDN193189 at 3 mg/kg body weight twice daily showed a significant decrease in the growth rate of the tumor compared to the other doses tested. Quantitative proteomic profiling identified 3231 proteins. Bioinformatics analysis of the 131 differentially expressed proteins selected by their relative abundance revealed that LDN193189 induces alterations in the cellular and metabolic process and the proteins that are involved in protein binding and catalytic activity in melanoma. Conclusions: Down-regulation of metallothionein (MT) 1 and MT2, emerging proteins for their role in tumor formation, progression, and drug resistance and transcription factor EB that plays a crucial role in the regulation of basic cellular processes, such as lysosomal biogenesis and autophagy, were identified upon inhibition of the BMP pathway in melanoma, suggesting their roles in melanoma growth. Understanding the role of these proteins will provide new directions for treating cancer.
Keywords: Chemotherapy, cancer, metallothionein, melanoma, proteomics, LDN193189, tumor
Introduction
Melanoma is a highly aggressive skin cancer, which has the fastest and second-fastest-growing rate of cancer in men and women, respectively. Among all skin cancers, melanoma occurs only in 4% of cases but responsible for 80% of deaths [1]. The lifetime risk of melanoma is currently estimated to be 22.8 (100000), and is rising every year [2]. The unkindness of melanoma is that prognosis of an early diagnosed melanoma is good, but metastasized melanoma is incurable. Although it has the fastest-growing incidence, the treatment efficiency of metastatic melanoma has not been significantly improved over the past 30 years, with a >10% survival rate in 5 years [3]. Surgery alone is clearly not beneficial to metastatic melanoma, and also melanoma is considered as a radio- and chemo-resistant tumor [4]. Although research is being done to treat melanoma with advanced knowledge of melanoma biology, the results are highly discouraging.
There are several combination chemotherapy regimens that are reported to have higher response rates and are more effective for metastatic melanoma [5]. Currently, protein targeted therapies are being used to inhibit the growth of melanoma [6]. The most commonly used protein targeted therapy is EGFR pathway inhibition since melanoma is mostly driven by the mutations in EGFR, or its downstream molecules. However, recent studies showed that inhibition of EGFR pathway or its downstream molecules develops drug resistance [7]. Hence, inhibitors of other pathways are being tested for their effectiveness against the growth of melanoma.
Recent studies have shown that the bone morphogenetic protein (BMP) signaling cascade is dysregulated in malignant melanoma [8-10]. BMPs are members of the transforming growth factor-β family. BMP has over 20 family members. Among them BMP-2, -4, -6, -7, and -9 are proposed as biomarkers for recurrence prediction and prognosis of cancer, and have been identified as novel prognostic biomarkers and potential therapeutic targets for cancer diagnosis and treatment [11]. BMP binds with cell surface receptor, serine/threonine kinase receptors (type I and type II) and form heteromeric complexes, thereby regulating the downstream signal transduction [12,13].
BMPs activate various Smad dependent cascade as well as mitogen-activated protein kinase pathways [10]. They help in numerous cellular processes, such as proliferation, differentiation, motility, cell death, and are also linked to tumor formation and progression [11,12]. Currently, there are several FDA-approved drugs available to target the BMP receptors. LDN-193189 is a small molecule inhibitor of BMP type I receptors and multi-kinase inhibitors that can target the kinases of BMP, MAPK14 (p38), MAPK8 (JNK), AKT, and mTOR signaling experimental models [14,15].
Mouse models are essential in cancer research and useful to study the tumor development and cancer progression by histopathology, genetic profiles, and response to therapeutics. The present study shows that inhibition of BMP pathway is a potential target for treating metastatic melanoma. However, further evidence is required to confirm the results. The present study compared melanoma proteomes of mouse models based on quantitative mass spectrometry.
Materials and method
Cell lines and cell culture
Mouse melanoma cell line B16F10 was purchased from the National Centre for Cell Science (Pune, India). Cells were grown in Dulbecco’s Modified Eagle Medium (Himedia, India) supplemented with 2 mM L-glutamine, 10% fetal bovine serum (Himedia, India), and 1% antibiotics (100 U/mL penicillin G and 100 mg/mL streptomycin) (Himedia, India), and maintained at 37°C in a humidified incubator of 5% CO2. BMP inhibitor (LDN193189) was purchased from Sigma-Aldrich (St. Louis, MO, USA) and dissolved in dimethyl sulfoxide (DMSO) (Himedia, India) and stored at -20°C as aliquots, for single-time use.
Measurement of cell viability
Cell viability was measured by 3-(4,5-Dimethylthiazol-2-yl)-2,5-Diphenyltetrazolium Bromide (MTT) assay using the methods published earlier [16]. Cells were treated with different concentrations of LDN193189 or vehicle (DMSO) for 72 h as described earlier [17,18], and the 50% inhibition concentrations (IC50) were derived from the dose-response curve.
Animals and care
Institutional Animal Ethical Committee approval (Reference no. 2014/1702) was taken prior to animal study. Committee for the Purpose of Control and Supervision of Experiments on Animals (CPCSEA) guidelines were strictly followed for the animal treatment.
Pathogen-free C57BL/6 mice, 6-8 weeks of age, both male and female, weighing 25±5 g were selected for the study from an inbred colony. All the animals were housed in a sterile polypropylene cage containing sterile paddy husk as bedding material and maintained under controlled conditions of temperature (23±2°C), humidity (55±5%) and light/dark (12 hour each) with sterile food and water ad libitum.
Melanoma induction in mice
The C57BL/6 mice were injected with a subcutaneous flank injection of B16F10 cells (5 × 10⁵) suspended in phosphate buffered saline (100 µL). The animals were checked every day for signs of a tumor and once visualized, tumor size was measured using vernier caliper and tumor volume was calculated by the formula: volume (mm3) = (0.52) × (length) × (width) × (height) (in mm). When the tumor attained a diameter of 100 mm, it was used for the drug treatment.
LDN-193189 treatment
Sham controls were injected with PBS (100 μL). Tumor-bearing mice were divided into different groups and treated intraperitoneally with LDN193189 using 1 cc syringe for 10 consecutive days.
Treatment groups
Group 1. Sham control.
Group 2. Two mg/kg body weight, intraperitoneal injection, twice a day.
Group 3. Three mg/kg body weight, intraperitoneal injection, once a day.
Group 4. Three mg/kg body weight, intraperitoneal injection, twice a day.
Procurement of specimens
For proteomic profiling of melanoma, sham-treated group and treatment group (with BMP inhibitor LDN-193189 at a dose of 3 mg/kg body weight, intraperitoneally injected, every 12 h, for ten consecutive days) were selected. Upon completion of the treatment, animals were sacrificed by cervical dislocation, the tumors were harvested (from both sham control and treatment groups) and snap frozen in liquid nitrogen and kept at -80°C until further use.
Mass spectrometric analysis
The proteomic analysis was done by liquid chromatography with tandem mass spectrometry (LC-MS-MS) and four tumors from each control and treatment were used (Figure 1).
Figure 1.
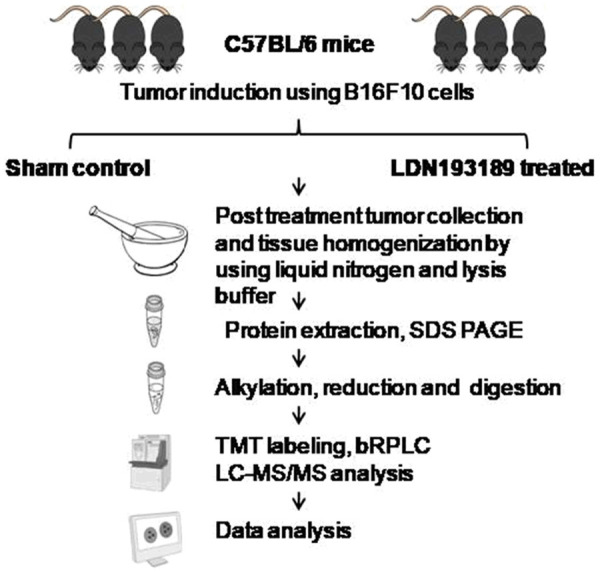
Flowchart of LC-MS/MS for a comparative analysis of protein expression in LDN193189 treated melanoma.
Sample preparation
The samples were snapfrozen in liquid nitrogen and lysed with lysis buffer containing 50 mM triethylammonium bicarbonate (TEABC), 4% sodium dodecyl sulfate (SDS) and phosphatase inhibitor (1 mM sodium orthovanadate, 2.5 mM sodium pyrophosphate and 1 mM β-glycerophosphate) and sonicated. The samples were heated at 95°C for 5 min, cooled to room temperature, and centrifuged at 12,000 rpm for 15 min at 4°C and the supernatant was collected. Protein estimation was performed using bicinchoninic acid (BCA) protein assay kit (Thermo Scientific, Massachusetts, USA).
Alkylation, reduction, and trypsin digestion
In-solution digestion was carried out as previously described [19]. Briefly, 300 µg protein from each condition was taken and reduced with 10 mM DTT at 60°C for 20 min and alkylated with 20 mM IAA at room temperature for 10 min in the dark. Acetone precipitation of protein was carried out by using six volumes of acetone and incubated at -20°C for 12 h, and protein was pelleted by centrifugation at 13,000 rpm for 20 min at 4°C. The pellet was resuspended in 50 mM TEABC and then digested with trypsin (1:20; trypsin:protein; Worthington) at 37°C, overnight. The peptides were dried using SpeedVac (Thermo Scientific) and used for TMT labeling dissolved in bRPLC solution A (1 mL; pH 9), centrifuged (16,000 × g for 5 min at 4°C), and the supernatant transferred to fresh microfuge tubes. Fractionation of the peptide digest was done using basic reverse phase chromatography. Each fraction (10%) was separated for liquid chromatography-tandem mass spectrometry (LC-MS/MS) analysis of the total proteome.
TMT labeling
Three hundred micrograms of trypsin-digested peptides from each group was labeled with Amine-Reactive Tandem Mass Tag Reagents (TMT6 Label Reagents; Thermo Scientific; #90068) according to the manufacturer’s protocol. The TMT labels were reconstituted before labeling in 41 µL of anhydrous acetonitrile (Sigma Aldrich) and added to the appropriate sample for labeling over 1 h at room temperature (RT). The tumor from sham control group was labeled with reagent 126, 127 and 128, and the treatment group was labeled with 129, 130 and 131. After 15 minutes, 8 µL of 5% hydroxylamine was added to quench each reaction. After quenching the reaction all samples were pooled together and processed for fractionation by bRPLC.
Basic reverse-phase LC-based fractionation (bRPLC)
Fractionation of the TMT labeled pooled peptide digest was done using basic reverse phase chromatography. The pooled digested sample was loaded on Waters XBridge column (Waters Corporation, Milford, MA, USA; 130Å, 5 µm, 250 × 4.6 mm) using a Hitachi LaChrom Elite HPLC system, maintaining a flow rate of 0.5 mL/min. The peptide separation was achieved using a 130-min gradient at a flow rate of 0.5 mL/min of solvent A (10 mM TEABC buffer, pH ~8.5) and B (10 mM TEABC buffer, 90% acetonitrile, pH ~8.5). The fractionation was continued at 97% solvent A for 20 min, followed by 3% solvent B for 0-5 min, 10% solvent B for 5-10 min, 10-35% solvent B for 10-40 min, and 100% solvent B for 40-45 min gradient. Flow-through fractions were collected in a 96-well plate and were finally concatenated into six fractions. Pooled fractions were lyophilized and stored at -80°C until they were subjected to tandem MS analysis.
LC-MS/MS analysis
LC-MS/MS analysis of the samples was performed using Q-Exactive plus hybrid quadrupole-Orbitrap mass spectrometer (Thermo Fisher Scientific, Bremen, Germany) interfaced with Easy-nLC-1200 (Thermo Scientific, Bremen, Germany). The peptides obtained after C18 cleaning were resuspended in 0.1% formic acid (Solvent A) and loaded onto the trap column (Thermo Scientific, 75 µm × 2 cm, nanoViper, 3 µm, 100 Å) filled with C18 at a flow rate of 4 µL/min. The peptides were further resolved onto an analytical column (Thermo Scientific EASY-Spray RSLC C18 2 µm 15 × 50 µm) with a flow rate of 300 nL/min, using a step gradient of 5-35% solvent B (0.1% formic acid in 80% acetonitrile) for first 105 min and 35-100% solvent B for 105-126 min. The total run time was set to 130 min. Data were acquired in data-dependent acquisition mode at a scan range of 400-1600, and in positive mode with a maximum injection time of 55 msec using an Orbitrap mass analyzer at a mass resolution of 70,000 at 400 m/z. Top 15 intense precursor ions were selected for each duty cycle and subjected to higher energy collision-induced dissociation with 34% normalized collision energy.
Bioinformatics data analysis
MS-derived data were analyzed with Proteome Discoverer software, version 2.1 (Thermo Scientific) with the SEQUEST HT and Mascot (version 2.5.1; Matrix Science, London, United Kingdom) search algorithms. It was searched against Mouse RefSeq 83 protein database (containing 76,332 entries with common contaminants). The common nodes for PD search include spectrum selector, MASCOT, SEQUEST search nodes, peptide validator, event detector, and precursor quantifier. Oxidation of methionine was set as a fixed modification. TMT labeling at lysine and carbamidomethylation of cysteine were set as variable modifications. The precursor mass tolerance was set at 10 ppm, and 0.05 Da was set for fragment ion tolerance. Trypsin was used as a proteolytic enzyme with a maximum of two missed cleavages. The data were searched against the decoy database with a 1% false discovery rate cutoff at the peptide level. The abundance information of proteins was extracted from PD into excel files. The intensity values of the proteins in the datasheet were normalized, and fold changes in treated tissue versus control tissue were calculated. The cutoff values of different proteins were appointed as follows: a relative abundance of more than 1.5 times was considered up-regulated or lower than 0.66 times as down-regulated. Further biological network analysis was performed using several bioinformatics tools with the Mus musculus genome as a background dataset such as DAVID Pathway analysis tool [20], Panther Pathway analysis tool [21], Human Protein Reference Database (HPRD) [22], and String Protein interaction analysis [23].
Availability of data
The mass spectrometry-derived data generated in this study were deposited to the ProteomeXchange Consortium [24] via the PRIDE partner repository with the dataset identifier PXD016088.
Statistical analysis
The data are presented as mean ± standard deviation (mean ± SD), and the significance between groups was analyzed by one-way analysis of variance (one-way ANOVA). The statistical significance was determined with a P-value threshold of <0.05. All experiments were repeated more than three times. Statistical analysis was performed using SPSS version 20 (SPSS, Inc., Chicago, IL, USA).
Results
Estimation of IC50 of LDN193189
MTT assay showed that after treatment with varying concentrations of LDN193189, there was a concentration-dependent reduction in cell viability. The IC50 values were 2.63 μM in B16F10 (Figure 2).
Figure 2.
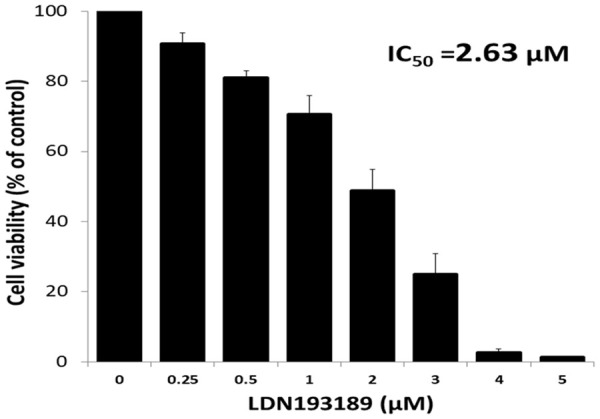
Cytotoxic effect of LDN193189 against mouse melanoma cells (B16F10). For MTT assay, B16F10 cells were treated with LDN193189 (0.25-5 μM) for 72 h. Data shown are mean ± SD of three replicate wells. A graph was plotted with concentration of LDN193189 (X-axis) vs. cell viability % (Y-axis) and the IC50 values were calculated using the formula y=b+ax. An IC50 value is the concentration of the drug which results in 50% cell death.
Quantification of LDN193189 dose for animal study
Three different doses of LDN193189 were used to assess the effective antitumor dose of LDN193189 and compared with the control group. The tumor of the control group showed continual growth. While the treatment of melanoma with 2 mg/kg body weight twice daily and 3 mg/kg body weight once daily delayed the tumor growth as compared to tumors in control group (Figure 3).
Figure 3.
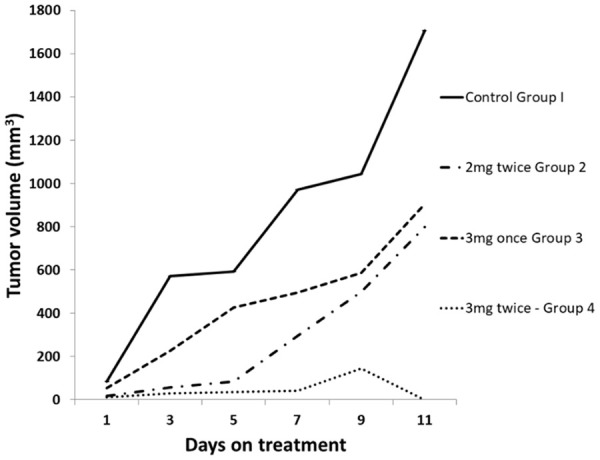
Effect of varying doses of LDN193189 on tumor growth in C57BL/6 mice. Mice were injected with B16F10 cells (2 × 10⁵) suspended in phosphate buffered saline (100 μL). Once the tumor reached a size of 100 mm3, control group was injected with normal saline, while treatment group was injected with BMP inhibitor LDN-193189 at different doses for 10 consecutive days (x-axis days 1 to 10). The values plotted are a mean of 3 animals in each group.
However, treatment of melanoma with LDN193189 at 3 mg/kg body twice daily showed a significant decrease in the rate of growth of the tumor as compared to the other doses tested. At this dose, the mice did not show any impairment of motion. In addition, postmortem examination of organs such as heart, liver, lungs, kidneys, and spleen, did not show any changes in the size. The visual examination of melanoma tumors showed complete necrosis of tissues (Figure 4).
Figure 4.

B16F10 melanoma tumor at day 1 and day 7 in control untreated group and treated group. Mice were injected with 5 × 10⁵ B16F10 cells suspended in 100 μL phosphate buffered saline. Once the tumor reached a size of 100 mm3, Control group was injected with normal saline while treatment group was injected with BMP inhibitor LDN193189 at a dose of 3 mg/kg body weight twice daily for ten consecutive days.
Identification of differentially expressed proteins by tandem mass spectrometry
For proteomic analysis, three biological replicates of control tumor and treatment tumor (3 mg/kg body weight, twice daily) were used. All six fractions of mouse melanoma tissue were analyzed for total proteome. The data obtained for LC-MS/MS were searched against the mouse reference database using Proteome discoverer 2.1, which identified 3231 proteins. The proteins within a group are ranked according to the number of peptides, the number of PSMs, their protein scores, and the sequence coverage. Of the 3231 proteins, 117 were up-regulated (fold change ≥1.5) while 14 were down-regulated (fold change ≤0.66).
This study performed global proteomic profiling of the mouse melanoma tissue treated with LDN193189 (BMP inhibitor) using in-solution methods. bRPLC fractionation yielded six fractions, which were subjected to LC-MS/MS analysis. Analysis of the LC-MS/MS data led to the identification of a total of 3231 nonredundant proteins. A schematic representation of the workflow employed for the analysis using a Q-Exactive plus hybrid quadrupole-Orbitrap mass spectrometer is shown in Figure 1. The complete list of the identified proteins is provided in the Supplementary Table 1 and a partial list of top 10 upregulated, and 10 most downregulated proteins are given in Table 1.
Table 1.
Genes and the fold change of proteins altered in the LDN193189 treated melanoma tissue
| Sl no | Up-regulated (fold change ≥1.5) | Down-regulated (fold change ≤0.66) | ||||
|---|---|---|---|---|---|---|
|
|
|
|||||
| Gene Symbol | Description | Fold change | Gene Symbol | Description | Fold change | |
| 1 | Car2 | carbonic anhydrase 2 isoform X1 | 7.813 | Mt2 | metallothionein-2 | 0.266 |
| 2 | Hbb-bt | hemoglobin, beta adult t chain | 6.061 | Ccdc126 | coiled-coil domain-containing protein 126 isoform 1 precursor | 0.276 |
| 3 | Pvalb | parvalbumin alpha isoform X1 | 4.565 | Mt1 | metallothionein-1 | 0.286 |
| 4 | Hba-a2 | hemoglobin alpha, adult chain 2 | 4.242 | Yaf2 | YY1-associated factor 2 isoform X1 | 0.334 |
| 5 | Scrn3 | secernin-3 isoform X1 | 3.952 | Tfeb | transcription factor EB isoform a | 0.355 |
| 6 | Slc4a1 | band 3 anion transport protein | 3.933 | Serpina1e | alpha-1-antitrypsin 1-5 precursor | 0.361 |
| 7 | Fga | fibrinogen alpha chain isoform 1 preproprotein | 3.582 | Hist2h2aa2 | histone H2A type 2-A | 0.477 |
| 8 | Fgg | fibrinogen gamma chain isoform 2 precursor | 3.427 | Hacd2 | 3-Hydroxyacyl-CoA Dehydratase 2 | 0.477 |
| 9 | Fgb | fibrinogen beta chain preproprotein | 3.360 | Hspb1 | heat shock protein beta-1 | 0.485 |
| 10 | Tnnc2 | troponin C, skeletal muscle | 3.155 | Hmga1 | high mobility group protein HMG-I/HMG-Y isoform a | 0.527 |
The data shown in the table are the altered proteins in the LDN193189 treated as compared to the untreated controls. The data obtained for LC-MS/MS were analyzed using Proteome discoverer 2.1, which compares the LC-MS/MS data against mouse database. This table shows 10 proteins with highest fold increase and 10 proteins which are most down-regulated, their gene symbol, and their fold change, i.e., concentration in LDN193189 treated melanoma/concentration in untreated melanoma.
Functional classification of proteins altered after LDN193189 treatment in melanoma tissue
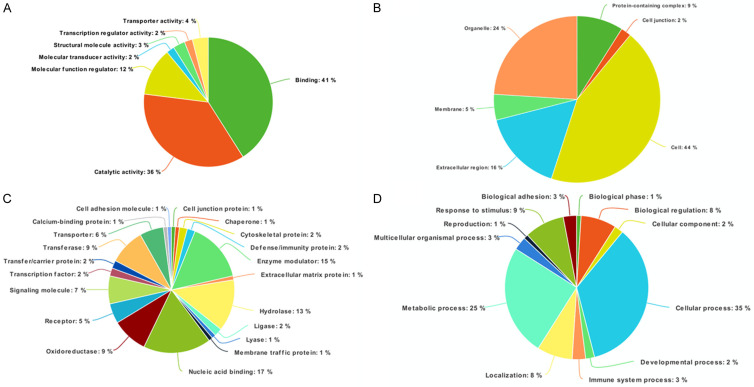
Proteins orchestrate various biochemical pathways and are involved in structural and functional aspects of cells and tissues. To better understand the functionality of the altered proteins identified after LDN193189 treatment, we carried out functional annotation using PANTHER to classify proteins based on their biological processes, molecular functions, and subcellular localization (Figure 5). Molecular functions showed majority of the proteins involved in protein binding (40.7%) and catalytic activity (36.1%). The subcellular localization analysis showed that a majority of the proteins are intracellular (43.8%) and in cell organelles (23.5%). The analysis of the biological process revealed a maximal number of proteins to be involved in cellular process (34.7%) and metabolic process (24.6%).
Figure 5.
Classification of protein function by Panther analysis. The proteins were classified using PANTHER classification system, based on: (A) Molecular function; (B) Biological processes; (C) Cellular components; and (D) Protein class.
Pathway enrichment analysis showed that most of the identified proteins are involved in complement and coagulation cascades, platelet activation, and regulation of actin cytoskeleton (Figure 6). String analysis showed that the protein involved in cell components and biological processes are those with most common interactions (Figure 7). Representative spectra of the proteins identified in our study are provided in Figure 8.
Figure 6.
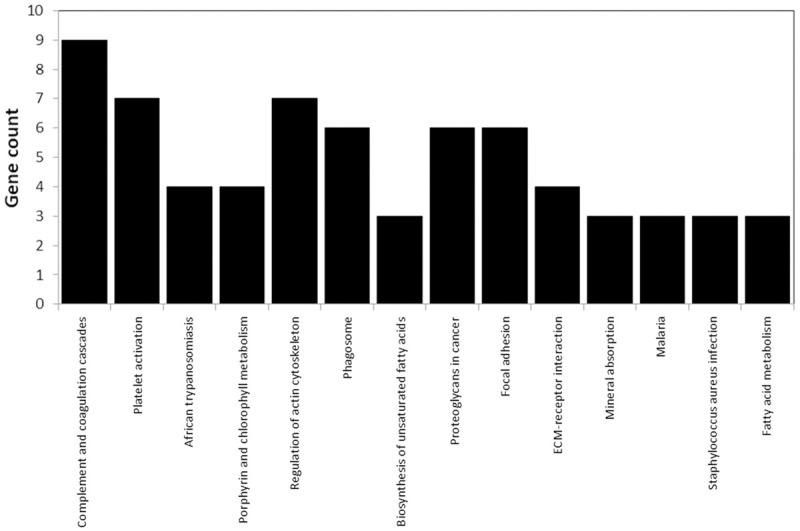
The signaling pathways associated with the proteins identified by DAVID annotation.
Figure 7.
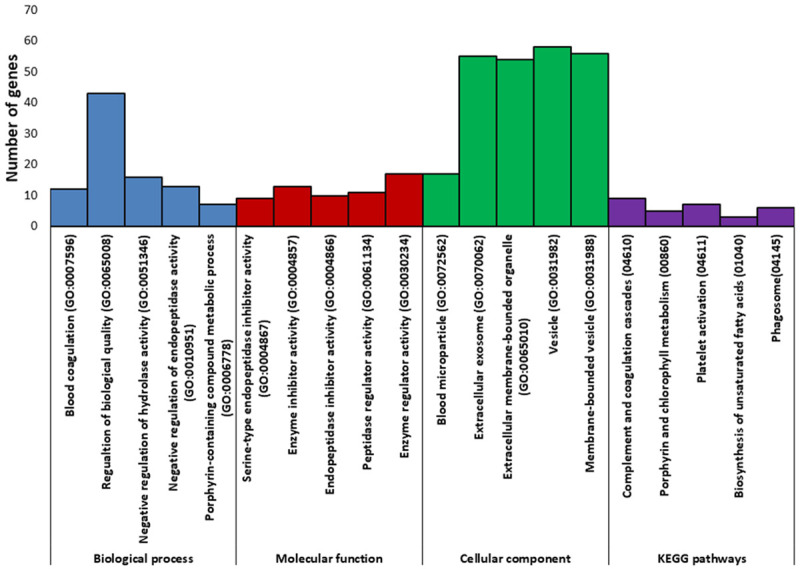
Pathway analysis of the proteins altered in LDN193189 treated melanoma tissue. This analysis was done using the String Protein interaction analysis.
Figure 8.
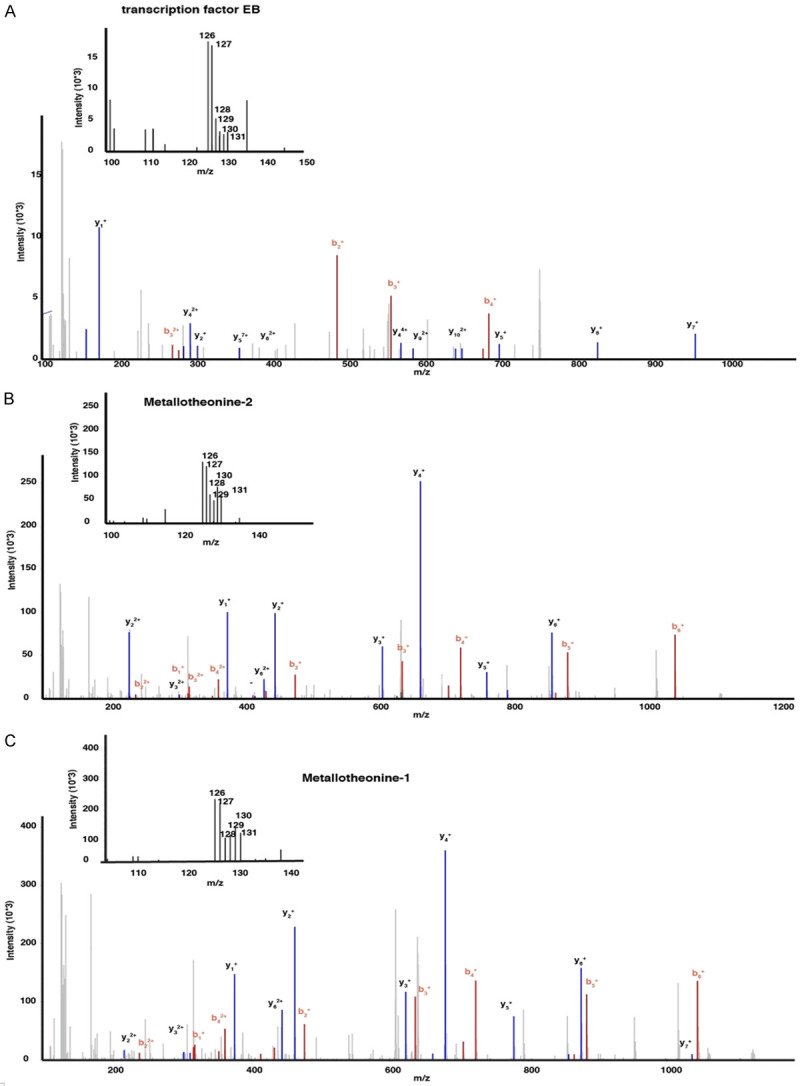
Representative MS/MS spectra identified in this study. A. Metallothionein 1; B. Metallothionein 2; C. Transcription factor EB.
Discussion
Malignant melanoma is one of the most aggressive human neoplasms and its incidence is still increasing. The BMP signaling plays dual role of development and invasion event in cancer by affecting, at the cellular and molecular levels, epithelial mesenchyme transition, cancer stem cells and angiogenesis [25]. BMP has been shown to regulate multiple downstream pathways including PI3K/AKT, MAPK/ERK, NF-κB, and STAT3 pathways, and SMAD signaling pathways [12]. Therefore BMP pathway is an attractive target for blocking the tumor growth.
LDN193189 is a selective inhibitor of BMP signaling for the BMP type I receptors, activin receptor-like kinase 1 (ALK1), ALK2, and ALK3. It can block cell migration and increase survival by reducing the proliferation and increasing apoptosis of cancer cells [26-28]. LDN193189 blocks the activation of Smad and non-Smad pathways by modulating MAPKs p38, ERK1/2 and the Akt pathway [13,29]. LDN193189 was also reported to inhibit the growth of breast and prostate cancers in vivo and prolong survival of mice bearing ovarian cancer cells which demonstrated that LDN193189 reduced the viability and enhanced the chemosensitivity of Smad4-silenced CRC cells in vitro. However, LDN193189 treatment has shown to enhance the metastatic property of bone [27]. In the present study, we used LDN193189 to demonstrate its anticancer activity for melanoma tumor.
LDN193189 has greater potency than its structural analog dorsomorphin and even low concentration (0.5 µM) is sufficient to inhibit phosphorylation of BMP mediated Smad activation [30]. In the present study we treated the mouse model with a dose of 3 mg/kg every 12 h, which has already been used in several earlier studies [26,27,30,31]. Administration of the LDN193189 (3 mg/kg intraperitoneally every 12 h) was able to inhibit tumor growth and visual examination showed complete necrosis of the tumor. This may be because LDN193189 was able to inhibit activation of SMAD1/5/8 and the downstream transcriptional activity which is induced by ALK2 in affected tissues [30]. In mice, the dose of 3 mg/kg every 12 h of LDN193189 showed no impairment of motion and no damage to vital organs such as the heart, liver, lungs, kidneys, and spleen, suggesting that it is a safe dose.
Quantitative proteomics is an emerging tool for identifying active and alteration in molecular pathways to understand the pathogenesis mechanisms, drug action, and resistance of diseases [32]. The present study compared melanoma proteomes of mouse models on the basis of quantitative mass spectrometry. Analysis of the melanoma proteome profiles resulted in identifying 117 proteins present at increased levels while 14 proteins present at reduced levels in mice with melanoma treated with LDN193189 compared with untreated melanoma.
The most down-regulated proteins included metallothionein (MT) 1 and 2 which are cysteine-rich low molecular mass proteins. The MT is involved in many physiological and pathophysiological processes such as apoptosis, proliferation, angiogenesis, and the detoxification of heavy metals suggesting its role in carcinogenesis and tumor therapy [33]. This study identified the reduced levels of MT1 and MT2 upon inhibition of the BMP pathway in melanoma, suggesting its role in melanoma growth. In the last decade, overexpression of immunohistochemically labeled MTs in paraffin-embedded tissues turned out to be a highly significant prognostic marker in different tumors [34,35].
The transcription factor EB (TFEB) plays a crucial role in regulating basic cellular processes, such as lysosomal biogenesis and autophagy [36]. TFEB provides a link between the nutrient-sensing mechanistic Target of Rapamycin Complex 1 (mTORC1) machinery and the transcriptional cellular response needed to cope with nutritional stress. Moreover, the interplay of oncogenic KRAS with TFEB and autophagy has been shown to be inversely correlated [37] and have negative impact on Wnt signaling. Therefore, inhibition of BMP pathways may disrupt the RAS signaling with TFEB and induces the cell death of melanoma.
Conclusion
This study demonstrated the inhibition of the BMP signaling pathway by LDN193189 and showed that it could inhibit tumor growth by regulating the survival of cancer cells. Mass spectrometric analysis showed that inhibition of the BMP signaling cascade with small molecule inhibitors decreased the expression of the MT1 and MT2 which are well known for the antiapoptotic, antioxidant, proliferative, and angiogenic effects in cancer. Both MT and TFEB proteins are well known regulators of cell death. Ultimately, findings of the present study suggest that inhibition of the BMP pathway may positively affect patients’ response to the current chemotherapeutic agents used.
Acknowledgements
We would also like to acknowledge Yenepoya Research Centre and Department of Biochemistry, Yenepoya (Deemed to be University) for infrastructure and core facility support for conducting this research. The authors also thank the Institute of Bioinformatics, Bangalore for extending the use of HPLC facility and Thermo Fisher Scientific Limited (Mass spectrometry division), Bangalore, for the use of mass spectrometry facility. We also acknowledge the help given by Mr. Saravanan Kumar, Group Leader Proteomics and Biopharma, Proteomics facility, Thermo Fisher Scientific India Pvt Ltd, Bangalore, India. The work was supported by funding from Board of Research in Nuclear Sciences (Ref no. 2013/34/8) sanctioned to DU and Yenepoya University Seed grant (Ref no. YU/YRC/Seed Grant/2016) to VRP. BSK received financial assistance as Senior Research Fellowship (Ref No. 08/652(001)/2017-EMR-l) from Council for Scientific and Industrial Research (CSIR), India.
Disclosure of conflict of interest
None.
Supporting Information
References
- 1.US Department of Health and Human Services. Washington (DC): 2014. Skin cancer as a major public health problem. The surgeon general’s call to action to prevent skin cancer. [Google Scholar]
- 2.American Cancer Society. Atlanta: American Cancer Society; 2020. “Cancer facts and figures 2020”. [DOI] [PMC free article] [PubMed] [Google Scholar]
- 3.Chantharasamee J, Treetipsatit J. Metastatic melanoma of uncertain primary with 5-year durable response after conventional therapy: a case report with literature review. Case Rep Oncol Med. 2018;2018:7289896. doi: 10.1155/2018/7289896. [DOI] [PMC free article] [PubMed] [Google Scholar]
- 4.Kalal BS, Upadhya D, Pai VR. Chemotherapy resistance mechanisms in advanced skin cancer. Oncol Rev. 2017;11:326. doi: 10.4081/oncol.2017.326. [DOI] [PMC free article] [PubMed] [Google Scholar]
- 5.Krattinger R, Ramelyte E, Dornbierer J, Dummer R. Is single versus combination therapy problematic in the treatment of cutaneous melanoma? Expert Rev Clin Pharmacol. 2019;14:9–23. doi: 10.1080/17512433.2019.1650641. [DOI] [PubMed] [Google Scholar]
- 6.Wong DJ, Ribas A. Targeted therapy for melanoma. Cancer Treat Res. 2016;167:251–262. doi: 10.1007/978-3-319-22539-5_10. [DOI] [PubMed] [Google Scholar]
- 7.Dratkiewicz E, Simiczyjew A, Pietraszek-Gremplewicz K, Mazurkiewicz J, Nowak D. Characterization of melanoma cell lines resistant to vemurafenib and evaluation of their responsiveness to EGFR- and MET-inhibitor treatment. Int J Mol Sci. 2019;21:113. doi: 10.3390/ijms21010113. [DOI] [PMC free article] [PubMed] [Google Scholar]
- 8.Rothhammer T, Poser I, Soncin F, Bataille F, Moser M, Bosserhoff AK. Bone morphogenic proteins are overexpressed in malignant melanoma and promote cell invasion and migration. Cancer Res. 2005;65:448–456. [PubMed] [Google Scholar]
- 9.Hsu MY, Rovinsky S, Penmatcha S, Herlyn M, Muirhead D. Bone morphogenetic proteins in melanoma: angel or devil? Cancer Metastasis Rev. 2005;24:251–263. doi: 10.1007/s10555-005-1575-y. [DOI] [PubMed] [Google Scholar]
- 10.Guo X, Wang XF. Signaling cross-talk between TGF-beta/BMP and other pathways. Cell Res. 2009;19:71–88. doi: 10.1038/cr.2008.302. [DOI] [PMC free article] [PubMed] [Google Scholar]
- 11.Bach DH, Park HJ, Lee SK. The dual role of bone morphogenetic proteins in cancer. Mol Ther Oncolytics. 2017;8:1–13. doi: 10.1016/j.omto.2017.10.002. [DOI] [PMC free article] [PubMed] [Google Scholar]
- 12.Zhang L, Ye Y, Long X, Xiao P, Ren X, Yu J. BMP signaling and its paradoxical effects in tumorigenesis and dissemination. Oncotarget. 2016;7:78206–78218. doi: 10.18632/oncotarget.12151. [DOI] [PMC free article] [PubMed] [Google Scholar]
- 13.Guicheux J, Lemonnier J, Ghayor C, Suzuki A, Palmer G, Caverzasio J. Activation of p38 mitogen-activated protein kinase and c-Jun-NH2-terminal kinase by BMP-2 and their implication in the stimulation of osteoblastic cell differentiation. J Bone Miner Res. 2003;18:2060–2068. doi: 10.1359/jbmr.2003.18.11.2060. [DOI] [PubMed] [Google Scholar]
- 14.Sanvitale CE, Kerr G, Chaikuad A, Ramel MC, Mohedas AH, Reichert S, Wang Y, Triffitt JT, Cuny GD, Yu PB, Hill CS, Bullock AN. A new class of small molecule inhibitor of BMP signaling. PLoS One. 2013;8:e62721. doi: 10.1371/journal.pone.0062721. [DOI] [PMC free article] [PubMed] [Google Scholar]
- 15.Vogt J, Traynor R, Sapkota GP. The specificities of small molecule inhibitors of the TGFss and BMP pathways. Cell Signal. 2011;23:1831–1842. doi: 10.1016/j.cellsig.2011.06.019. [DOI] [PubMed] [Google Scholar]
- 16.van Meerloo J, Kaspers GJ, Cloos J. Cell sensitivity assays: the MTT assay. Methods Mol Biol. 2011;731:237–245. doi: 10.1007/978-1-61779-080-5_20. [DOI] [PubMed] [Google Scholar]
- 17.Kalal BS, Pai VR, Behera SK, Somashekarappa HM. HDAC2 inhibitor valproic acid increases radiation sensitivity of drug-resistant melanoma cells. Med Sci (Basel) 2019;7:51. doi: 10.3390/medsci7030051. [DOI] [PMC free article] [PubMed] [Google Scholar]
- 18.Kalal BS, Pai VR, Upadhya D. Valproic acid reduces tumor cell survival and proliferation with inhibitors of downstream molecules of epidermal growth factor receptor pathway. J Pharmacol Pharmacother. 2018;9:11–16. [Google Scholar]
- 19.Marimuthu A, O’Meally RN, Chaerkady R, Subbannayya Y, Nanjappa V, Kumar P, Kelkar DS, Pinto SM, Sharma R, Renuse S, Goel R, Christopher R, Delanghe B, Cole RN, Harsha HC, Pandey A. A comprehensive map of the human urinary proteome. J Proteome Res. 2011;10:2734–2743. doi: 10.1021/pr2003038. [DOI] [PMC free article] [PubMed] [Google Scholar]
- 20.Huang DW, Sherman BT, Tan Q, Collins JR, Alvord WG, Roayaei J, Stephens R, Baseler MW, Lane HC, Lempicki RA. The DAVID gene functional classification tool: a novel biological module-centric algorithm to functionally analyze large gene lists. Genome Biol. 2007;8:R183. doi: 10.1186/gb-2007-8-9-r183. [DOI] [PMC free article] [PubMed] [Google Scholar]
- 21.Mi H, Huang X, Muruganujan A, Tang H, Mills C, Kang D, Thomas PD. PANTHER version 11: expanded annotation data from gene ontology and reactome pathways, and data analysis tool enhancements. Nucleic Acids Res. 2017;45:D183–D189. doi: 10.1093/nar/gkw1138. [DOI] [PMC free article] [PubMed] [Google Scholar]
- 22.Keshava Prasad TS, Goel R, Kandasamy K, Keerthikumar S, Kumar S, Mathivanan S, Telikicherla D, Raju R, Shafreen B, Venugopal A, Balakrishnan L, Marimuthu A, Banerjee S, Somanathan DS, Sebastian A, Rani S, Ray S, Harrys Kishore CJ, Kanth S, Ahmed M, Kashyap MK, Mohmood R, Ramachandra YL, Krishna V, Rahiman BA, Mohan S, Ranganathan P, Ramabadran S, Chaerkady R, Pandey A. Human protein reference database--2009 update. Nucleic Acids Res. 2009;37:D767–772. doi: 10.1093/nar/gkn892. [DOI] [PMC free article] [PubMed] [Google Scholar]
- 23.Szklarczyk D, Morris JH, Cook H, Kuhn M, Wyder S, Simonovic M, Santos A, Doncheva NT, Roth A, Bork P, Jensen LJ, von Mering C. The STRING database in 2017: quality-controlled protein-protein association networks, made broadly accessible. Nucleic Acids Res. 2017;45:D362–D368. doi: 10.1093/nar/gkw937. [DOI] [PMC free article] [PubMed] [Google Scholar]
- 24.Perez-Riverol Y, Csordas A, Bai J, Bernal-Llinares M, Hewapathirana S, Kundu DJ, Inuganti A, Griss J, Mayer G, Eisenacher M, Perez E, Uszkoreit J, Pfeuffer J, Sachsenberg T, Yilmaz S, Tiwary S, Cox J, Audain E, Walzer M, Jarnuczak AF, Ternent T, Brazma A, Vizcaino JA. The PRIDE database and related tools and resources in 2019: improving support for quantification data. Nucleic Acids Res. 2019;47:D442–D450. doi: 10.1093/nar/gky1106. [DOI] [PMC free article] [PubMed] [Google Scholar]
- 25.Choi S, Yu J, Park A, Dubon MJ, Do J, Kim Y, Nam D, Noh J, Park KS. BMP-4 enhances epithelial mesenchymal transition and cancer stem cell properties of breast cancer cells via notch signaling. Sci Rep. 2019;9:11724. doi: 10.1038/s41598-019-48190-5. [DOI] [PMC free article] [PubMed] [Google Scholar]
- 26.Ali JL, Lagasse BJ, Minuk AJ, Love AJ, Moraya AI, Lam L, Arthur G, Gibson SB, Morrison LC, Werbowetski-Ogilvie TE, Fu Y, Nachtigal MW. Differential cellular responses induced by dorsomorphin and LDN-193189 in chemotherapy-sensitive and chemotherapy-resistant human epithelial ovarian cancer cells. Int J Cancer. 2015;136:E455–469. doi: 10.1002/ijc.29220. [DOI] [PubMed] [Google Scholar]
- 27.Vollaire J, Machuca-Gayet I, Lavaud J, Bellanger A, Bouazza L, El Moghrabi S, Treilleux I, Coll JL, Peyruchaud O, Josserand V, Cohen PA. The bone morphogenetic protein signaling inhibitor LDN-193189 enhances metastasis development in mice. Front Pharmacol. 2019;10:667. doi: 10.3389/fphar.2019.00667. [DOI] [PMC free article] [PubMed] [Google Scholar]
- 28.Owens P, Pickup MW, Novitskiy SV, Giltnane JM, Gorska AE, Hopkins CR, Hong CC, Moses HL. Inhibition of BMP signaling suppresses metastasis in mammary cancer. Oncogene. 2015;34:2437–2449. doi: 10.1038/onc.2014.189. [DOI] [PMC free article] [PubMed] [Google Scholar]
- 29.Boergermann JH, Kopf J, Yu PB, Knaus P. Dorsomorphin and LDN-193189 inhibit BMP-mediated Smad, p38 and Akt signalling in C2C12 cells. Int J Biochem Cell Biol. 2010;42:1802–1807. doi: 10.1016/j.biocel.2010.07.018. [DOI] [PMC free article] [PubMed] [Google Scholar]
- 30.Yu PB, Deng DY, Lai CS, Hong CC, Cuny GD, Bouxsein ML, Hong DW, McManus PM, Katagiri T, Sachidanandan C, Kamiya N, Fukuda T, Mishina Y, Peterson RT, Bloch KD. BMP type I receptor inhibition reduces heterotopic [corrected] ossification. Nat Med. 2008;14:1363–1369. doi: 10.1038/nm.1888. [DOI] [PMC free article] [PubMed] [Google Scholar]
- 31.Dinter T, Bocobo GA, Yu PB. Pharmacologic strategies for assaying BMP signaling function. Methods Mol Biol. 2019;1891:221–233. doi: 10.1007/978-1-4939-8904-1_16. [DOI] [PMC free article] [PubMed] [Google Scholar]
- 32.Sengupta D, Tackett AJ. Proteomic findings in melanoma. J Proteomics Bioinform. 2016;9:e29. doi: 10.4172/jpb.1000e29. [DOI] [PMC free article] [PubMed] [Google Scholar]
- 33.Bizon A, Jedryczko K, Milnerowicz H. The role of metallothionein in oncogenesis and cancer treatment. Postepy Hig Med Dosw (Online) 2017;71:98–109. doi: 10.5604/01.3001.0010.3794. [DOI] [PubMed] [Google Scholar]
- 34.Weinlich G. Metallothionein-overexpression as a prognostic marker in melanoma. G Ital Dermatol Venereol. 2009;144:27–38. [PubMed] [Google Scholar]
- 35.Mangelinck A, da Costa MEM, Stefanovska B, Bawa O, Polrot M, Gaspar N, Fromigue O. MT2A is an early predictive biomarker of response to chemotherapy and a potential therapeutic target in osteosarcoma. Sci Rep. 2019;9:12301. doi: 10.1038/s41598-019-48846-2. [DOI] [PMC free article] [PubMed] [Google Scholar]
- 36.Napolitano G, Ballabio A. TFEB at a glance. J Cell Sci. 2016;129:2475–2481. doi: 10.1242/jcs.146365. [DOI] [PMC free article] [PubMed] [Google Scholar]
- 37.Moruno-Manchon JF, Uzor NE, Kesler SR, Wefel JS, Townley DM, Nagaraja AS, Pradeep S, Mangala LS, Sood AK, Tsvetkov AS. TFEB ameliorates the impairment of the autophagy-lysosome pathway in neurons induced by doxorubicin. Aging (Albany NY) 2016;8:3507–3519. doi: 10.18632/aging.101144. [DOI] [PMC free article] [PubMed] [Google Scholar]
Associated Data
This section collects any data citations, data availability statements, or supplementary materials included in this article.
Supplementary Materials
Data Availability Statement
The mass spectrometry-derived data generated in this study were deposited to the ProteomeXchange Consortium [24] via the PRIDE partner repository with the dataset identifier PXD016088.


