Abstract
The coronavirus (CoV) spike (S) protein, involved in viral–host cell fusion, is the primary immunogenic target for virus neutralization and the current focus of many vaccine design efforts. The highly flexible S-protein, with its mobile domains, presents a moving target to the immune system. Here, to better understand S-protein mobility, we implemented a structure-based vector analysis of available β-CoV S-protein structures. Despite overall similarity in domain organization, we found that S-proteins from different β-CoV display distinct configurations. Based on this analysis, we developed two soluble ectodomain constructs for SARS-CoV-2 S-protein in which the highly immunogenic and mobile receptor binding domain (RBD) is either locked in the all-RBDs ‘down’ position or adopts ‘up’ state conformations more readily than wild-type S-protein. These results demonstrate that the conformation of the S-protein can be controlled via rational design and provide a framework for the development of engineered coronavirus spike proteins for vaccine applications.
Introduction
The ongoing global pandemic of the novel SARS-CoV-2 coronavirus presents an urgent need for the development of effective preventative and treatment therapies. The viral S-protein is a prime target for such therapies owing to its critical role in the virus lifecycle. The transmembrane CoV S-protein spike trimer is composed of interwoven protomers that include an N-terminal receptor binding S1 subunit and a C-terminal S2 subunit that contains the fusion elements (Figure 1A and B).1 The S1 subunit is subdivided into the N-terminal domain (NTD) followed by the receptor binding domain (RBD) and two structurally conserved subdomains (SD1 and SD2). Together these domains cap the S2 subunit, protecting the conserved fusion machinery. Binding to host receptor via the RBD in S1 is followed by proteolytic cleavage of the spike by host proteases2. Large conformational changes in the S-protein result in S1 shedding and exposure of the fusion machinery in S2. Class I fusion proteins, such as the CoV-2 S-protein, undergo large conformational changes during the fusion process and must, by necessity, be highly flexible and dynamic. Indeed, cryo-electron microscopy (cryo-EM) structures of SARS-CoV-2 spike reveal considerable flexibility and dynamics in the S1 subunit1,2, especially around the RBD that exhibits two discrete conformational states – a ‘down’ state that is shielded from receptor binding, and an ‘up’ state that is receptor-accessible.
Figure 1. Vector-based analysis of the CoV S-protein demonstrates remarkable variability in S-protein conformation within ‘up’ and ‘down’ states between CoV strains.
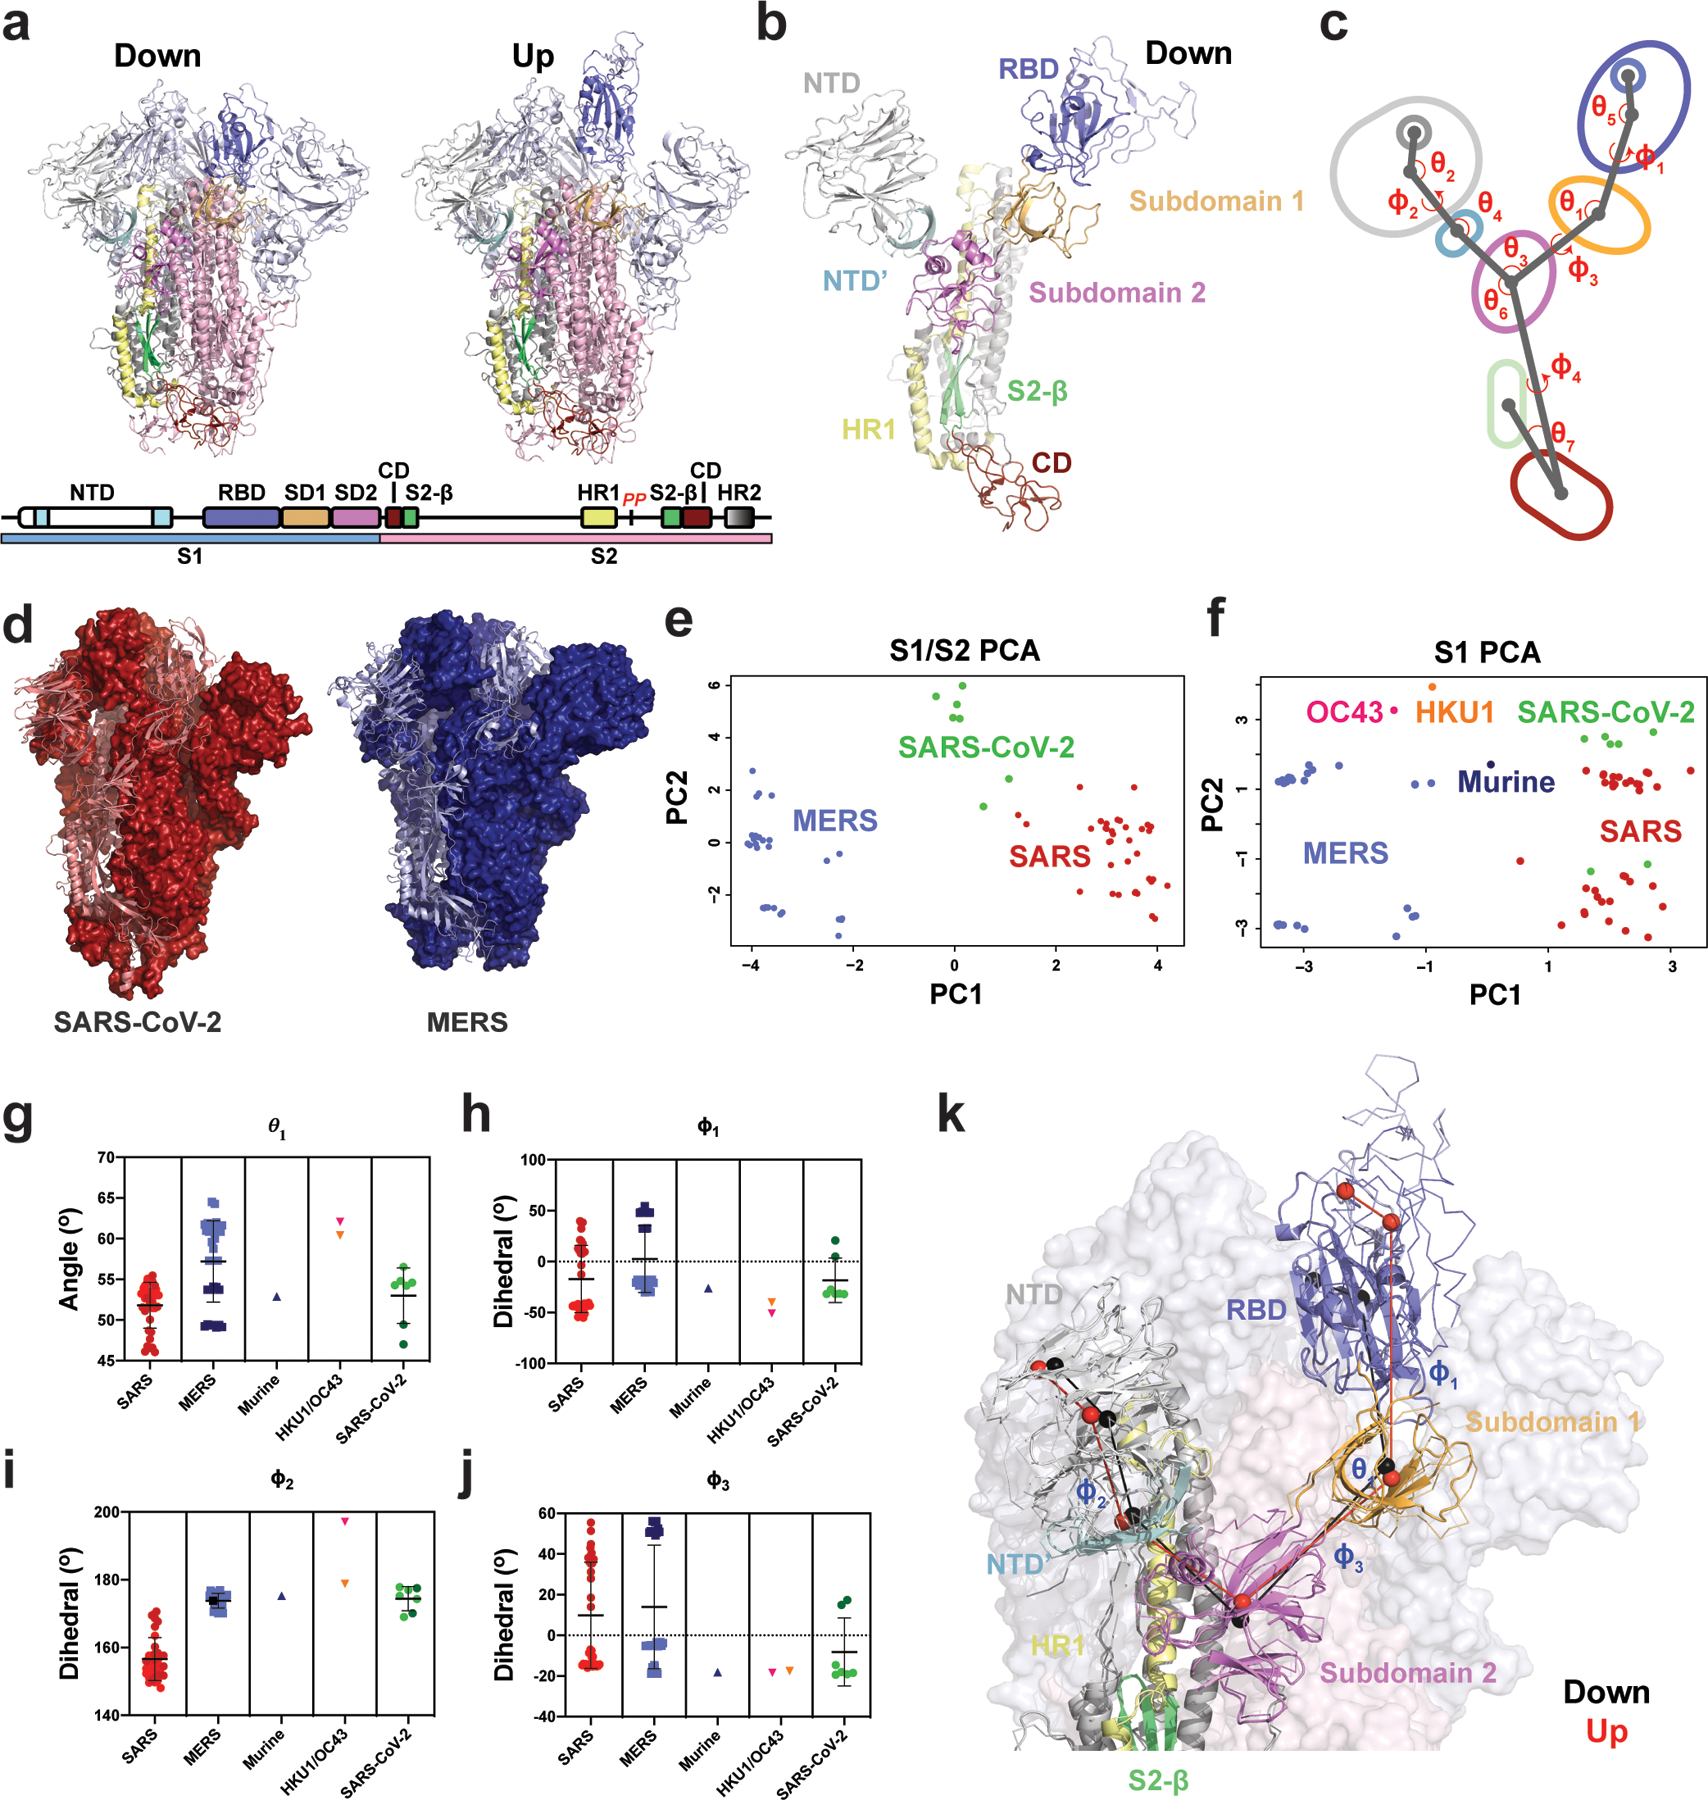
A) Cartoon representations of ‘down’ (upper left) and ‘up’ (upper right) state SARS-2 structures (PDB 6VXX and 6VYB, respectively) colored according to the specified domains (lower). B) A single ‘down’ state protomer of the CoV S-protein with labeled domains (PDB 6VXX). The receptor binding domain (RBD) is in its ‘down’ conformation. C) A simplified diagram of the CoV S-protein depicting the centroids and vectors connecting them, with the determine angles (θ) and dihedrals (ϕ) labeled. D) The SARS-2 (left; red, PDB 6VXX) and MERS (right; blue, PDB 6Q04) structures, each with a single protomer depicted in cartoon representation and the remaining two in surface representation. The structures were aligned with the images captured from the same angle for visualization. E) Principal components analysis (PCA) of the SARS and MERS protomers showing measures between S1 and S2 domains. F) Principal components analysis of the SARS, MERS, HKU1, and Murine CoV protomers showing measures only between S1 domains. G) Angle between the SD2-to-SD1 vector and the SD1-to-RBD vector. H) Dihedral about the SD1-to-RBD vector. I) Dihedral about the NTD-to-NTD’ vector. The OC43 value of −162° was adjusted to 197 °(+360 °) for visualization here. J) Dihedral about the SD2-to-SD1 vector. Data points for SARS, MERS, and SARS-2 in g–j colored according to ‘up’ (dark) and ‘down’ (light) states and color code in the PCA analysis in panels e and f. Lines show mean and s.d. The PDB IDs for all structures represented in the PCA and angle/dihedral plots are listed in Supplementary Table 1. K) Structural representation of the (G)-(J) angles and dihedrals overlaid on an alignment between a SARS-2 ‘down’ (cartoon structure with black centroids and lines; PDB 6VXX) and ‘up’ (ribbon structure with red centroids and lines; PDB 6VYB) state protomer. Adjacent protomers are depicted as a transparent surface with S1 (light blue) and S2 (light pink). Source data for graphs here are in Supplementary Data 1.
The wealth of structural information for β-CoV spike proteins, including the recently determined cryo-EM structures of the SARS-CoV-2 spike1–11, has provided a rich source of detailed geometric information from which to begin precise examination of the macromolecular transitions underlying triggering of this fusion machine. Several structures of soluble ectodomain constructs that retain the complete S1 subunit and the surface exposed S2 subunit have been determined. These include SARS-CoV-21,3, SARS4–8, MERS4,9, and other human1,10 and murine11 β-CoV spike proteins. These structures revealed remarkable conformational heterogeneity in the S-protein spikes, especially in the RBD region. Within a single protomer, the RBD could adopt a closed ‘down’ state in which the RBD covers the apical region of the S2 protein near the C-terminus of the first heptad repeat (HR1), or an open ‘up’ state in which the RBD is dissociated from the apical central axis of S2 and the NTD (Figure 1A). Further, the cryo-EM structures strongly suggested a large degree of domain flexibility in both the ‘down’ and ‘up’ states in the NTD and RBD. While these structures have provided essential information to identify the relative arrangement of these domains, the degree to which conformational heterogeneity may be altered via mutation during the natural evolution of the virus and in a vaccine immunogen design context remains to be determined.
In this study we have quantified the variability in the S1 and S2 geometric arrangements to reveal important regions of flexibility to consider and to target for structure-based immunogen design. Based on these analyses, we have designed mutations that alter the conformational distribution of the domains in the S-protein. We visualized the effect of our designs using a structural determination pipeline relying first on single particle analysis by negative stain electron microscopy (NSEM) for rapid and low-cost assessment of the spike ectodomains at low resolution, followed by cryo-EM for high-resolution information on the changes introduced by these mutations. Our results reveal a heterogeneous conformational landscape of the SARS-CoV-2 spike that is highly susceptible to modification by the introduction of mutations at sites of contact between the S1 and S2 subunits. We also present data on modified SARS-CoV-2 ectodomain constructs stabilized in conformations that have not yet been seen in the current available structures, with great interest and direct application in vaccine design.
Results
Defining domain geometry and arrangements in SARS-CoV-2 spike.
To characterize the unique arrangement of distinct domains in the different β-CoV spikes, we first developed a quantitative definition of their relative positions (Figure 1). Examination of available SARS and MERS S-protein structures revealed: 1) domains in the S1 subunit (NTD, RBD, and subdomains) and in the S2 subunit (connector domain, or CD) move as rigid bodies, and 2) these domains display a pronounced array of relative shifts between those in the S1 subunit and the S2 subunit β-sheet motif and CD. In order to quantify these movements, we analyzed the relevant regions of motion and their structural disposition in available β-CoV ectodomain spike structures, including 15 for SARS4,5,7,8, 16 for MERS4,8,12,13, one each for HKU11,10, OC431,10 and a murine β-CoV; and three SARS-CoV-214,15 structures (Figures 1E–J and Extended Data Figure 1). Each protomer in these structures displaying asymmetric ‘up’/down’ RBD states was examined independently, yielding a dataset of 83 structural states. Structures lacking the RBD were not analyzed. Only the S1 subunits were analyzed for the HKU1, OC43 and murine β-CoV S-protein structures. Information regarding whether the constructs are cleaved, mutated, and/or liganded is provided in Supplementary Table 1.
The NTD was split into a primary N-terminal section and a secondary C-terminal section based upon visual inspection of this region in the various β-CoV structures. Vectors connecting each region’s Cα centroids were generated and used to define the relative dispositions of the domains (Figures 1B–C). The vector magnitudes and select angles and dihedrals were used to identify the breadth of differences in domain positioning and compare between β-CoV viruses (Figure 1E–J). Projecting the S1 and S2 subunit vector data for SARS-CoV-1, MERS, and SARS-CoV-2 using the principal components analysis method revealed each virus’s S-protein structures resided in distinct clusters (Figure 1E). A similar analysis of the S1 subunit vectors with the addition of data from the murine β-CoV, HKU1, and OC43 generally retained these clusters, with the three additional structures lying in relatively unique positions (Figure 1F). SARS-CoV-1 structures split into two distinct clusters, separated largely by differences in the ‘up’/’down’ states with SARS-CoV-2 structures splitting with it. The distinct clustering of SARS-CoV-1 compared to SARS-CoV-2 in the PCA results which include the S2 subunit data suggests that there are key differences in the S1 disposition relative to S2 between SARS-CoV-1 and SARS-CoV-2.
Consistent with the PCA analysis, examination of specific angles and dihedrals indicated that β-CoV spike proteins in various viruses differ markedly from one another (Figure 1G–J). This is in addition to considerable variability in the domain arrangements within different virus S-proteins, demonstrating its wide structural lability (Figures 1E–J). In particular, both ϕ1 and ϕ3 (Figure 1H and J), describing the dihedrals about the vector connecting SD2 to SD1 and the vector connecting SD1 to the RBD (Figure 1B and C), respectively, effectively reported on the ‘up’ and ‘down’ configurations and indicated substantial differences between SARS-CoV-1 and MERS in both the ‘up’ and ‘down’ states. Differences in the angular disposition of the NTD elements of SARS-CoV-1 and MERS as measured by ϕ1, θ2 and θ4 were also observed (Figure 1I and Extended Data Figure 1A and C). Additional S1 and S1/S2 subunit differences between viruses were observed for vectors involving SD2. This includes the SD2 to CD ϕ4 dihedral which differs markedly between MERS/SARS-CoV-2 and SARS-CoV-1, and the angle between the vectors connecting the NTD’ to SD2 and SD2 to the CD demonstrating a shift in SARS-CoV-2 (Extended Data Figure 1E and G). Finally, the disposition of the CD to the inner portion of S2 measured as an angle between a vector connected to an interior S2 β-sheet motif and the vector connecting the CD to SD2 indicates SARS-CoV-1 differs from both MERS and SARS-CoV-2 (Extended Data Figure 1F). The MERS disposition appears to respond to RBD triggering in some structures, displaying a bimodal distribution (Extended Data Figure 1F).
These results demonstrate that, while the individual domain architectures and overall arrangements are conserved, important differences between these domains exists between viruses, suggesting that subtle differences in inter-domain contacts could play a major role in determining these distributions and thereby alter surface antigenicity and the propensity of the domains to access ‘up’ and ‘down’ RBD states.
Differential stabilization of SARS-CoV-2 spike ectodomain RBD orientation.
Based on the observed variability in the analysis of β-CoV spikes, we asked whether the propensity for the RBD to display the ‘down’ and ‘up’ states could be modified via mutations, without altering exposed antigenic surfaces. We focused on domain pairs that moved relative to each other (Figure 1) and identified interaction sites that could alter the S-protein conformational distribution. That is, modification of the ‘up’/’down’ equilibrium could be achieved by modifying either RBD or subdomain contact surfaces. To this end, we selected contact regions between the RBD and S2, the RBD and NTD, SD1 and S2, and SD2 and S2. Mutations at these sites were selected based upon in silico mutagenesis using the Schrödinger Biologics suite16,17,18. To eliminate exposure of the receptor binding site of the RBD, we examined the potential for disulfide linkages between the RBD and its contact with S2 near the C-terminus of HR1 to prevent RBD exposure.
We identified a double cysteine mutant, S383C D985C (RBD to S2 double mutant; rS2d; Extended Data Figure 2), as a candidate. The transition from the ‘down’ state to the ‘up’ state involves shifts in the RBD to NTD contacts. Therefore, to prevent these shifts, we identified a site in an RBD groove adjacent to the NTD, and prepared a triple mutant, D398L S514L E516L (RBD to NTD triple mutant; rNt, Extended Data Figure 2). As SD1 acts as a hinge point for the RBD ‘up’/’down’ transitions (Figures 1A–C, 2I-J), we hypothesized that enhanced hydrophobicity at the SD1 to S2 interface might shift the position of SD1, thus influencing the hinge and potentially the propensity for RBD triggering. A double mutant, N866I A570L (Subdomain 1 to S2 double mutant; u1S2d), and a quadruple mutant, A570L T572I F855Y N856I (Subdomain 1 to S2 quadruple mutant; u1S2q), were identified for this purpose (Extended Data Figure 2). Finally, we identified a double cysteine mutant, G669C and T866C, to link SD2 to S2 (Subdomain 1 to S2 double mutant; u2S2d, Extended Data Figure 2).
Figure 2. Cryo-EM structures reveal differential stabilization of the S-protein in the mutant ectodomain constructs.
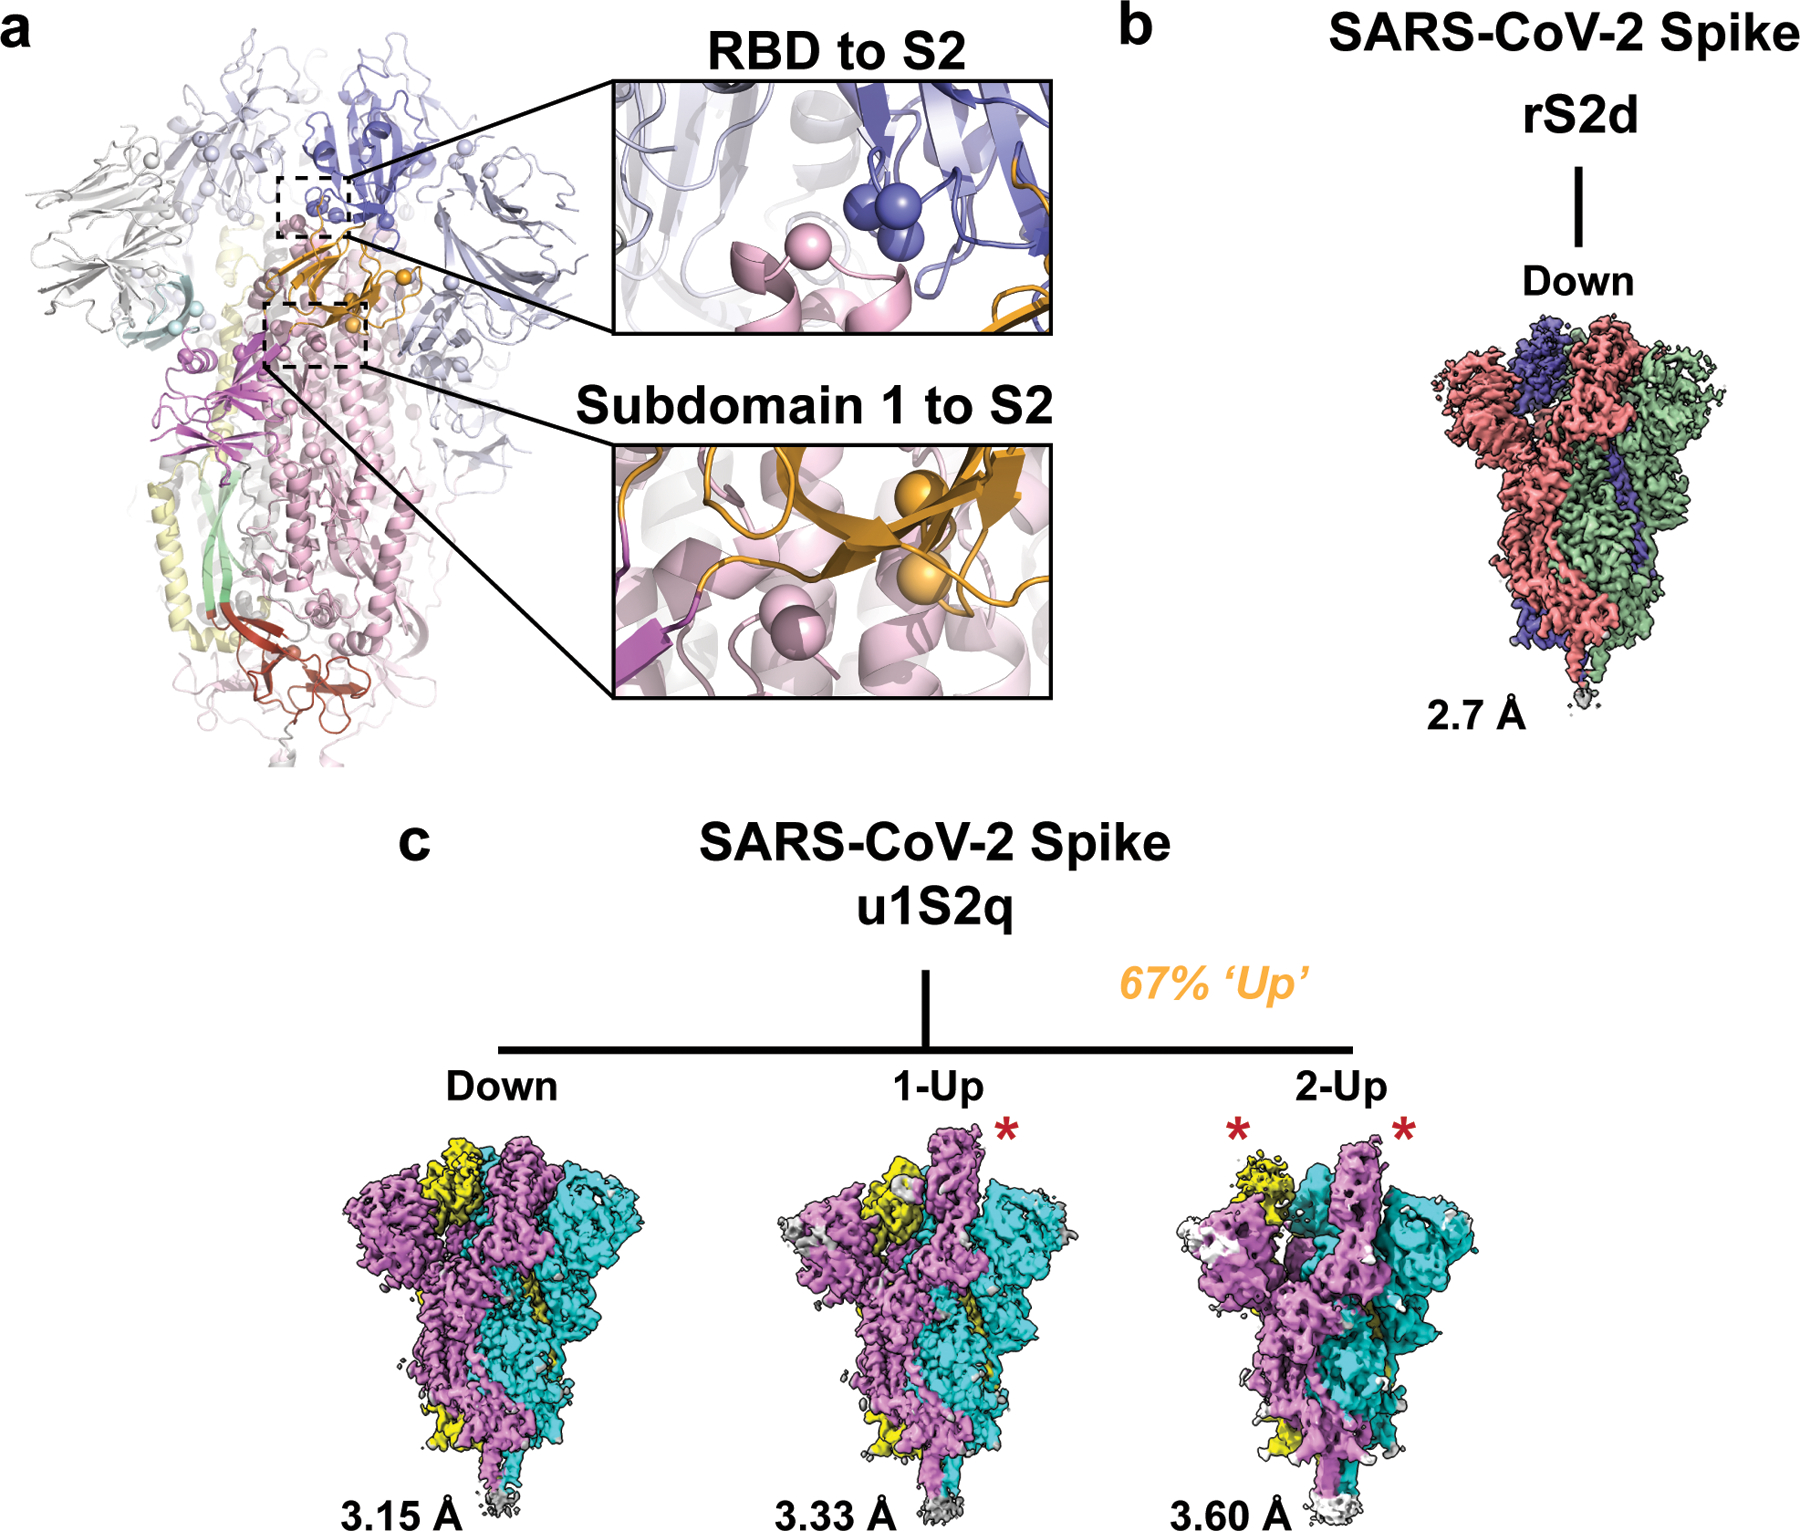
A) The S-protein spike highlighting the two regions of interest for structure and computation-based design (PDB 6VXX). B) The rS2d RBD to S2 locked structure displaying only the all RBD ‘down’ state map. C) The u1S2q SD1-to-S2 mutated structure displaying the all RBD ‘down’ state, the 1-RBD ‘up’ state, and the 2-RBD ‘up’ state. The percentage listed in orange is the sum of particles found in either 1- or 2-RBD ‘up’ states. Each protomer in each map is colored differently with resolutions for these listed to the lower left. Red stars indicate ‘up’ state RBDs.
Negative staining EM analysis of SARS-CoV-2 spike ectodomain proteins.
The mutants were prepared in the context of a previously published SARS-CoV-2 ectodomain construct3 (Extended Data Figure 3). To assess the quality of the purified proteins, we performed NSEM analysis (Extended Data Figure 4). The micrographs showed a reasonably uniform distribution of particles consistent with the size and shape of the SARS-CoV-2 spike ectodomain. 2D class averages showed spike populations with well resolved domain features.
Upon 3D-classification followed by homogeneous refinement, the unmutated spike resolved into two classes of roughly equal proportions that differed in the position of their RBD domains. One class displayed all three RBDs in their ‘down’ positions, whereas the other class displayed one RBD in the ‘up’ position. This was consistent with published cryo-EM results19 that described a 1:1 ratio between the ‘down’ and ‘1-up’ states of the SARS-CoV-2 spike ectodomain.
The mutant spikes, analyzed using a similar workflow, showed different conformation distributions compared to the unmutated spike. The most pronounced changes were observed in the rS2d and u1S2q constructs (Extended Data Figure 4C and E). For the rS2d construct, we observed only the ‘down’ conformation (Extended Data Figure 4C); the 1-RBD ‘up’ state was not found in this dataset. In the u1S2q data, we observed an S-protein population with 2 RBDs in the ‘up’ position which has been reported before for the SARS-CoV-1 and MERS CoV spike ectodomains7,12. These two constructs were selected for downstream, high-resolution characterization by cryo-EM.
Cryo-EM and properties of the SARS-CoV-2 spike constructs
We collected cryo-EM datasets for the rS2d and u1S2q constructs (Figures 2–6, Table 1, Extended Data Figures 5–9). Consistent with the NSEM analysis, following multiple rounds of 2D and 3D classification, we found a population of ‘down’ state spike in the rS2d dataset (Figure 3 and Extended Data Figure 6). We then implemented additional exhaustive ab initio classifications, as well as heterogeneous classifications using low-pass filtered maps of known open conformations of CoV spikes to search for open state spikes in the dataset. We were unable to find any such states, suggesting that the disulfide bond between the RBD and the S2 subunit effectively locked the SARS-CoV-2 spike in its ‘down’ conformation. The rS2d cryo-EM reconstruction had an overall resolution of 2.7 Å, but the local resolution varied widely (Extended Data Figure 6G), with the highest resolutions in the S2 subunit (Extended Data Figure 6H) and higher disorder and lower local resolutions in the S1 subunit; this is consistent with previous structures of the SARS-CoV-2 spike3,14. We observed connecting density at the site of the engineered disulfide link in rS2d, thus confirming disulfide formation (Figure 3C–E). Alignment of this structure with that of the unmutated ‘down’ closed state structure (PDB 6VXX)14 indicated that the overall protein structure was otherwise unperturbed (RMSD 0.5 Å).
Figure 6. Structure of the u1S2q 2 RBD ‘up’ state.
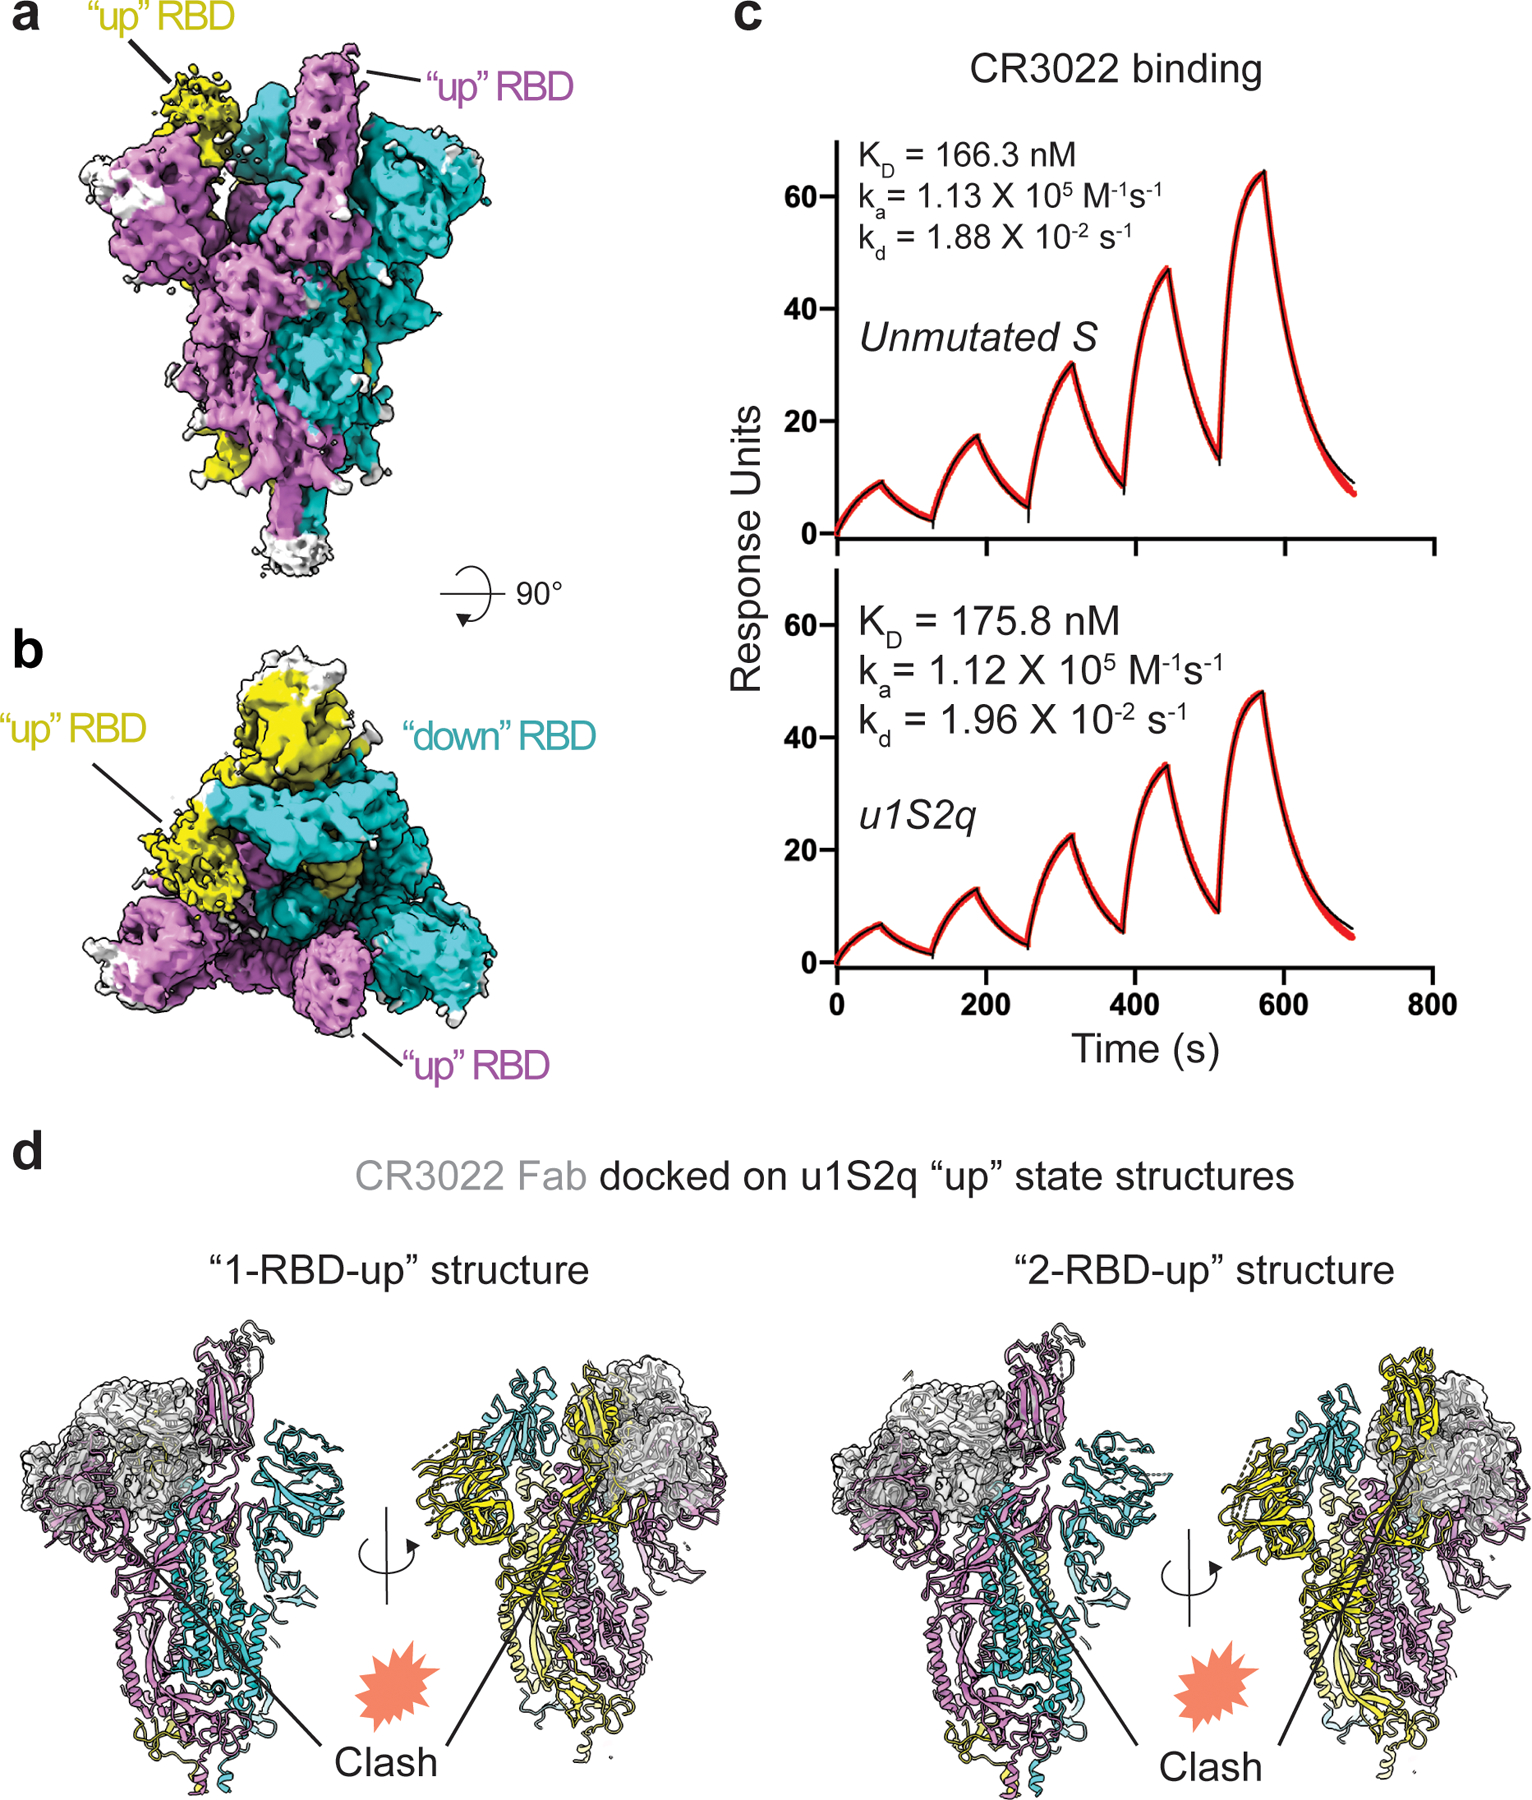
A) Cryo-EM reconstruction of u1S2q colored by chain. B) ~90 rotated view of (A). C) Binding of antibody CR3022 to (top) the unmutated construct and (bottom) u1s2q. Binding of CR3022 Fab to the S proteins was measured by SPR using single cycle kinetics. The black lines are the binding sensorgrams and the red lines show fit of the data to a 1:1 Langmuir binding model. (D) CR3022 (shown as a semi-transparent, gray surface) modeled on the “1-up” u1S2q structure (left) and the “2-up” u1S2q structure (right) using RBD in the crystal structure of the CR3022-RBD complex (PDB 6W41) to superimpose on the “up” RBD of the u1S2q structures. Locations of potential clashes are indicated in each model.
Table 1.
Cryo-EM data collection, refinement and validation statistics
| rS2d (EMD-21997, PDB 6X29) |
u1S2q all ‘down’ (EMD-22001, PDB 6X2C) |
u1S2q ‘1-up’ (EMD-21999, PDB 6X2A) |
u1S2q ‘2-up’ (EMD-22000, PDB 6X2B) |
|
|---|---|---|---|---|
| Data collection and processing | ||||
| Magnification | 81,000 | 81,000 | 81,000 | 81,000 |
| Voltage (kV) | 300 | 300 | 300 | 300 |
| Electron exposure (e−/Å2) | 65.18 | 66.82 | 66.82 | 66.82 |
| Defocus range (μm) | 0.63–2.368 | 0.55–2.94 | 0.55–2.94 | 0.55–2.94 |
| Pixel size (Å) | 1.06 | 1.058 | 1.058 | 1.058 |
| Symmetry imposed | C3 | C3 | C1 | C1 |
| Initial particle images (no.) | 631,937 | 906,517 | 906,517 | 906,517 |
| Final particle images (no.) | 367,259 | 192,430 | 255,013 | 133,957 |
| Map resolution (Å) | 2.7 | 3.2 | 3.3 | 3.6 |
| FSC threshold | 0.143 | 0.143 | 0.143 | 0.143 |
| Map resolution range (Å) | 2.4–4.4 | 2.7–6.4 | 2.8–7.1 | 3.2–9.3 |
| Refinement | ||||
| Initial model used | PDB 6VXX | PDB 6VXX | PDB 6VYB | PDB 6VYB |
| Model resolution (Å) | 2.8 | 3.2 | 3.3 | 3.6 |
| FSC threshold | 0.143 | 0.143 | 0.143 | 0.143 |
| Map sharpening B factor (Å2) | −113.3 | −124.3 | −113.7 | −107.7 |
| Model composition | ||||
| Non-hydrogen atoms | 22,806 | 22,800 | 21,562 | 21,144 |
| Protein residues | 2,916 | 2,913 | 2,875 | 2,864 |
| R.m.s. deviations | ||||
| Bond lengths (Å) | 0.009 | 0.012 | 0.012 | 0.011 |
| Bond angles (°) | 1.2 | 1.906 | 1.839 | 1.814 |
| Validation | ||||
| MolProbity score | 1.23 | 1.34 | 1.15 | 1.31 |
| Clashscore | 0.33 | 0.20 | 0.14 | 0.32 |
| Poor rotamers (%) | 1.96 | 3.17 | 1.64 | 2.08 |
| Ramachandran plot | ||||
| Favored (%) | 94.37 | 94.37 | 93.31 | 92.88 |
| Allowed (%) | 5.52 | 5.32 | 6.29 | 6.69 |
| Disallowed (%) | 0.11 | 0.32 | 0.39 | 0.43 |
Figure 3. Cryo-EM structure of the rS2d construct locked in the ‘down’ state.
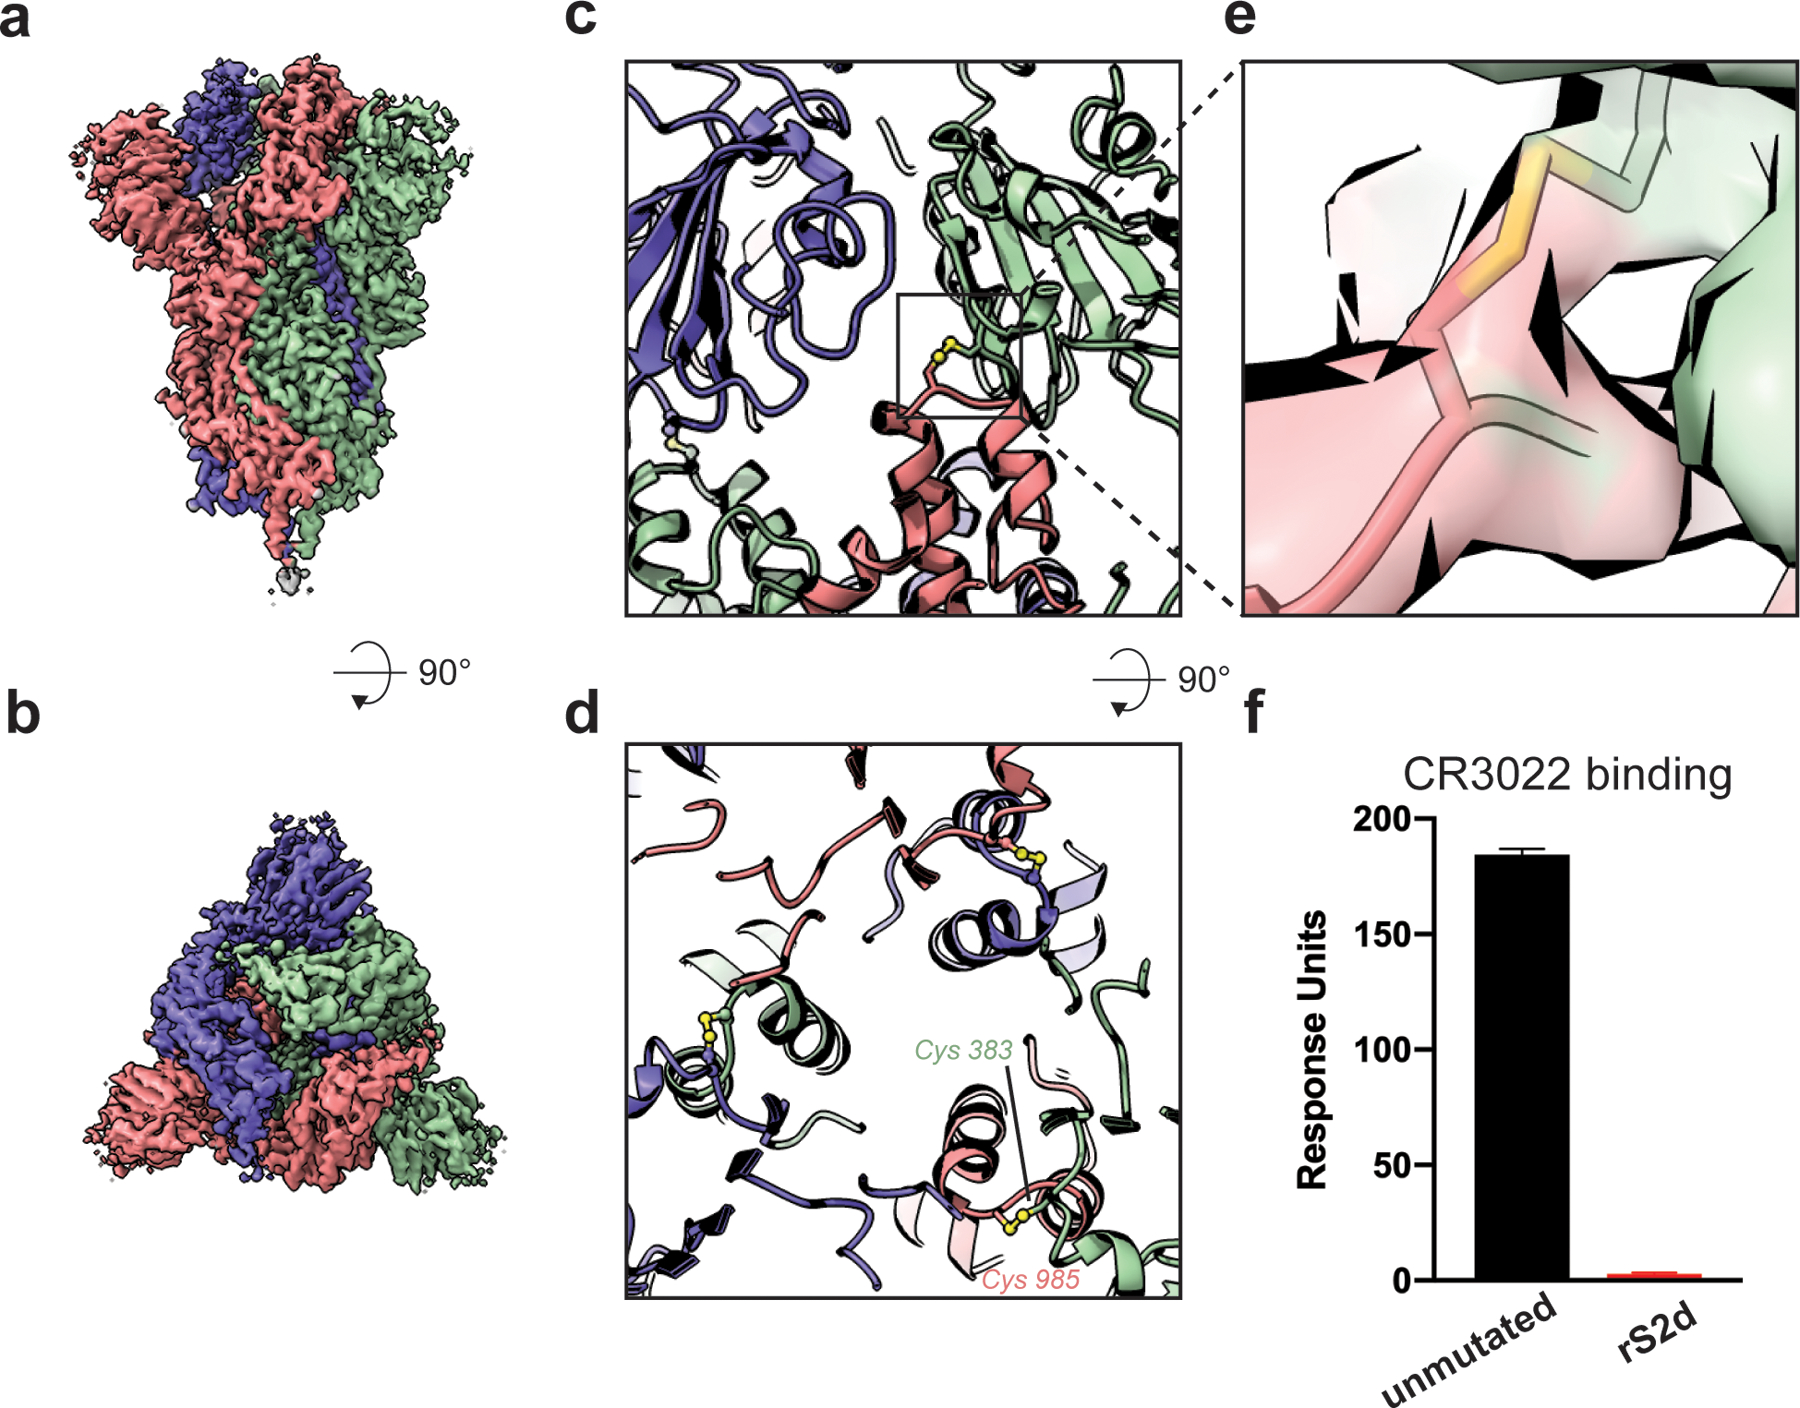
A) Cryo-EM reconstruction of rS2d colored by chain. B) ~90 rotated view of (A). C) Zoom-in view showing engineered disulfide linking the RBD of one protomer and S2 domain of the adjacent protomer. The disulfide bridge is shown as spheres and colored by elements. D) ~90 rotated view of (C). E) Zoom-in view of engineered inter-chain disulfide showing the cryo-EM density as a transparent surface and the underlying model in stick representation. F) Binding of antibody CR3022 to the unmutated (black bar) and rS2d (red bar). The spike was captured on a streptavidin chip and binding to CR3022 IgG was measured by SPR. Data shown are means and s.d. of three technical repeats, and are representative of 5 independent experiments.
We next tested binding of rS2d to antibody CR3022 (Figure 3F and Extended Data Figure 7A)20,21. CR3022 binds an epitope on the RBD of the SARS-CoV-1 and SARS-CoV-2 spikes that is occluded in the ‘down’ RBD conformation. While we observed robust binding for the unmutated spike to CR3022, no measurable binding was observed for rS2d, confirming that the RBD in the rS2d construct is locked in a ‘down’ conformation. Also as expected, the rS2d mutant showed reduced binding to ACE-2 compared to the unmutated spike (Extended Data Figure 7B and C), and such activity could be abrogated using an ACE-2- or a CR3022 IgG-immobilized column for purification (Extended Data Figure 7C–H).
In contrast to rS2d, the u1S2q spike displayed widespread rearrangement of the S1 subunits (Figures Extended Data Figures 8 and 9). In the ‘down’ state structure, the mutated S2 position remained in the configuration observed in the unmutated construct, with the F855Y and N856I residue loop in close proximity the S2 residue L966 and S1 residue P589 (Figure 4C and D), suggesting these mutations had little impact on the observed shifts. However, the S2-interactive SD1 displayed a rigid body movement relative to both the rS2d and unmutated constructs with θ1 and ϕ3 displacements of 3.7° and 2.4°, respectively (Figure 4E–J, Extended Data Figure 10). This resulted in displacement of the A570L+T572I containing loop from the unmutated position near the S2 L966 residue (Figure 4I–J). The S2 contact disruption is accompanied by an angular shift of the NTD away from the primary trimer axis owing to SD1 to NTD’ contacts, yielding θ3 and ϕ2 shifts of 6.0° each, respectively (Extended Data Figure 10). The subdomain rearrangement impacts the positioning of the RBD with only a minor shift in the ϕ1 dihedral of 0.1° indicating the RBD moved with SD1 indicated in the θ1/ϕ3 shifts. The newly acquired arrangement in both the RBD and NTD was further accompanied by an apparent increase in their flexibility suggesting conformational heterogeneity. These ‘down’ state shifts were observed in both the single RBD ‘up’ structure and the two RBD ‘up’ structures (Figures 5 and 6, Extended Data Figure 10). The extent to which the SD1 shift differed from that observed in the unmutated construct was context dependent in the 1 RBD ‘up’ state (Figure 5C–H). While the ‘down’ state RBD in contact with the ‘up’ state RBD displayed the large shift in position observed in the all ‘down’ state (Figure 5D and G), the ‘down’ state RBD with its terminal position free displayed an intermediate SD1 configuration (Figure 5E and H). The ‘up’ state RBD in the u1S2q construct resided largely in the position occupied in the unmutated construct (Figure 5C and F). This indicated the effect of the mutations was primarily isolated to the ‘down’ state and suggested these mutations act to destabilize the ‘down’ state rather than to stabilize the ‘up’ state. These features were largely recapitulated in the u1S2q 2 RBD ‘up’ state conformation with subdomain 1 retaining the shift in the down state RBD (Supplementary Table 1). The structural details presented here indicate that, while locking the ‘down’ state RBD into its unmutated position had little impact on the overall configuration of S1, altering the disposition of SD1 had wide ranging impacts, consistent with the observed virus-to-virus differences in the geometric analysis described in Figure 1.
Figure 4. Cryo-EM structures of RBD ‘down’ S proteins reveal differential stabilization of domain positions.
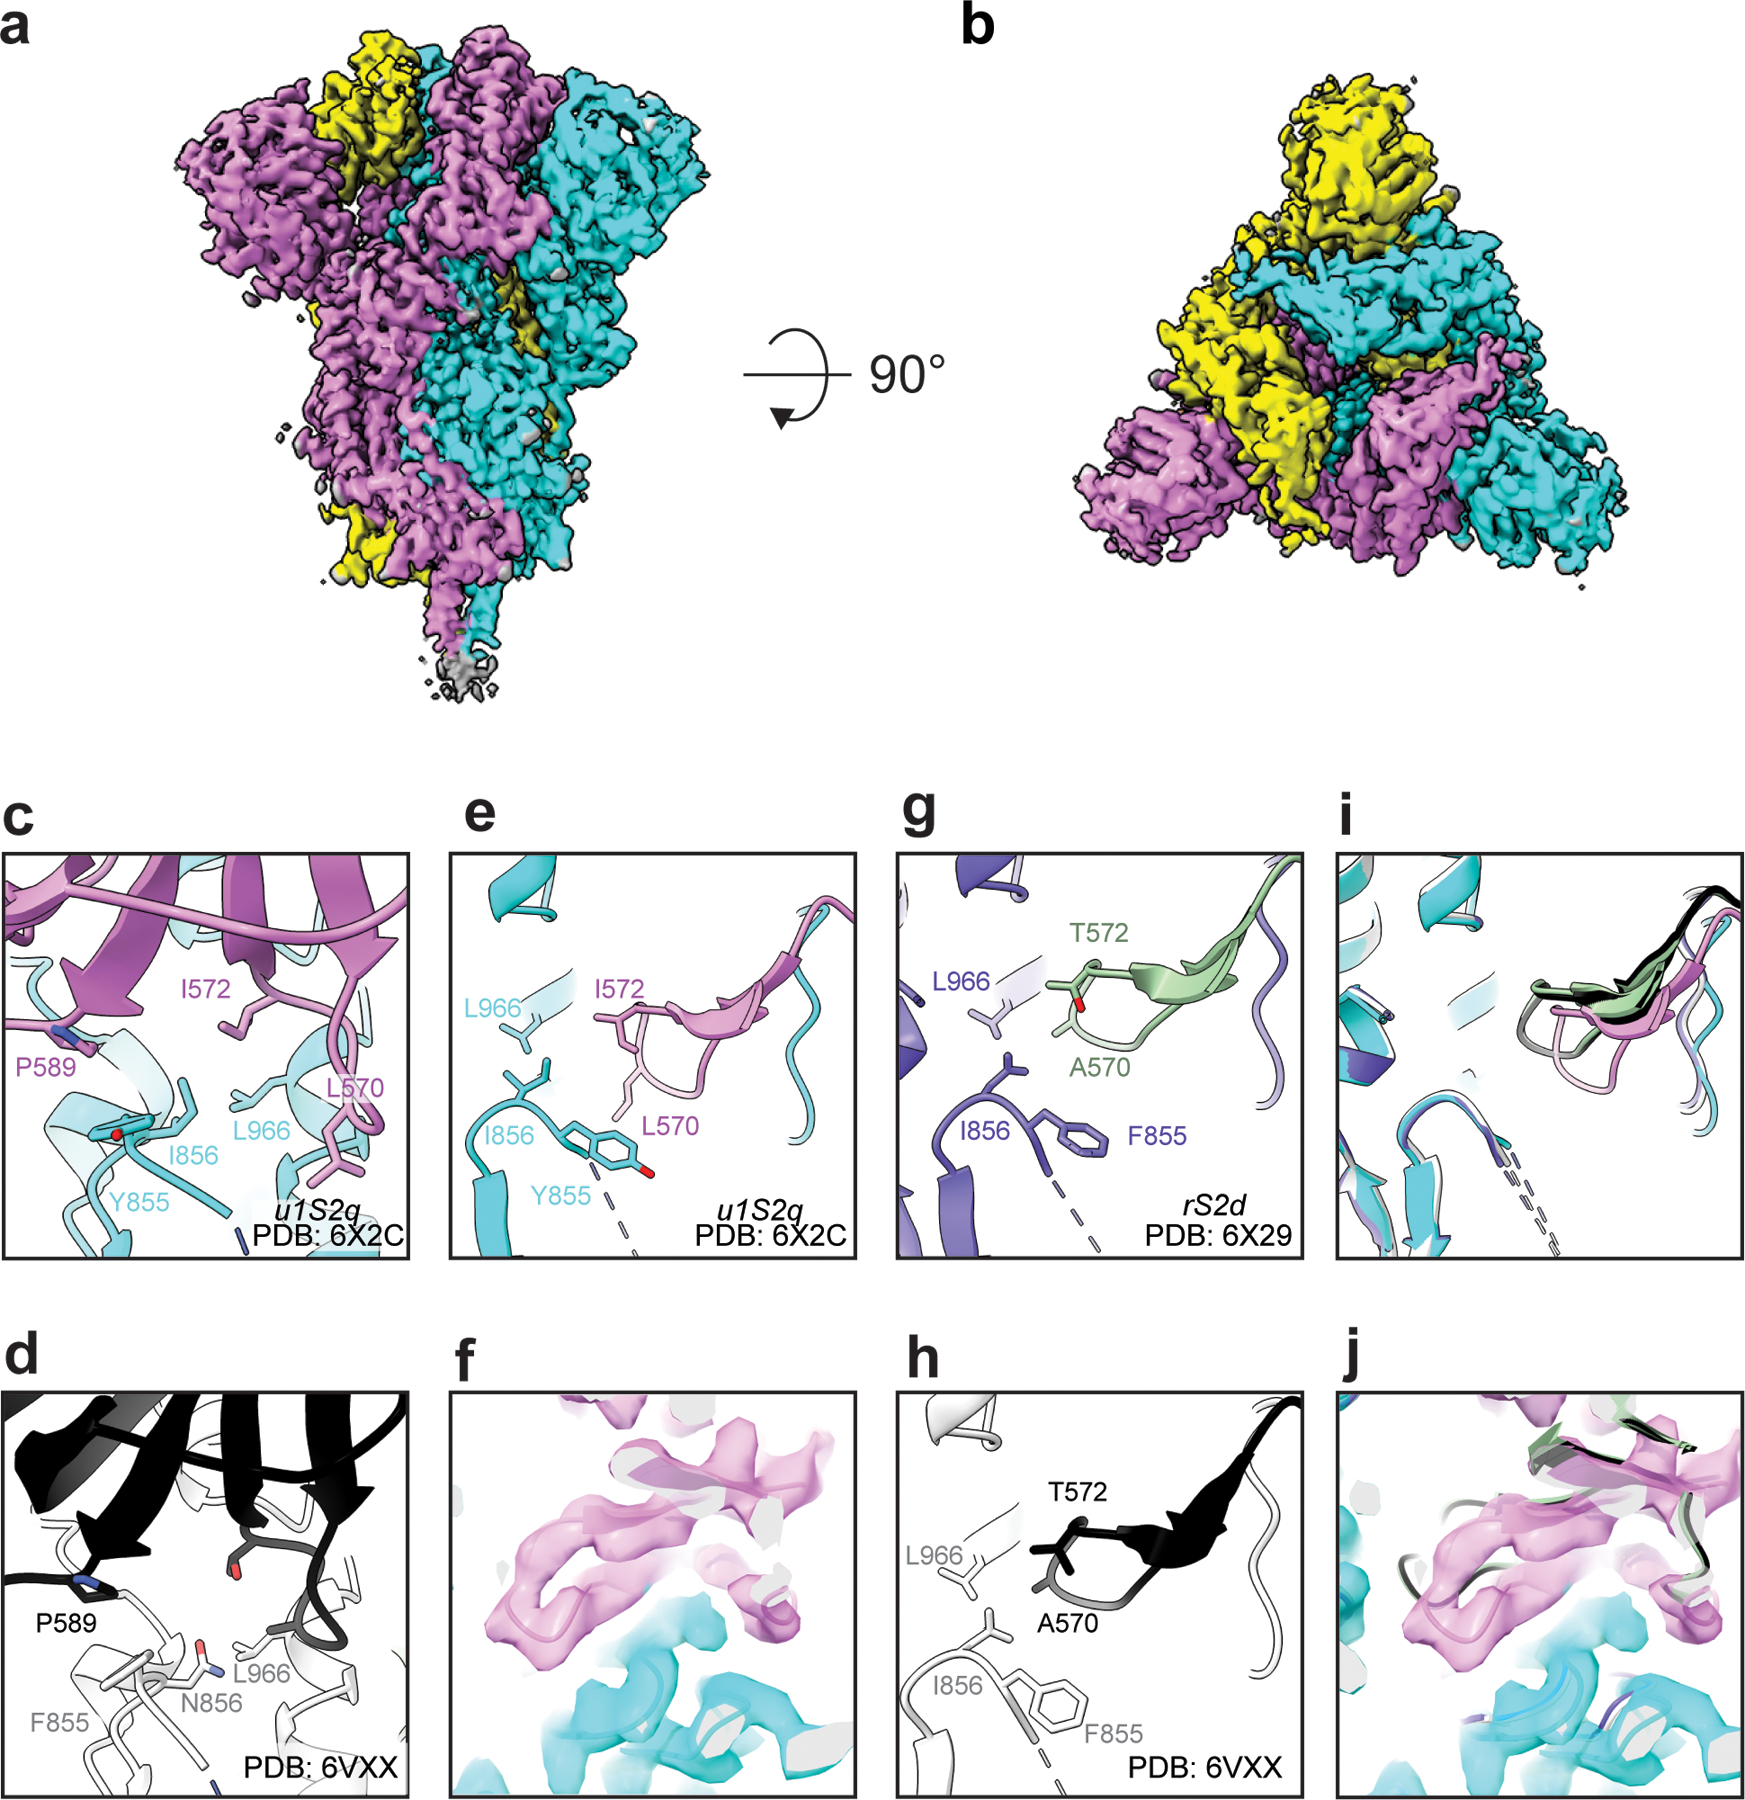
Cryo-EM reconstruction of u1S2q colored by chain. B) ~90 rotated view of (A). C) Zoomed-in view of the region containing the mutations, showing proximity of the F855Y and N856I residue loop to the S2 residue L966 and S1 residue P589. D) Similar region shown in (C) but for the unmutated structure (PDB 6VXX). (E) Zoom-in view of the region containing the mutations at a different angle than the one shown in (C), and (F) the loop containing the A570L and T572I mutations with cryo-EM map shown as a transparent surface and fitted model shown in cartoon representation.(G and H) Similar region shown in (E) but for (G) the rS2d structure (PDB ID: 6X29) and (H) the unmutated structure (PDB 6VXX). (I) Overlay of the three ‘down’ state structures and (J) with the cryo-EM reconstruction for the ‘down’ state for the u1S2q construct.
Figure 5. Cryo-EM structure of the u1S2q 1 RBD ‘up’ state reveals increasing relaxation of the triggered RBD toward the unmutated structure.
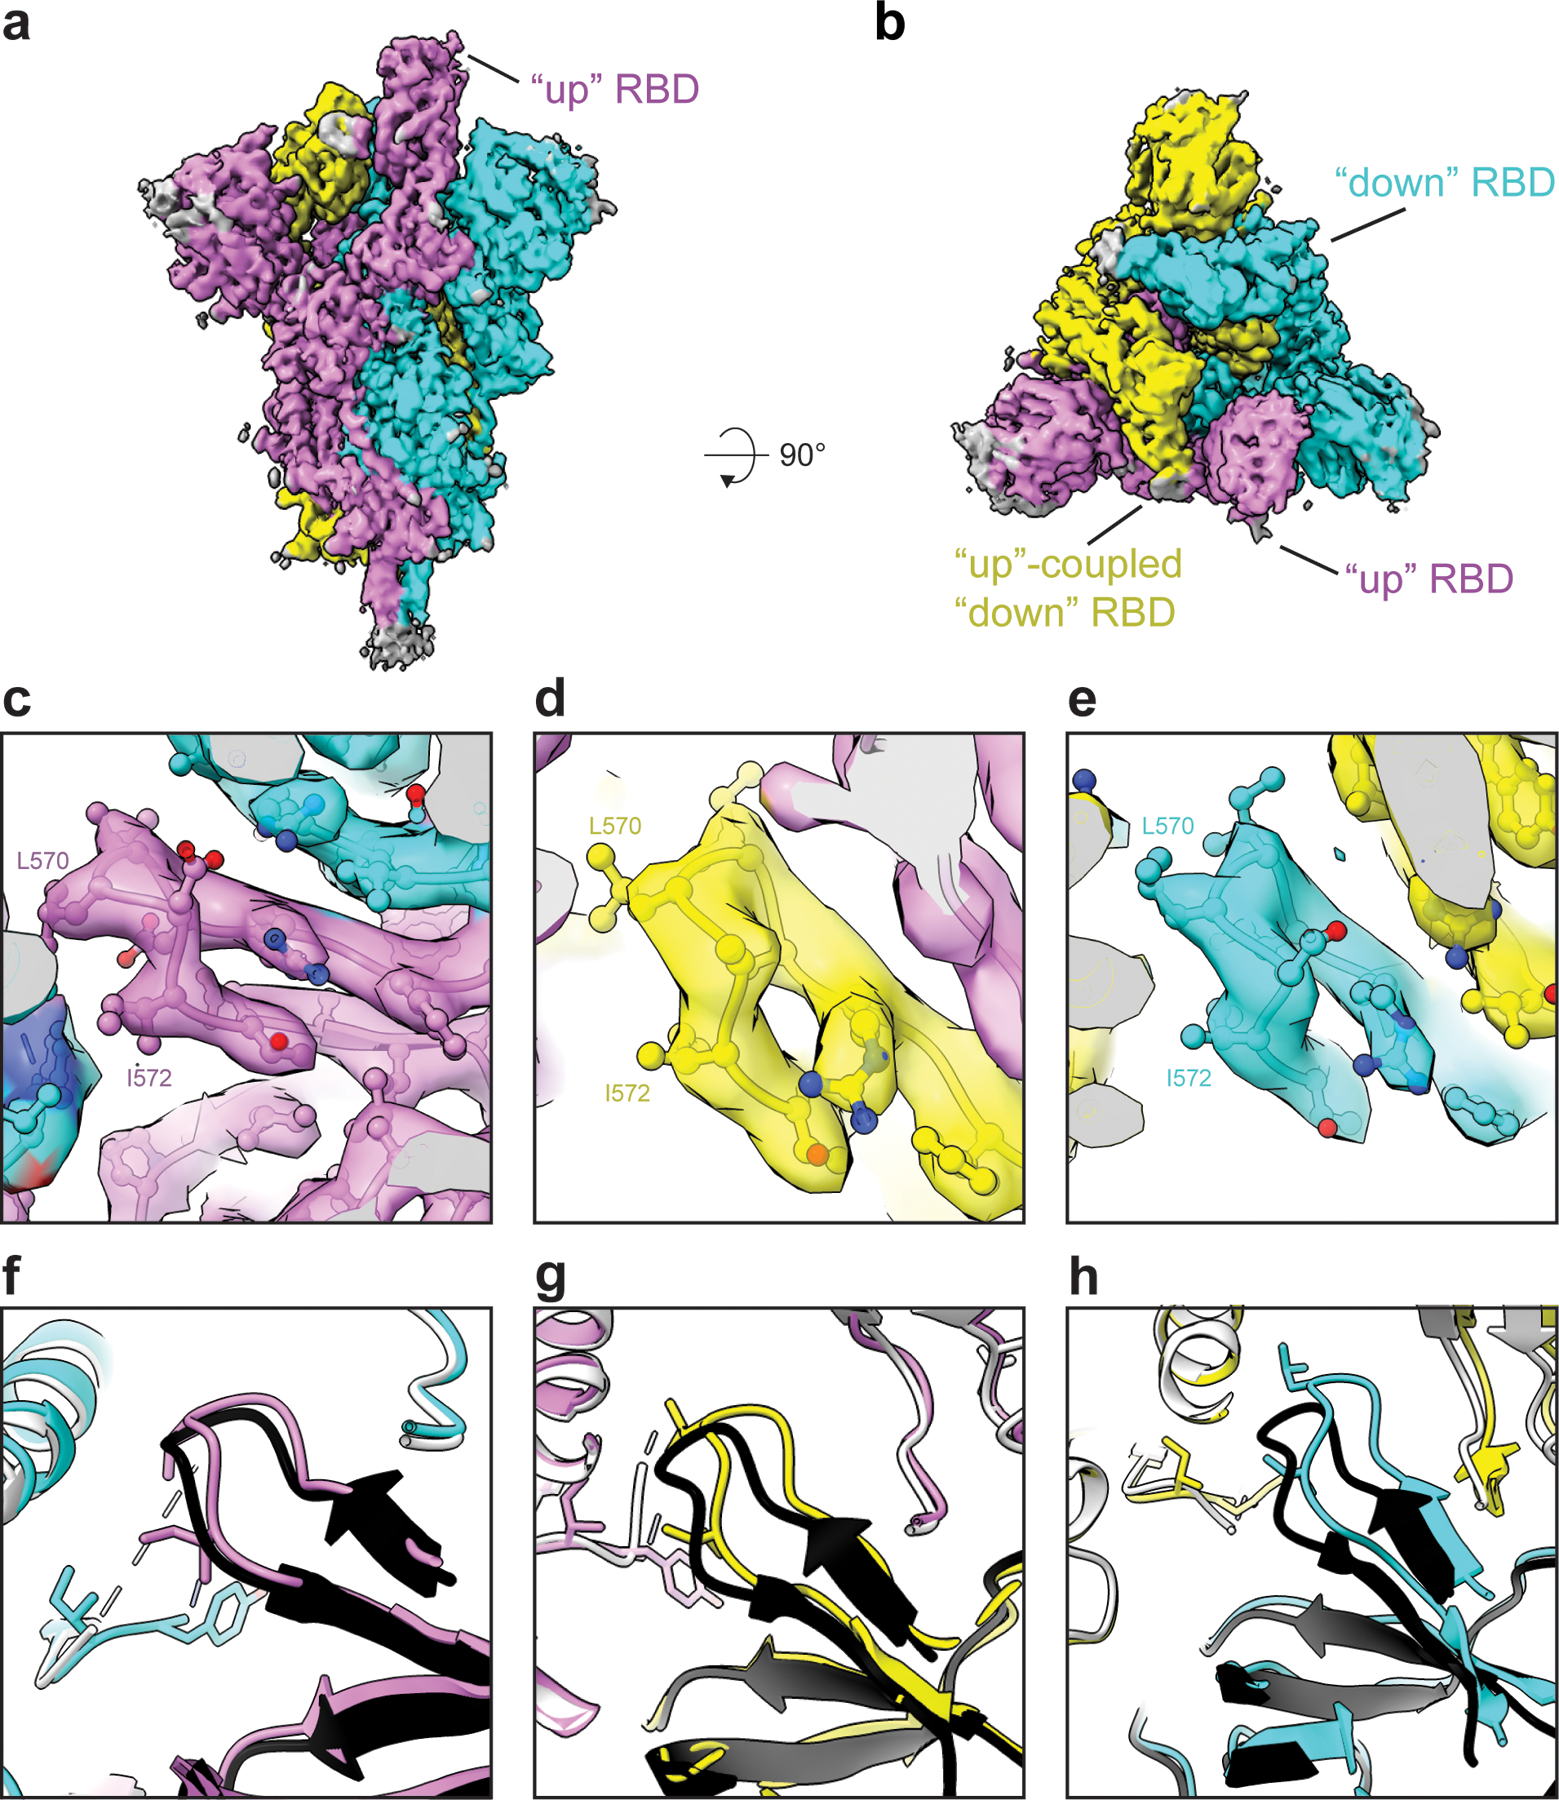
Cryo-EM reconstruction of u1S2q 1 RBD “up” state colored by chain. B) ~90 rotated view of (A). C-E) Zoomed-in views of the region containing the A570L and T572I mutations in each of the protomers of the asymmetric 1-RBD “up” spike. The cryo-EM reconstruction is shown as a transparent surface with the underlying fitted model in cartoon representation and residues as balls and sticks. (F-H) The 1-RBD “up” structure of the unmutated spike (PDB 6VYB) (shown in black and grey) superimposed on the u1S2q 1-RBD “up” structure (PDB 6X2B, this study), colored according to the coloring scheme in (A).
We measured the binding of u1S2q with antibody CR3022 and ACE-2 (Figure 6C and Extended Data Figure 7A–C). We observed a modest but reproducible increase in ACE-2 binding for u1S2q compared to the unmutated spike, consistent with the higher propensity of u1S2q to adopt RBD-up conformations (Extended Data Figure 7B and C). The affinities of the CR3022 antibody to the unmutated spike or u1S2q were similar, and also consistent with previously published affinity of CR3022 for an RBD-only construct20 (Figure 6c). Upon docking of the crystal structure of the CR3022 Fab in complex with the RBD (PDB 6YLA)20 onto the “1-up” and “2-up” structures of u1S2q, we found that the CR3022 constant domain clashed with the NTD and the adjacent RBD in both the “1-up” conformation and the “2-up” conformations (Figure 6d,e). As previously suggested20, CR3022 binding is therefore likely to require a conformational change that rotates the RBD away from the central axis of the spike. In summary, none of the structures of the structural states of the spike determined thus far are compatible with CR3022 binding and our data show that CR3022 must induce or capture this potentially transient state in both the unmutated and the u1S2q spikes.
Discussion
Conformational plasticity is a hallmark of enveloped-virus fusion-protein structure, owing to the necessity of protecting the conserved viral fusion elements from host immune responses while retaining a sufficiently steep free-energy gradient to enable host cell fusion22. Exposed elements are generally well conditioned to be permissive and responsive to mutations through genetic drift and host immune adaptation. Conformational plasticity, however, presents an important difficulty in the context of vaccine and drug design. Indeed, lessons learned in the continued effort to produce a broadly protective HIV-1 vaccine have demonstrated the importance of a detailed understanding and control of fusion protein dynamics23–34. SARS-CoV-2 is likely no exception in this regard and, indeed, the conformational plasticity of the SARS-CoV-2 S-protein appears greater than that of the HIV-1 Env.
We aimed to develop a quantitative understanding of β-CoV structural states between viruses and within each RBD ‘down’ and ‘up’ state configuration. The wide breadth of domain arrangements and the relatively small contact area between the S1 and S2 subunits suggest that large changes in S-protein structure may occur from few mutations. A recent report indicated that the D614G mutation (located in the SD2 region and contacting S2) causes a potential fitness gain35. Based on our results showing that a disulfide linkage between SD2 and S2 in u2S2d decreased the population of ‘up’ state RBDs (Extended Data Figure 4B), the D614G mutation may indeed alter the conformational landscape of the SARS-CoV-2 S-protein. It was previously noted that the RBD up states observed in MERS and SARS-CoV-1 were not observed in the OC43, MHV, or HKU1 S-protein structures10. We note that the SD1 u1S2q mutation sites are all asparagine in those other CoV S-proteins and each displays a marked difference in SD1 positioning relative to the u1S2q structure. Thus, sequence differences at interdomain contact sites are not uncommon, and our observations suggest that the β-coronaviruses can quickly evade conformationally selective antibody responses. However, the degree to which this evasion mechanism is effectively utilized by the virus is uncertain, as such mutations may simultaneously incur a fitness penalty.
From the perspective of immunogen development, the constructs developed here present an opportunity to examine the ability of differentially stabilized S-protein particles to induce two different, yet important antibody responses. First, the u1S2q construct developed here displayed a prominent two RBD ‘up’ state distribution, demonstrating that interdomain contact modifications can lead to higher exposure of the immunogenic receptor binding regions. Since RBD-directed responses that target the ACE-2 binding site form a dominant proportion of neutralizing immune responses in infected patients36, constructs that increase exposure and access to these sites could be useful candidates for vaccination regimens aimed at eliciting such responses. Indeed, full-length SARS-CoV-2 spike structures, either detergent solubilized37 or virion associated38, suggest the ‘down’ state is the predominant state which, in a vaccination context, may limit RBD-directed responses. The u1S2q mutations may therefore provide a means to enhance the induction of RBD responses in full-length S-protein immunogens. Furthermore, this design could also be used to identify receptor binding site-directed antibodies from patient sera, including potential new antibodies that may target sites that require a two RBD ‘up’ conformation. Second, the disulfide-linked ‘down’ state locked double mutant (rS2d) would presumably not elicit antibodies targeting the receptor binding site, which make up the majority of observed responses in convalescent patients39,40, but it would still be capable of eliciting antibodies such as S309 that are able to bind the ‘down’ state RBD41. Indeed, a study of MERS responses suggests non-RBD responses (particularly NTD and S2 epitopes) will play an important role in vaccine induced protection42. From a theoretical perspective, the wide control over the RBD ‘up’/’down’ distribution available to the virus suggests that, by analogy to HIV-1 viruses, which are notoriously difficult to neutralize, conformational blocking of antibody responses would not be unusual. While there might be a fitness cost to the virus, it would not necessarily render the virion non-infectious. Using the double mutant rS2d as an immunogen provides a platform for inducing non-RBD responses that may be needed to protect against such an evasion. While the low expression yields of rS2d are a potential hindrance to its utility, introduction of other mutations, such as the recently described mutations designed to stabilize the S2 region43 may provide a way to further stabilize rS2d and increase its utility as an immunogen.
Complicating factors, such as a potential for antibody-induced enhancement, may favor the use of truncated, single-domain constructs with fewer potentially weak or non-neutralizing epitopes. Nevertheless, the designs presented here will allow for a detailed characterization of vaccine immunogenicity and antigenicity, paving the way for the development of vaccines for the novel SARS-CoV-2 and eventually a broadly protective β-CoV vaccine. Thus, while the previous generation of stabilizing mutations ensured well folded spike trimers, the rational design approach developed here provides a means to controlling the RBD orientation distribution, and should allow us to explore the impact of conformational dynamics from the perspective of vaccine and drug development.
Methods
Vector based analysis
Vector analysis was performed using available cryo-EM structures for SARS-CoV-214,15, SARS4,5,7,8, MERS4,12, and other human1,10 and murine11 β-CoV spike proteins. Domains for the vector analysis were selected based upon visual inspection of alignments between SARS, MERS, and SARS-CoV-2 structures. Specifically, Cα centroids for the S1 NTD, RBD, SD1, SD2 (SARS-CoV-2 residues, 27–43 and 54–271, 330–443 and 503–528, 323–329 and 529–590, 294–322 and 591–696, respectively; equivalent SARS/MERS/Murine/HKU1/OC43 residues selected based upon structural alignment with SARS-CoV-2) as well as a β-sheet motif in the NTD (residues 116 −129 and 169–172) and a helix motif in the RBD (residues 403–410) were determined. The NTD was split into two regions with the SD1 contacting, SD2 adjacent portion referred to here as the NTD’ (residues 44–53 and 272–293). Cα centroids in the S2 subunit were obtained for a β-sheet motif (residues 717–727 and 1047–1071) and the CD domain (711–716 and 1072–1122). Vector magnitudes, angles, and dihedrals between these centroids were determined and used in the subsequent analysis. Vector analysis was performed using the VMD44 Tcl interface. Principal component analysis performed in R with the vector data centered and scaled45.
Rational structure-based design
Structures for SARS-COV-1 (PDB 5X584), MERS (PDB 6Q0413), and SARS-CoV-2 (PDB 6VXX19) were prepared in Maestro46 using the protein preparation wizard16 followed by in silico mutagenesis using Schrödinger’s cysteine mutation17 and residue scanning18 tools. Residue scanning was first performed for individual selected sites allowing mutations to Leu, Ile, Trp, Tyr, and Val followed by scanning of combinations for those which yielded a negative overall score. Scores and visual inspection were used in the selection of the prepared constructs.
Protein expression and purification
The SARS-CoV-2 ectodomain constructs were produced and purified as described previously3. Briefly, a gene encoding residues 1–1208 of the SARS-CoV-2 S (GenBank: MN908947) with proline substitutions at residues 986 and 987, a “GSAS” substitution at the furin cleavage site (residues 682–685), a C-terminal T4 fibritin trimerization motif, an HRV3C protease cleavage site, a TwinStrepTag and an 8XHisTag was synthesized and cloned into the mammalian expression vector pαH. All mutants were introduced in this background. Expression plasmids encoding the ectodomain sequence were used to transiently transfect FreeStyle293F cells using Turbo293 (SpeedBiosystems). Protein was purified on the sixth day post-transfection from the filtered supernatant using StrepTactin resin (IBA).
Antibody CR3022 was produced in Expi293 cells and purified by Protein A affinity. For expressing the ACE-2 constructs, the ACE-2 gene was cloned as a fusion protein with either the human or mouse Fc region attached to the C-terminal end of ACE-2. A 6X His-tag was added to the C-terminal end of the Fc domain of each construct. ACE-2 with human Fc tag was purified by Protein A affinity chromatography, and ACE-2 with mouse FC tag was purified by Ni-NTA chromatography.
Thermal shift assay
The thermal shift assay was performed using Tycho NT. 6 (NanoTemper Technologies). Spike variants were diluted (0.15 mg/ml) in nCoV buffer (2mM Tris, pH 8.0, 200 mM NaCl, 0.02% sodium azide) and run in duplicates in capillary tubes. Intrinsic fluorescence was recorded at 330 nm and 350 nm while heating the sample from 35–95 °C at a rate of 3 °C/min. The ratio of fluorescence (350/330 nm) and the Ti were calculated by Tycho NT. 6.
Negative-stain electron microscopy
A 100 μg/ml final concentration of the spike was made in 1:1 ratio of 0.15% glutaraldehyde in HBS pH 7.4 (20mM HEPES, 150mM NaCl) to 10% Glycerol in HBS pH 7.4. After 5 min incubation Tris pH 7.4 was added from a 1M stock to a final concentration of 0.075M to quench the glutaraldehyde and incubated for 5min. The carbon coated grids (CF300-cu, EMS) were glow discharged for 20sec at 15mA. A 5 μl of sample incubated on grid for 10–15 sec, blotted and then stained with 2% uranyl formate. Images were obtained with a Philips EM420 electron microscope operated at 120 kV, at 82,000× magnification and a 4.02 Å pixel size. The RELION47 program was used to perform class averaging of the single-particle images
Cryo-EM sample preparation, data collection and processing
Purified SARS-CoV-2 spike preparations were diluted to a concentration of ~1 mg/mL in 2 mM Tris pH 8.0, 200 mM NaCl and 0.02% NaN3. 2.5 μL of protein was deposited on a CF-1.2/1.3 grid that had been glow discharged for 30 seconds in a PELCO easiGlow™ Glow Discharge Cleaning System. After a 30 s incubation in >95% humidity, excess protein was blotted away for 2.5 seconds before being plunge frozen into liquid ethane using a Leica EM GP2 plunge freezer (Leica Microsystems). Frozen grids were imaged in a Titan Krios (Thermo Fisher) equipped with a K3 detector (Gatan). Data were acquired using the Leginon system48. The dose was fractionated over 50 raw frames and collected at 50ms framerate. This dataset was energy-filtered with a slit width of 30 eV. Individual frames were aligned and dose-weighted49. CTF estimation, particle picking, 2D classifications, ab initio model generation, heterogeneous refinements, homogeneous 3D refinements and local resolution calculations were carried out in cryoSPARC50.
Cryo-EM structure fitting and analysis
Structures of the all ‘down’ state (PDB 6VXX) and single RBD ‘up’ state (PDB 6VYB) from the previously published SARS-CoV-2 ectodomain were used to fit the cryo-EM maps in Chimera51. The 2 RBD ‘up’ state was generated in PyMol using the single RBD ‘up’ state structure. Mutations were made in PyMol52. Coordinates were then fit manually in Coot53 followed by iterative refinement using Phenix54 real space refinement and subsequent manual coordinate fitting in Coot. Structure and map analysis were performed using PyMol, Chimera51 and ChimeraX55.
Surface Plasmon Resonance
The binding of antibody CR3022 and ACE-2 to the SARS-CoV-2 spike constructs was assessed by surface plasmon resonance on Biacore T-200 (GE-Healthcare) at 25°C with HBS-EP+ (10 mM HEPES, pH 7.4, 150 mM NaCl, 3 mM EDTA, and 0.05% surfactant P-20) as the running buffer. The spike constructs were captured on SA chip and were assayed by flowing over CR3022 IgG or ACE-2-Fc. The surface was regenerated between injections by flowing over SA regeneration buffer (1M NaCl, 50mM NaOH) solution for 10s with flow rate of 100μl/min. Blank sensorgrams were obtained by injection of the same volume of HBS-EP+ buffer in place of IgGs and Fab solutions. Sensorgrams were corrected with corresponding blank curves. For testing in the reverse format, CR3022 IgG or ACE2-humanFc was immobilized on captured on CM5 chip immobilized with human Anti-Fc (8000RU) were assayed by nCoV spike at 200nM in running buffer. The surface was regenerated between injections by flowing over 3M MgCl2 solution for 10s with flow rate of 100μl/min. For assessing the affinity of CR3022 to the unmutated and u1S2q spikes, the spikes were captured on an SA chip as described above, and 5 concentrations of CR3022 were injected in a single cycle kinetics format. Sensorgram data were analyzed using the BiaEvaluation software (GE Healthcare).
Further information on experimental design is available in the Nature Research Reporting Summary linked to this article.
Extended Data
Extended Data Fig. 1. β-CoV Vector Analysis.
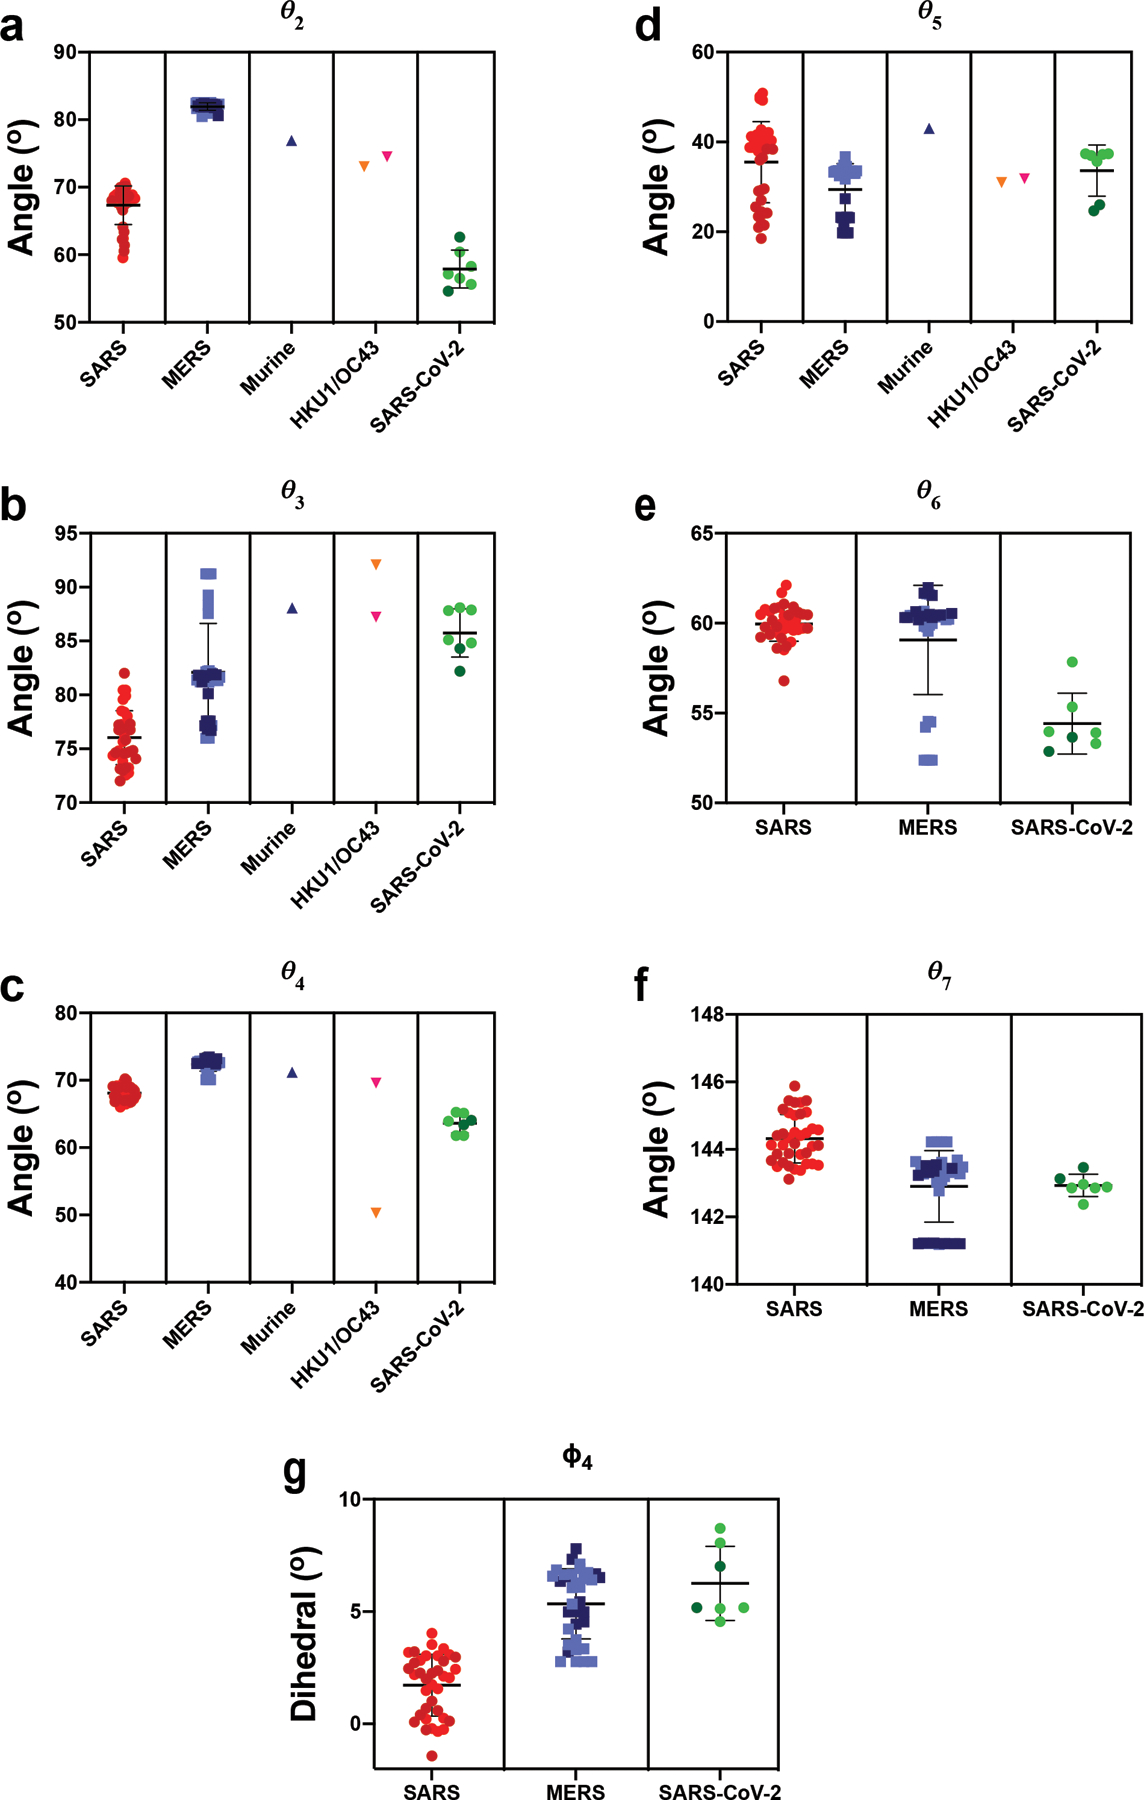
A) The angle between the vectors connecting the NTD sheet motif centroid and the NTD centroid and the vector connecting the the NTD centroid to the NTD’ centroid. B) The angle between the vectors connecting the NTD’ centroid and the SD2 centroid and the vector connecting the the SD2 centroid to the SD1 centroid. C) The angle between the vectors connecting the NTD centroid and the NTD’ centroid and the vector connecting the the NTD’ centroid to the SD2 centroid. D) The angle between the vectors connecting the SD1 centroid and the RBD centroid and the vector connecting the the RBD centroid to the RBD helix motif centroid. E) The angle between the vectors connecting the NTD’ centroid and the SD2 centroid and the vector connecting the the SD2 centroid to the CD centroid. F) The angle between the vectors connecting the SD2 centroid and the CD centroid and the vector connecting the the CD centroid to the β-sheet motif centroid. G) The dihedral about the SD2 centroid and the CD centroid. Points for SARS, MERS, and SARS-2 in Figure 1 (G)-(J) colored according to ‘up’ (dark) and ‘down’ (light) states according to the color code in the PCA analysis, panels (E) and (F). Individual data points shown as symbols; lines denote mean and s.d. The source data are available in Supplementary Data 1.
Extended Data Fig. 2. Sites identified for differential stabilization of the SARS-CoV-2 S-protein.
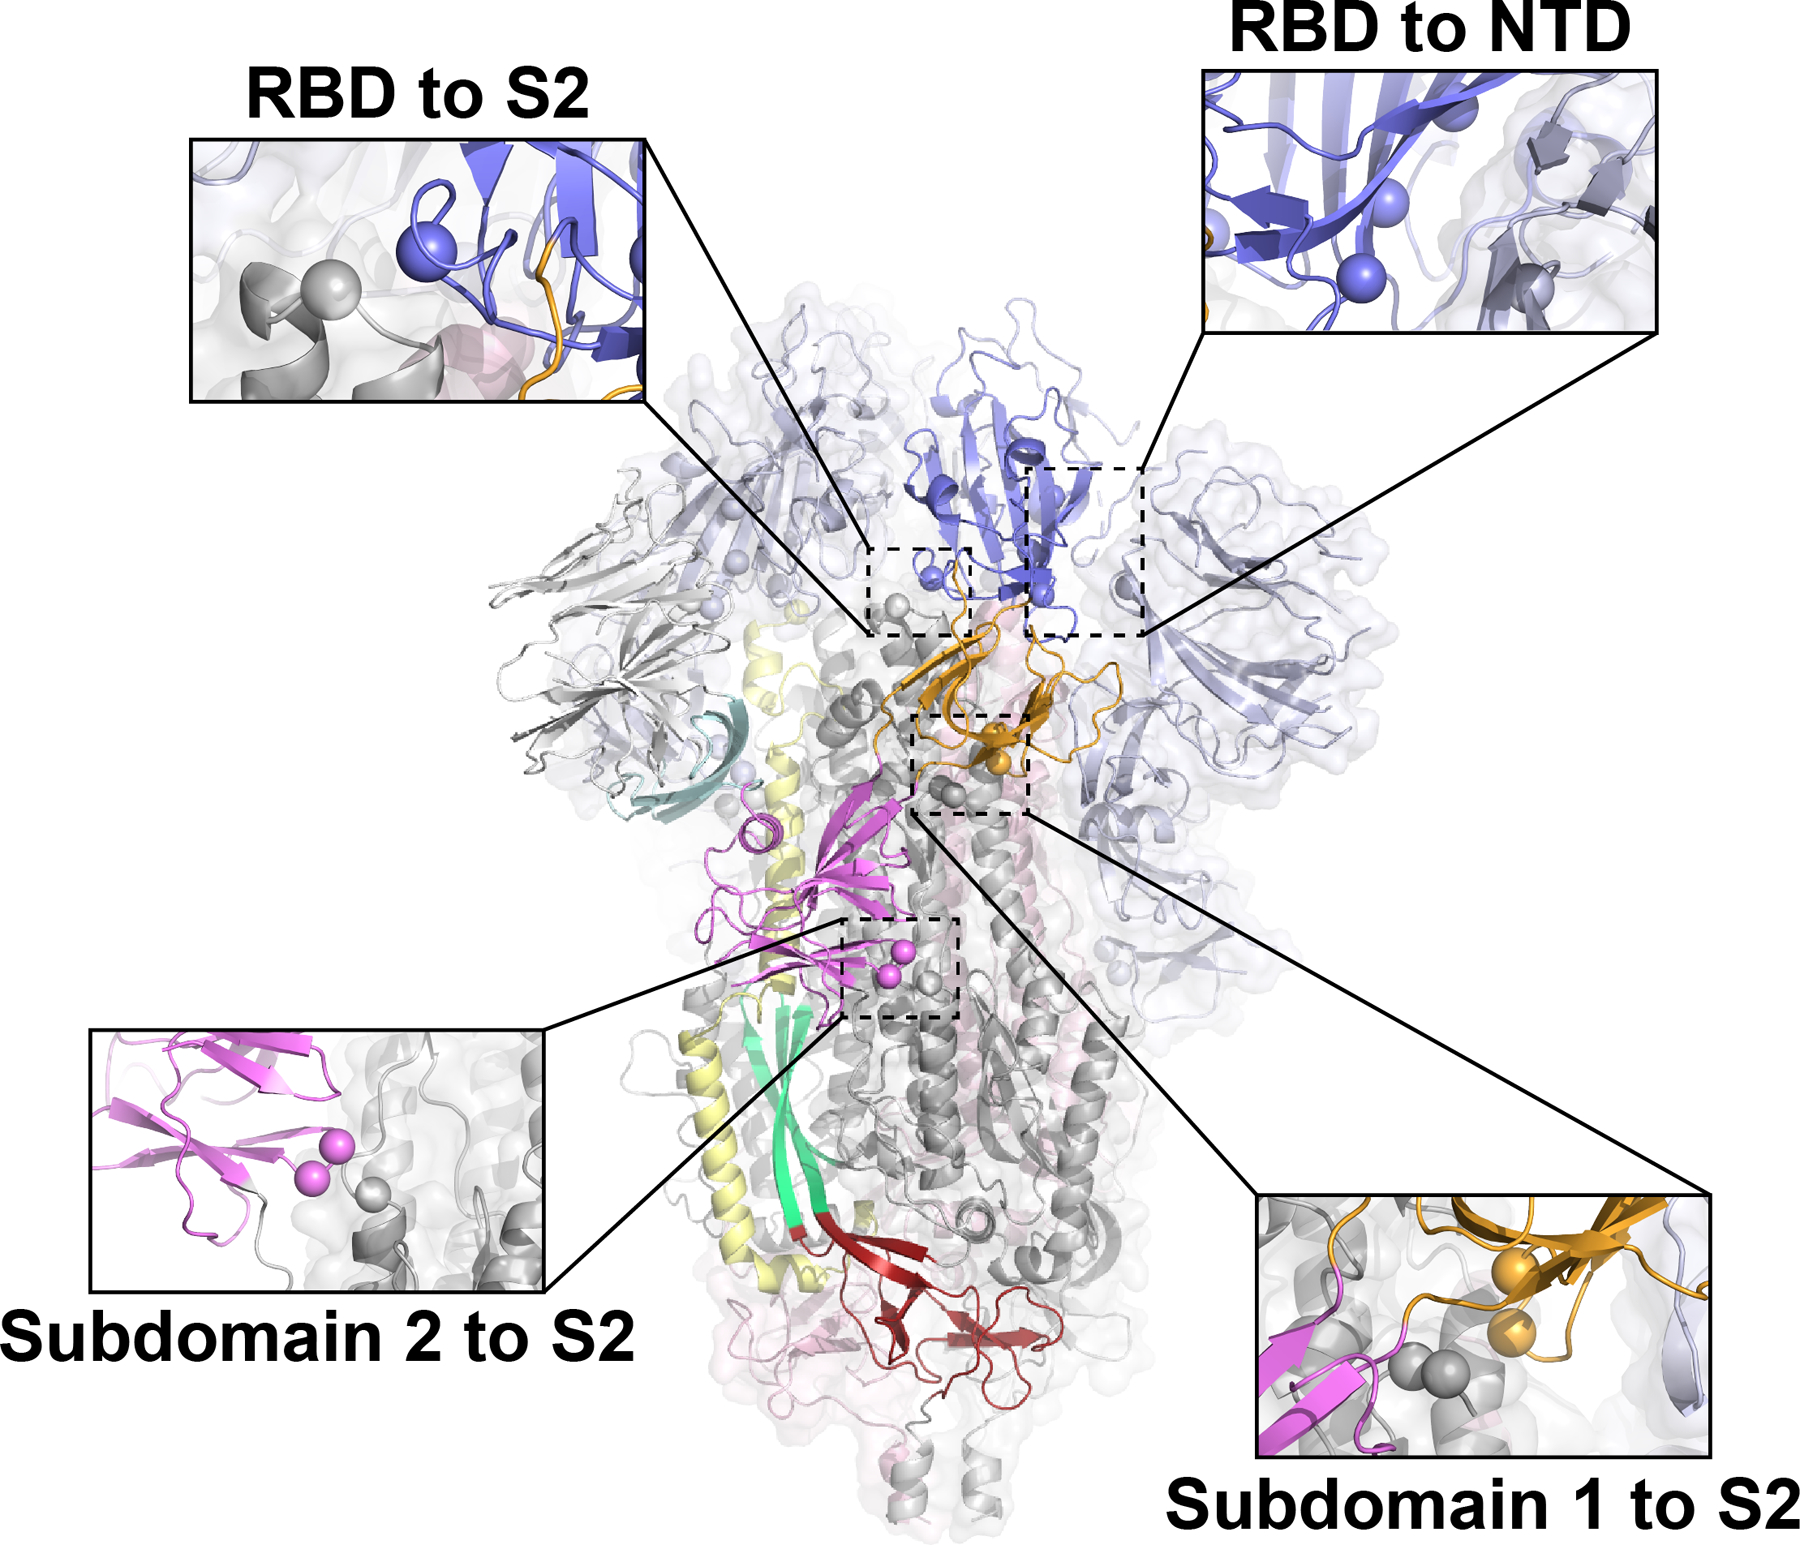
Single protomer colored according to Figure 1 with remaining two protomers color according to S1 (light blue) and S2 (grey). Spheres indicate candidate mutation sites.
Extended Data Fig. 3. SDS-PAGE and yields of purified S protein constructs.
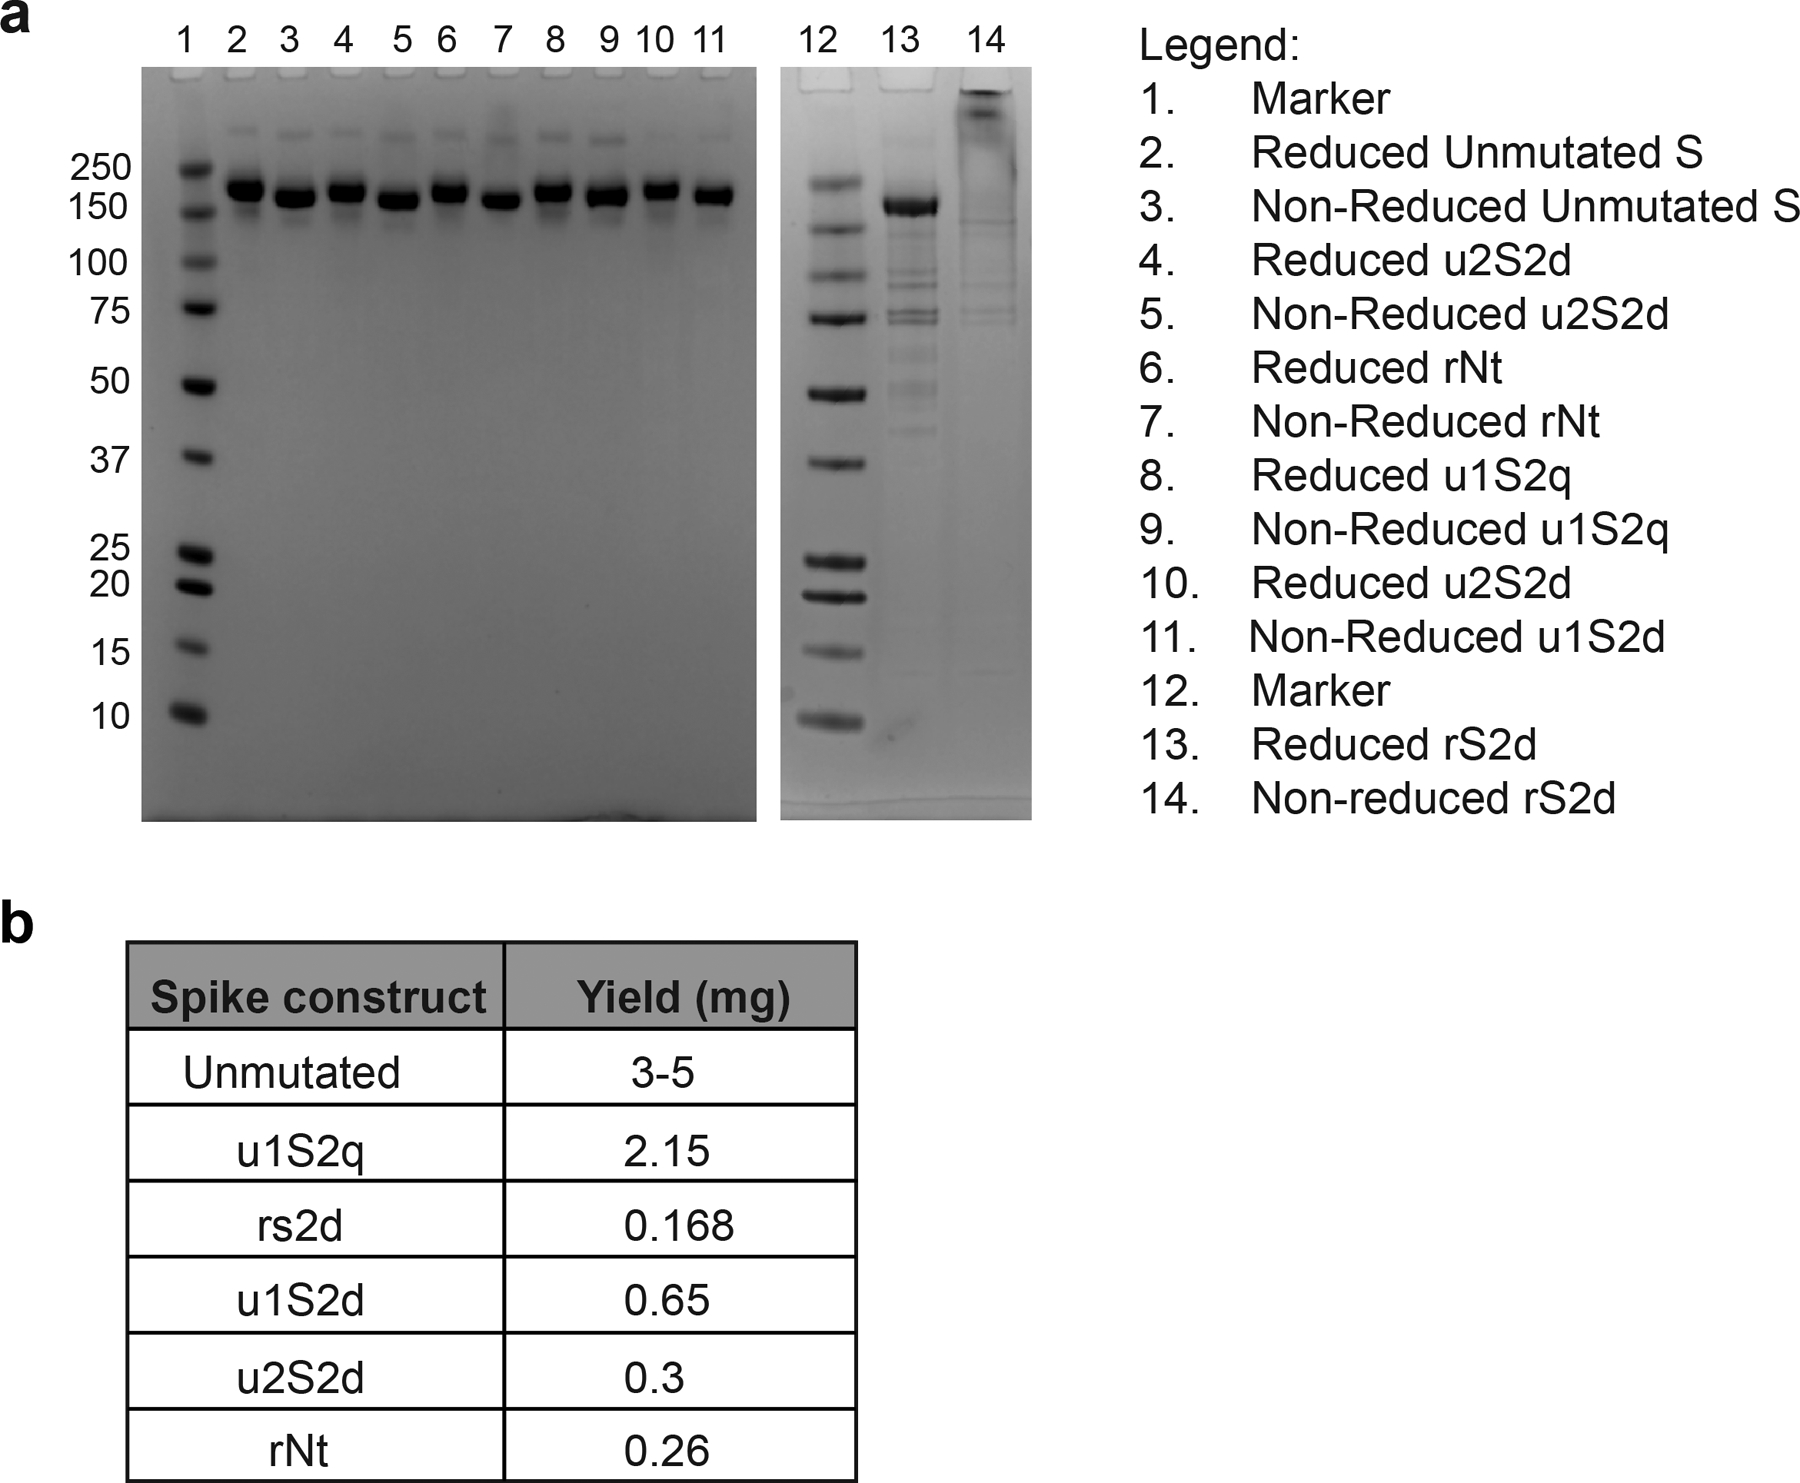
A) SDS-PAGE gels of the S protein constructs. B) Yields/L of the S protein constructs
Extended Data Fig. 4. Negative stain electron microscopy analysis of S-protein constructs.
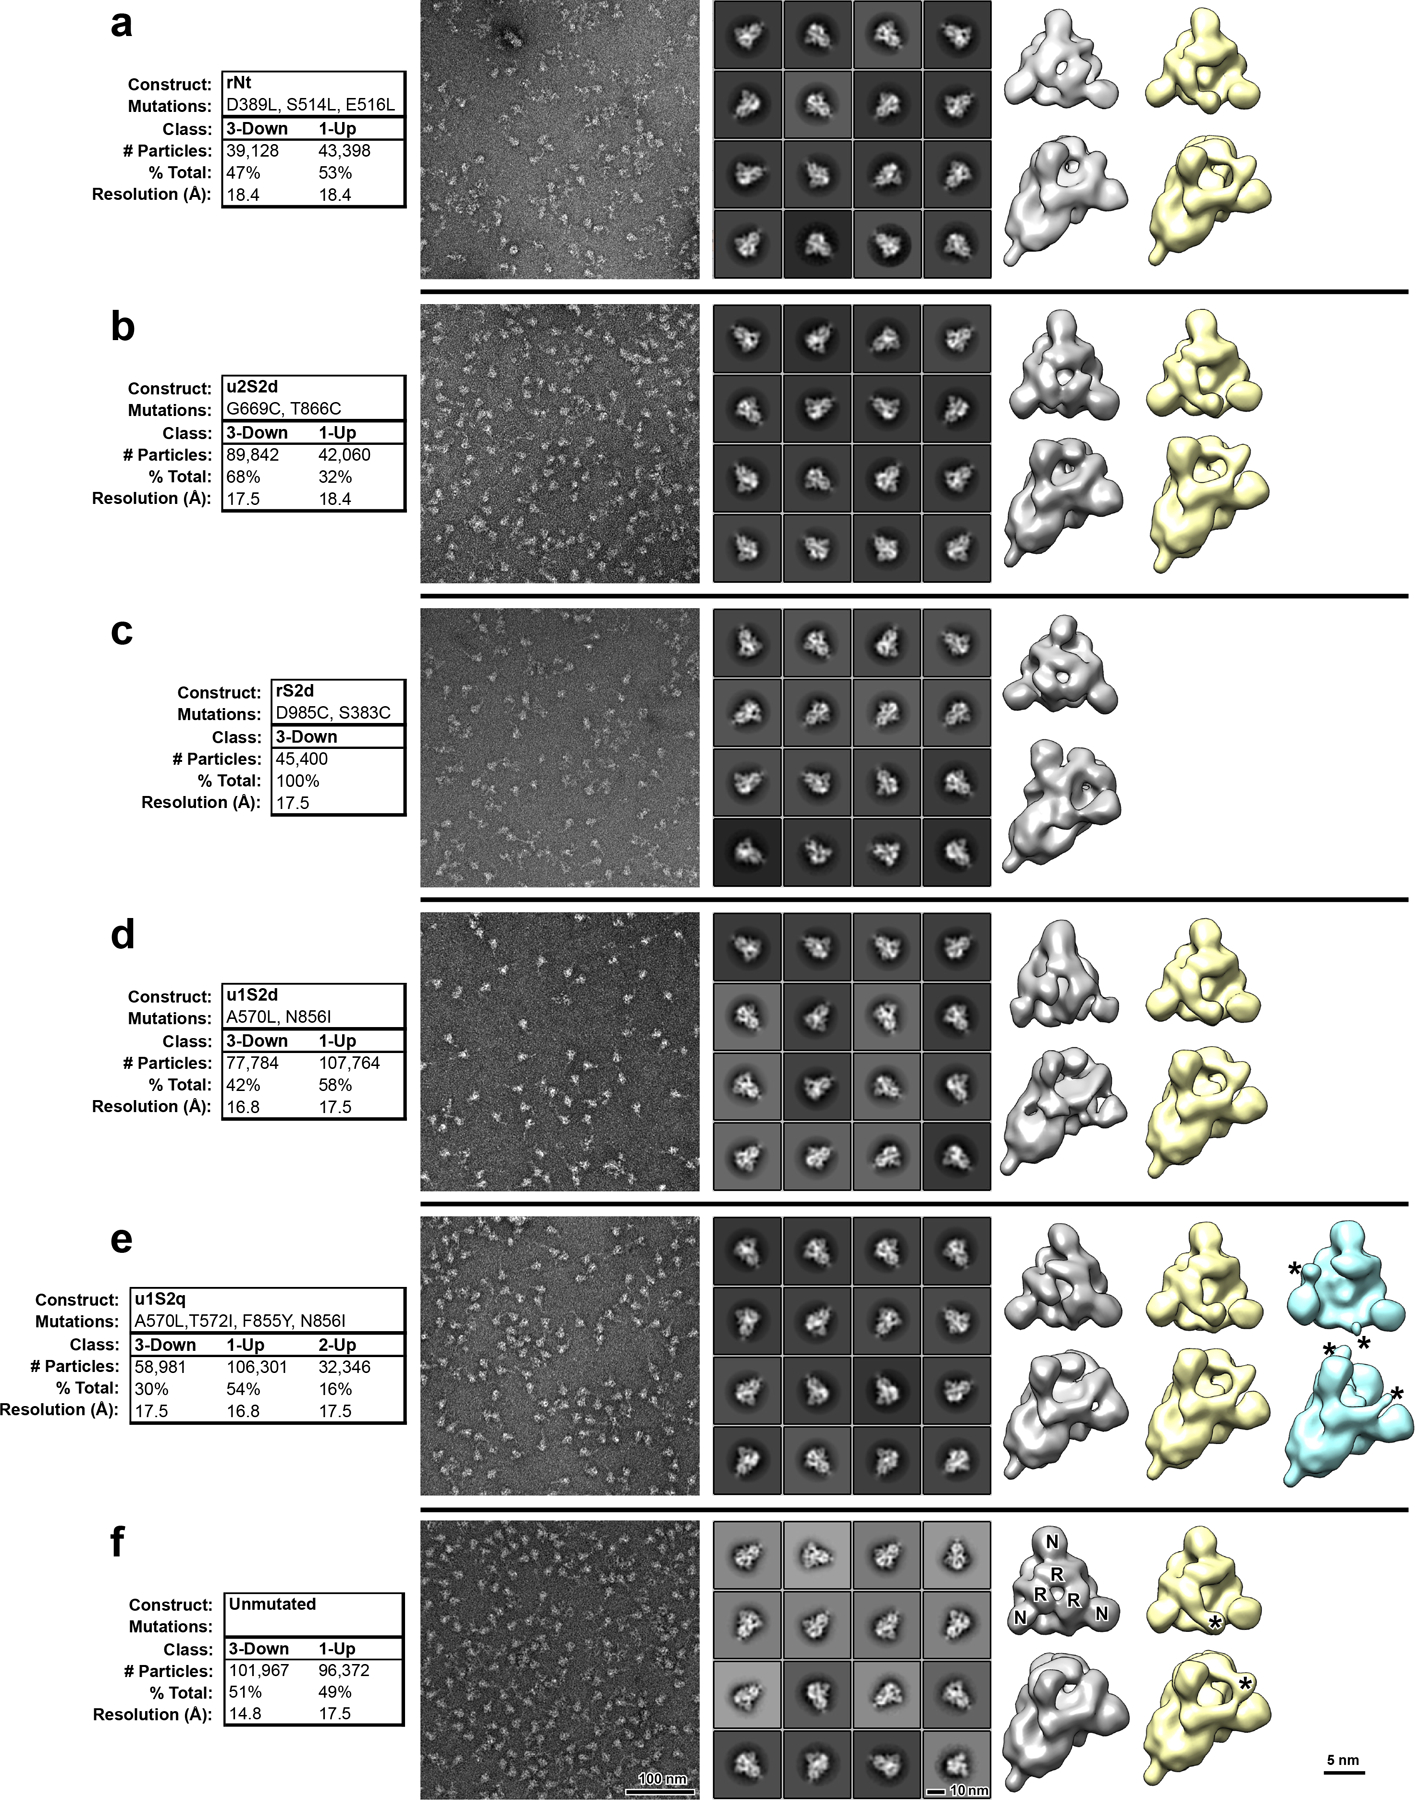
A) Data tables, indicating construct names, mutations, observed classes, number and percent of particles per class and final resolution (gold-standard Fourier-shell correlation, 0.143 level). B) Raw micrographs. C) Representative 2D class averages. D) 3D reconstructions of 3-RBD-down classes, shown in top view, looking down the S-protein 3-fold axis on the left and tilted view on the right. Receptor binding domains and N-terminal domains of first structure marked with R and N, respectively. E) 3D reconstructions of 1-RBD-up classes. Up-RBD is marked with an asterisk. F) 3D reconstruction of 2-RBD-up class. Density for up-RBDs is weak, indicated by asterisks.
Extended Data Fig. 5. Thermostability of the S protein constructs.
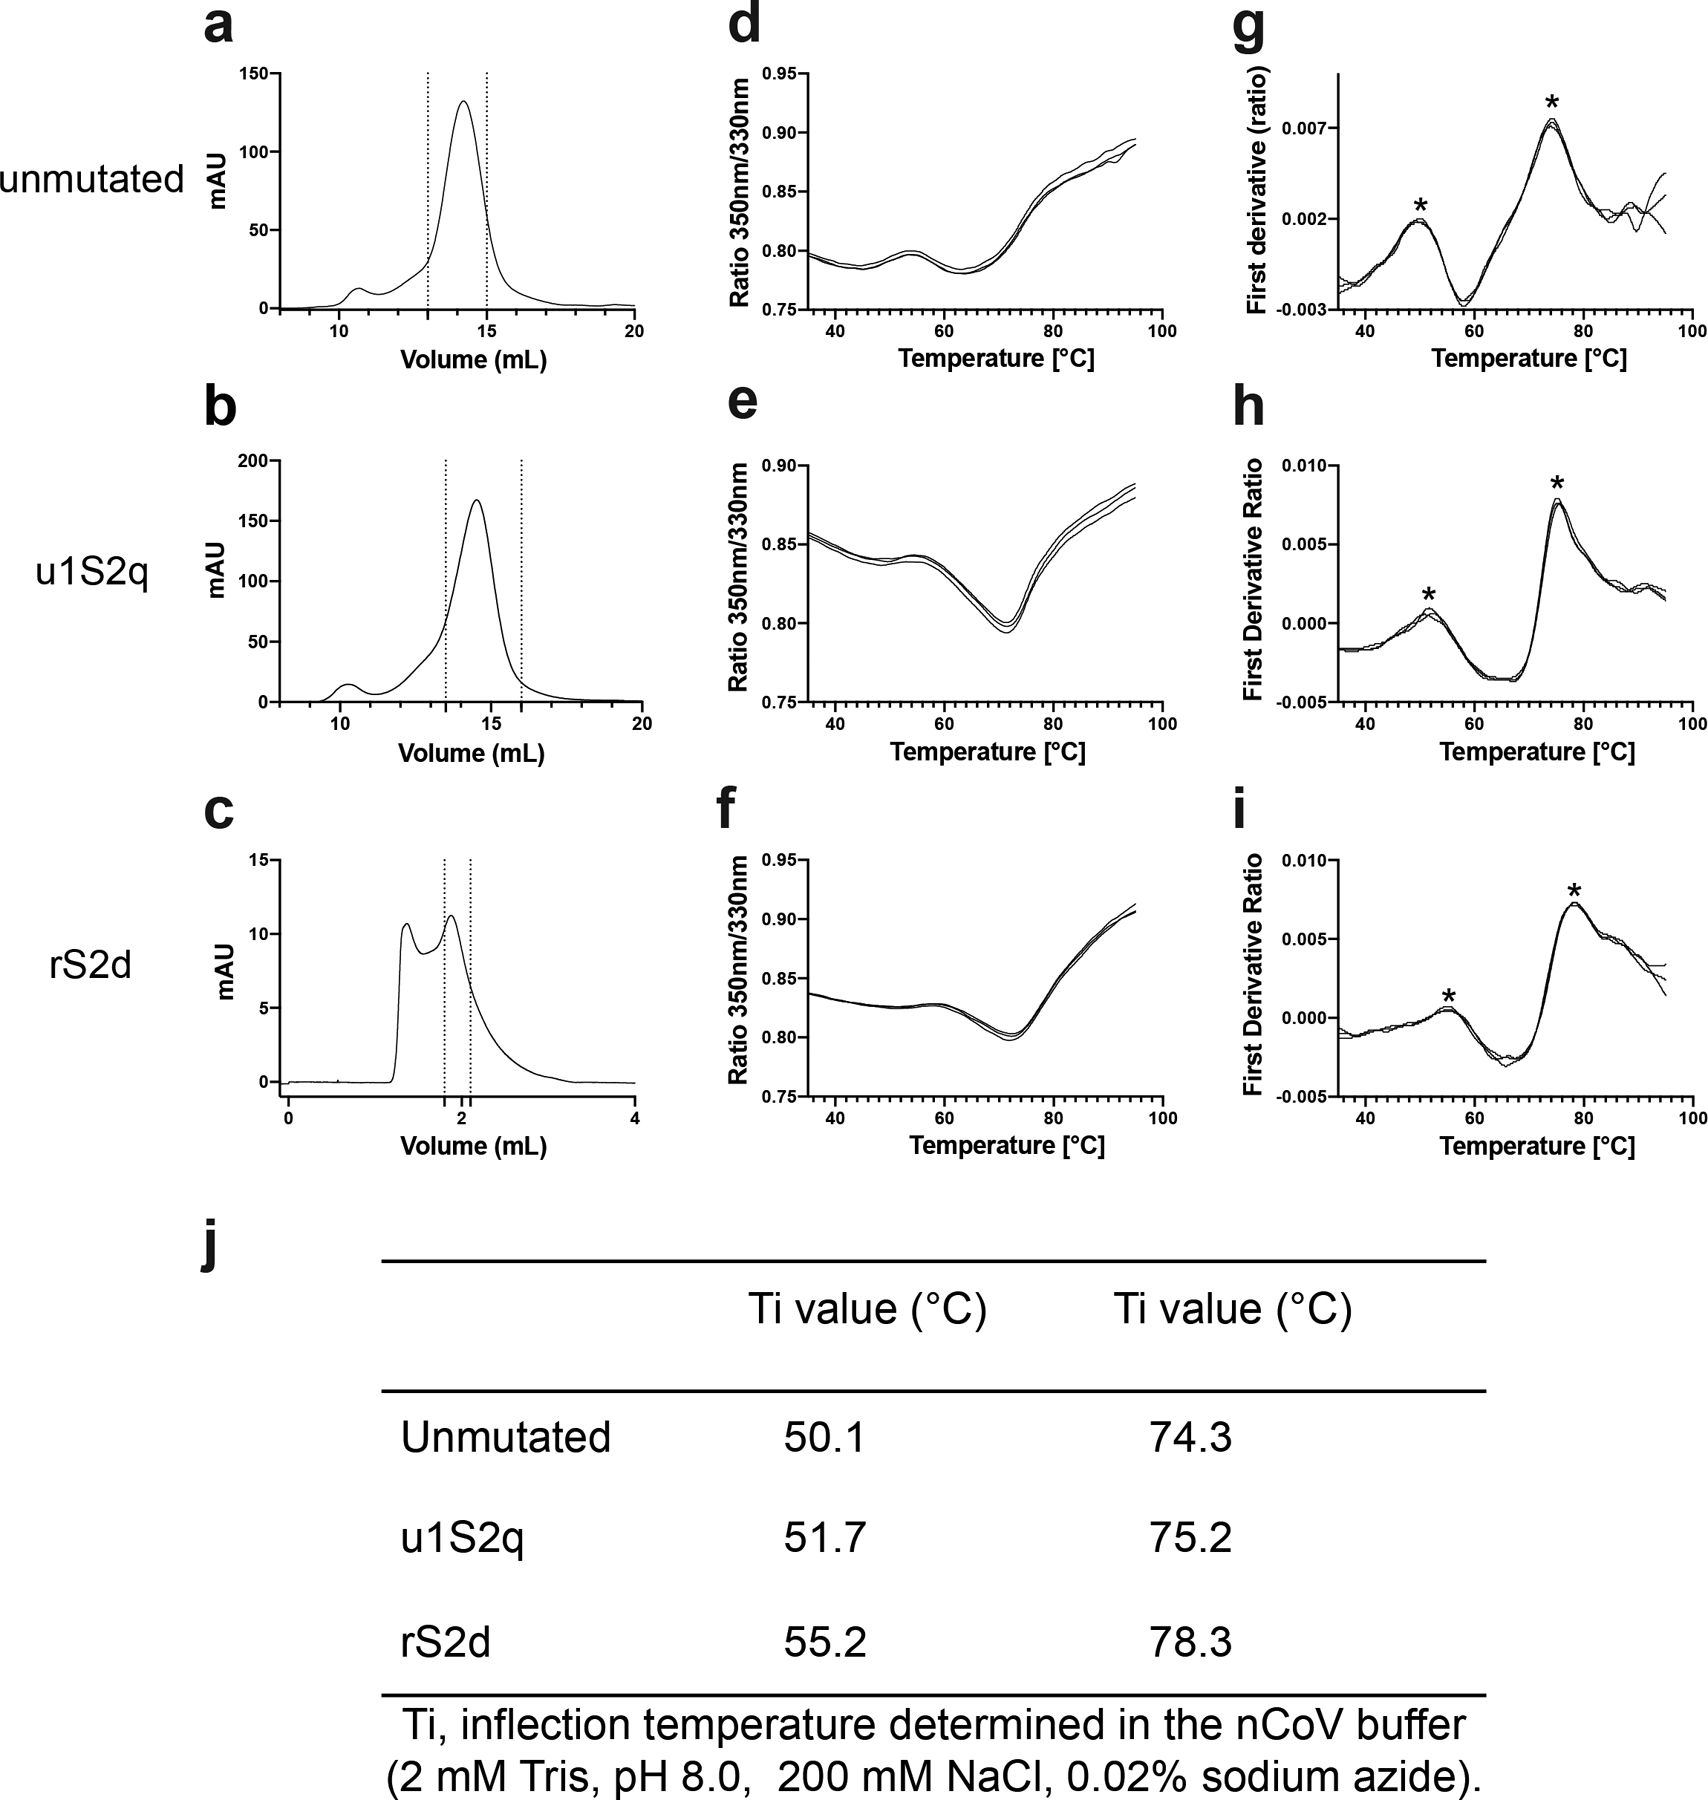
A-C) SEC profile of the S proteins. The dotted lines indicate the portion of the peak that was collected for further studies. The unmutated and u1S2q spikes were run on a Superose 6 Increase 10/300 column, and the rS2d spike was run on an analytical Superose 6 Increase 5/150 column. D-I) Unfolding profile curves obtained by intrinsic fluorescence measurements using Tycho NT. 6. D-F) show ratio between fluorescence at 350 nm and 330 nm. G-I) plot the first derivative of this ratio. J) Inflection temperatures for the S proteins. Asterisk mark the inflection temperatures in (G).
Extended Data Fig. 6. Cryo-EM data processing details for rS2d.
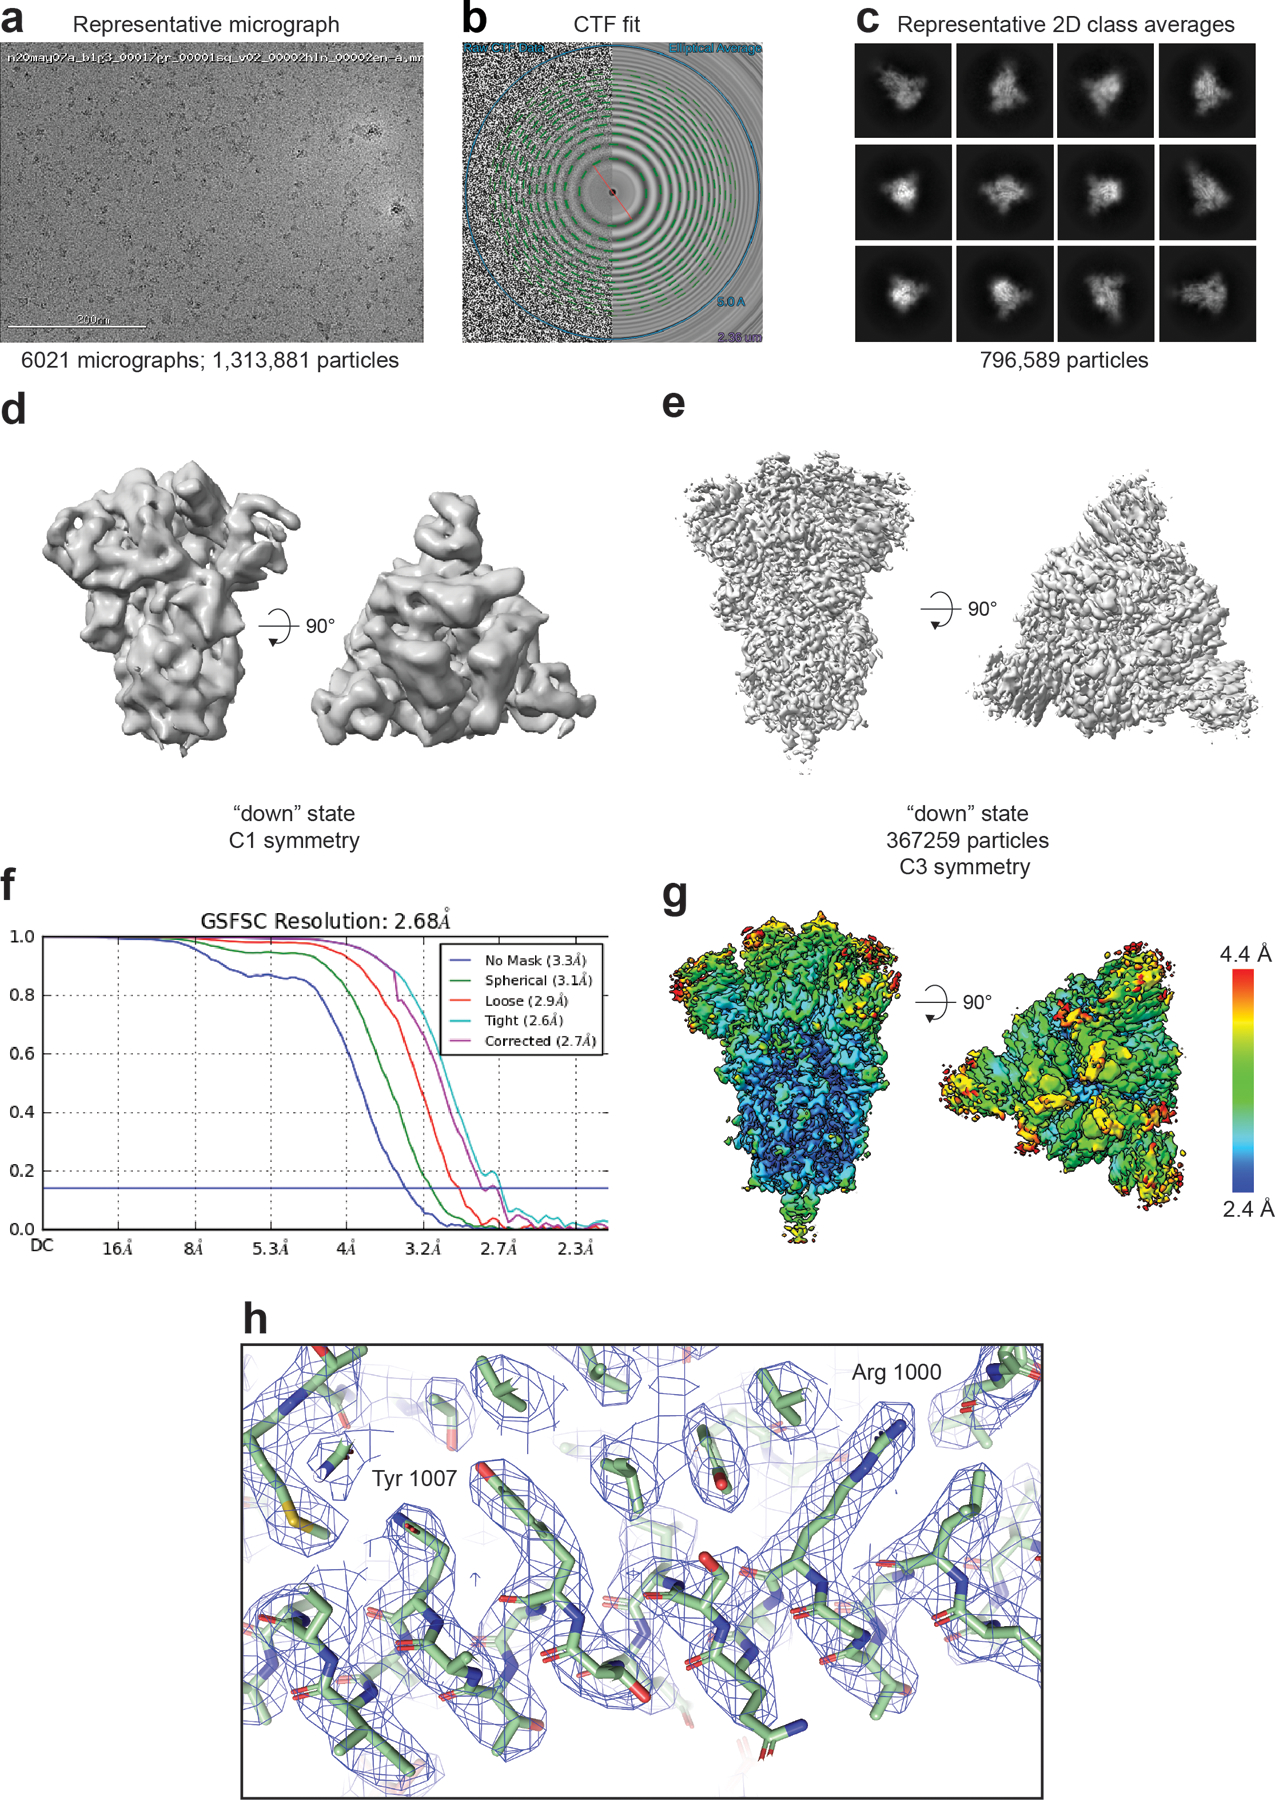
A) Representative micrograph. (B) CTF fit (C) Representative 2D class averages. (D) Ab initio reconstruction. (E) Refined map (F) Fourier shell correlation curves (G) Refined map colored by local resolution. (H) Zoomed-in view of the S2 region showing cryo-EM reconstruction as a transparent grey surface, the underlying fitted model in cartoon representation, and residues in ball-and-stick representation.
Extended Data Fig. 7. Binding of spike constructs to ACE-2 and RBD-binding antibody CR3022.
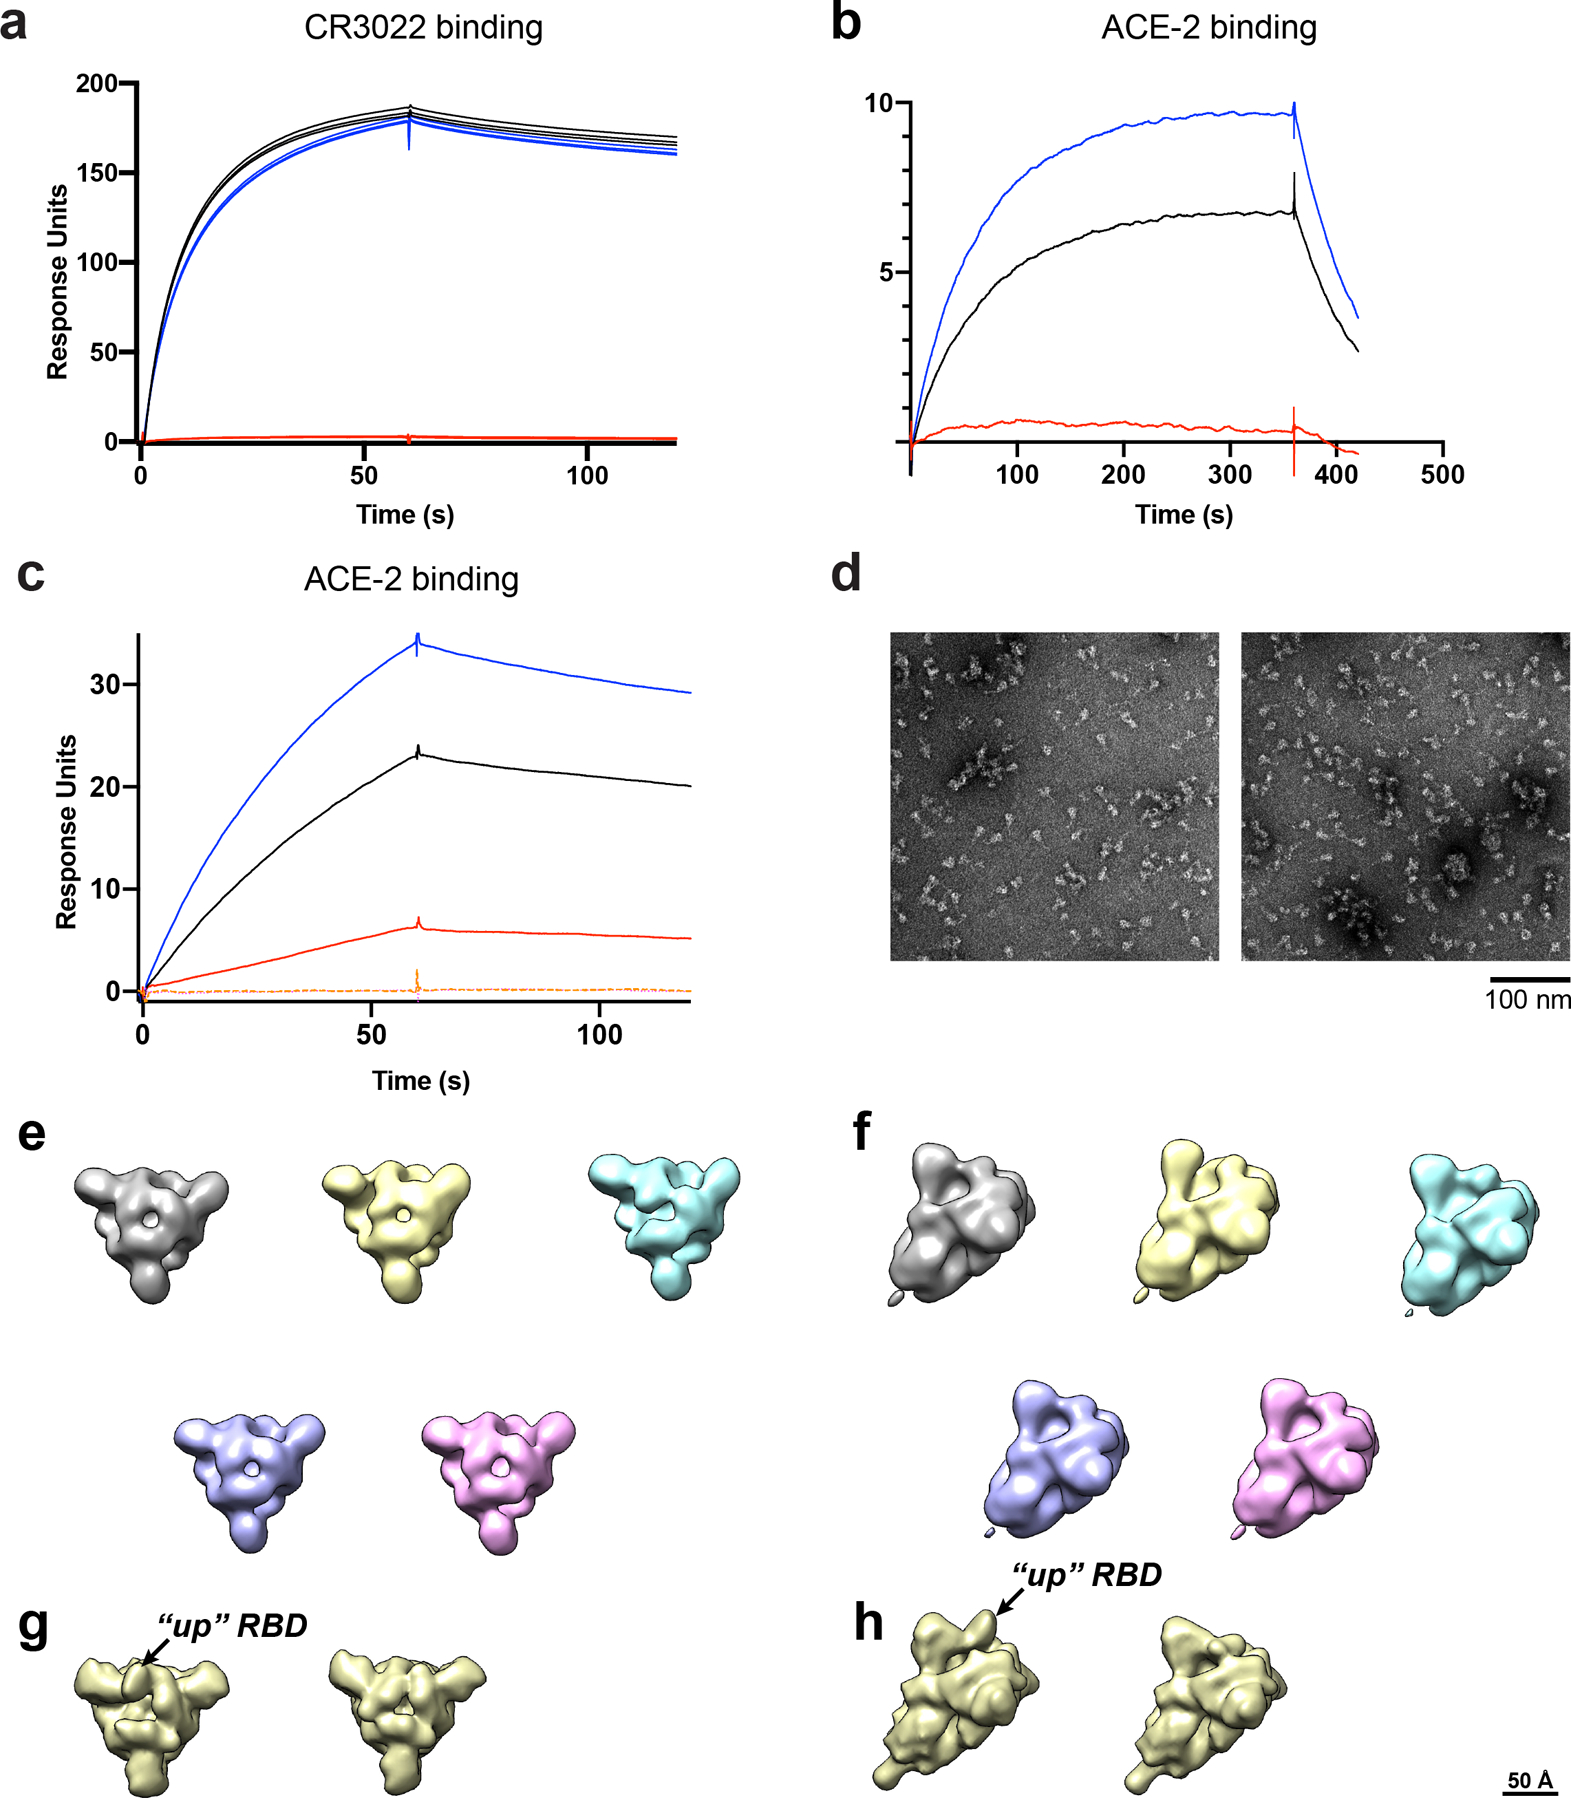
A) SPR sensorgrams of CR3022 antibody binding to unmutated (black line), u1S2q (blue line) or rS2d (red line) spike captured on a strepdavidin chip. B) SPR sensorgrams of ACE-2 (with C-terminal human Fc tag) to unmutated (black line), u1S2q (blue line) or rS2d (red line) spike captured on a strepdavidin chip. C) SPR sensorgrams of binding of unmutated (black line), u1S2q (blue line) or rS2d (red line) spike to ACE-2 (with C-terminal human Fc tag) captured on an anti-mouse Fc surface. The orange and magenta dotted lines are binding curves for rS2d following negative selection over a CR3022 or ACE-2 column, respectively. D) Representative NSEM micrographs of the flow-through after negative selection of the rS2d sample through an ACE-2 column (left) and CR3022 column (right). (E) Top views and (F) side views of 3D classes of particles from the dataset from the CR3022 column-eluted sample. C1 symmetry was used during classification. For comparison, images from cryo-EM maps low-pass filtered to 20 Å of the 1-RBD ‘up’ state (EMD-21457) and 3-RBD ‘down’ state (EMD-21452) are shown in figures (G) top view and (H) side view
Extended Data Fig. 8. Cryo-EM data processing details for u1s2q.
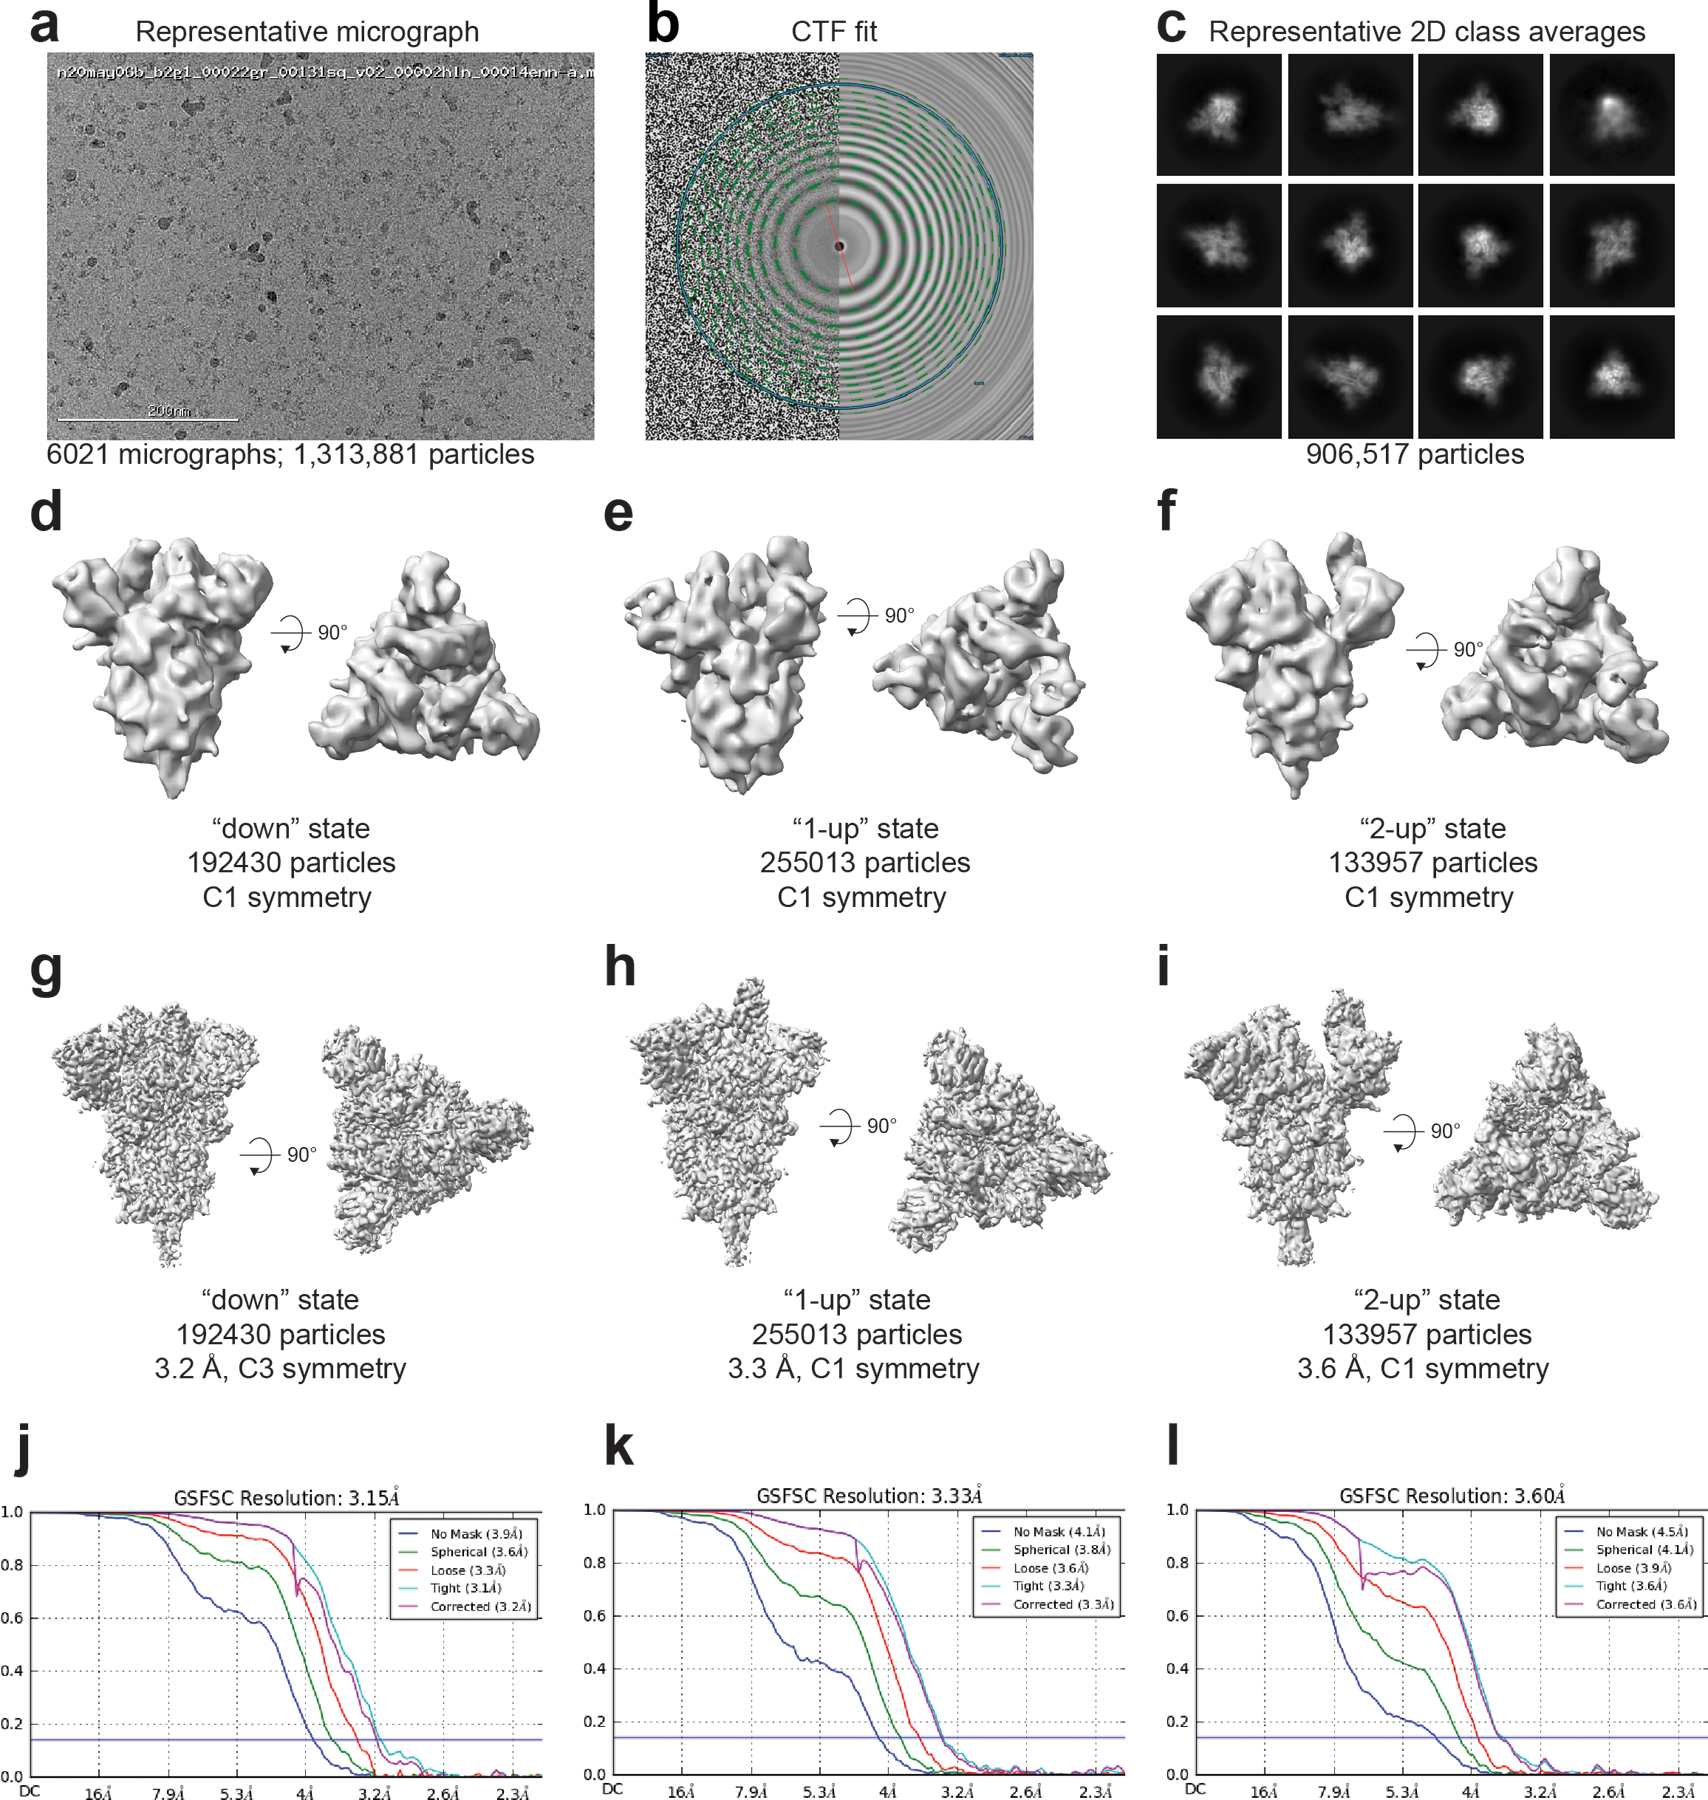
(A) Representative micrograph. (B) CTF fit (C) Representative 2D class averages. (D-F) Ab initio reconstructions for the (D) ‘down’ state, (E) ‘1-up’ state and (F) ‘2-up’ state. (G-I) Refined maps for the (G) ‘down’ state, (H) ‘1-up’ state and (I) ‘2-up’ state. (J-L) Fourier shell correlation curves for the (J) ‘down’ state, (E) ‘1-up’ state and (F) ‘2-up’ state.
Extended Data Fig. 9. Local map resolution for u1s2q.
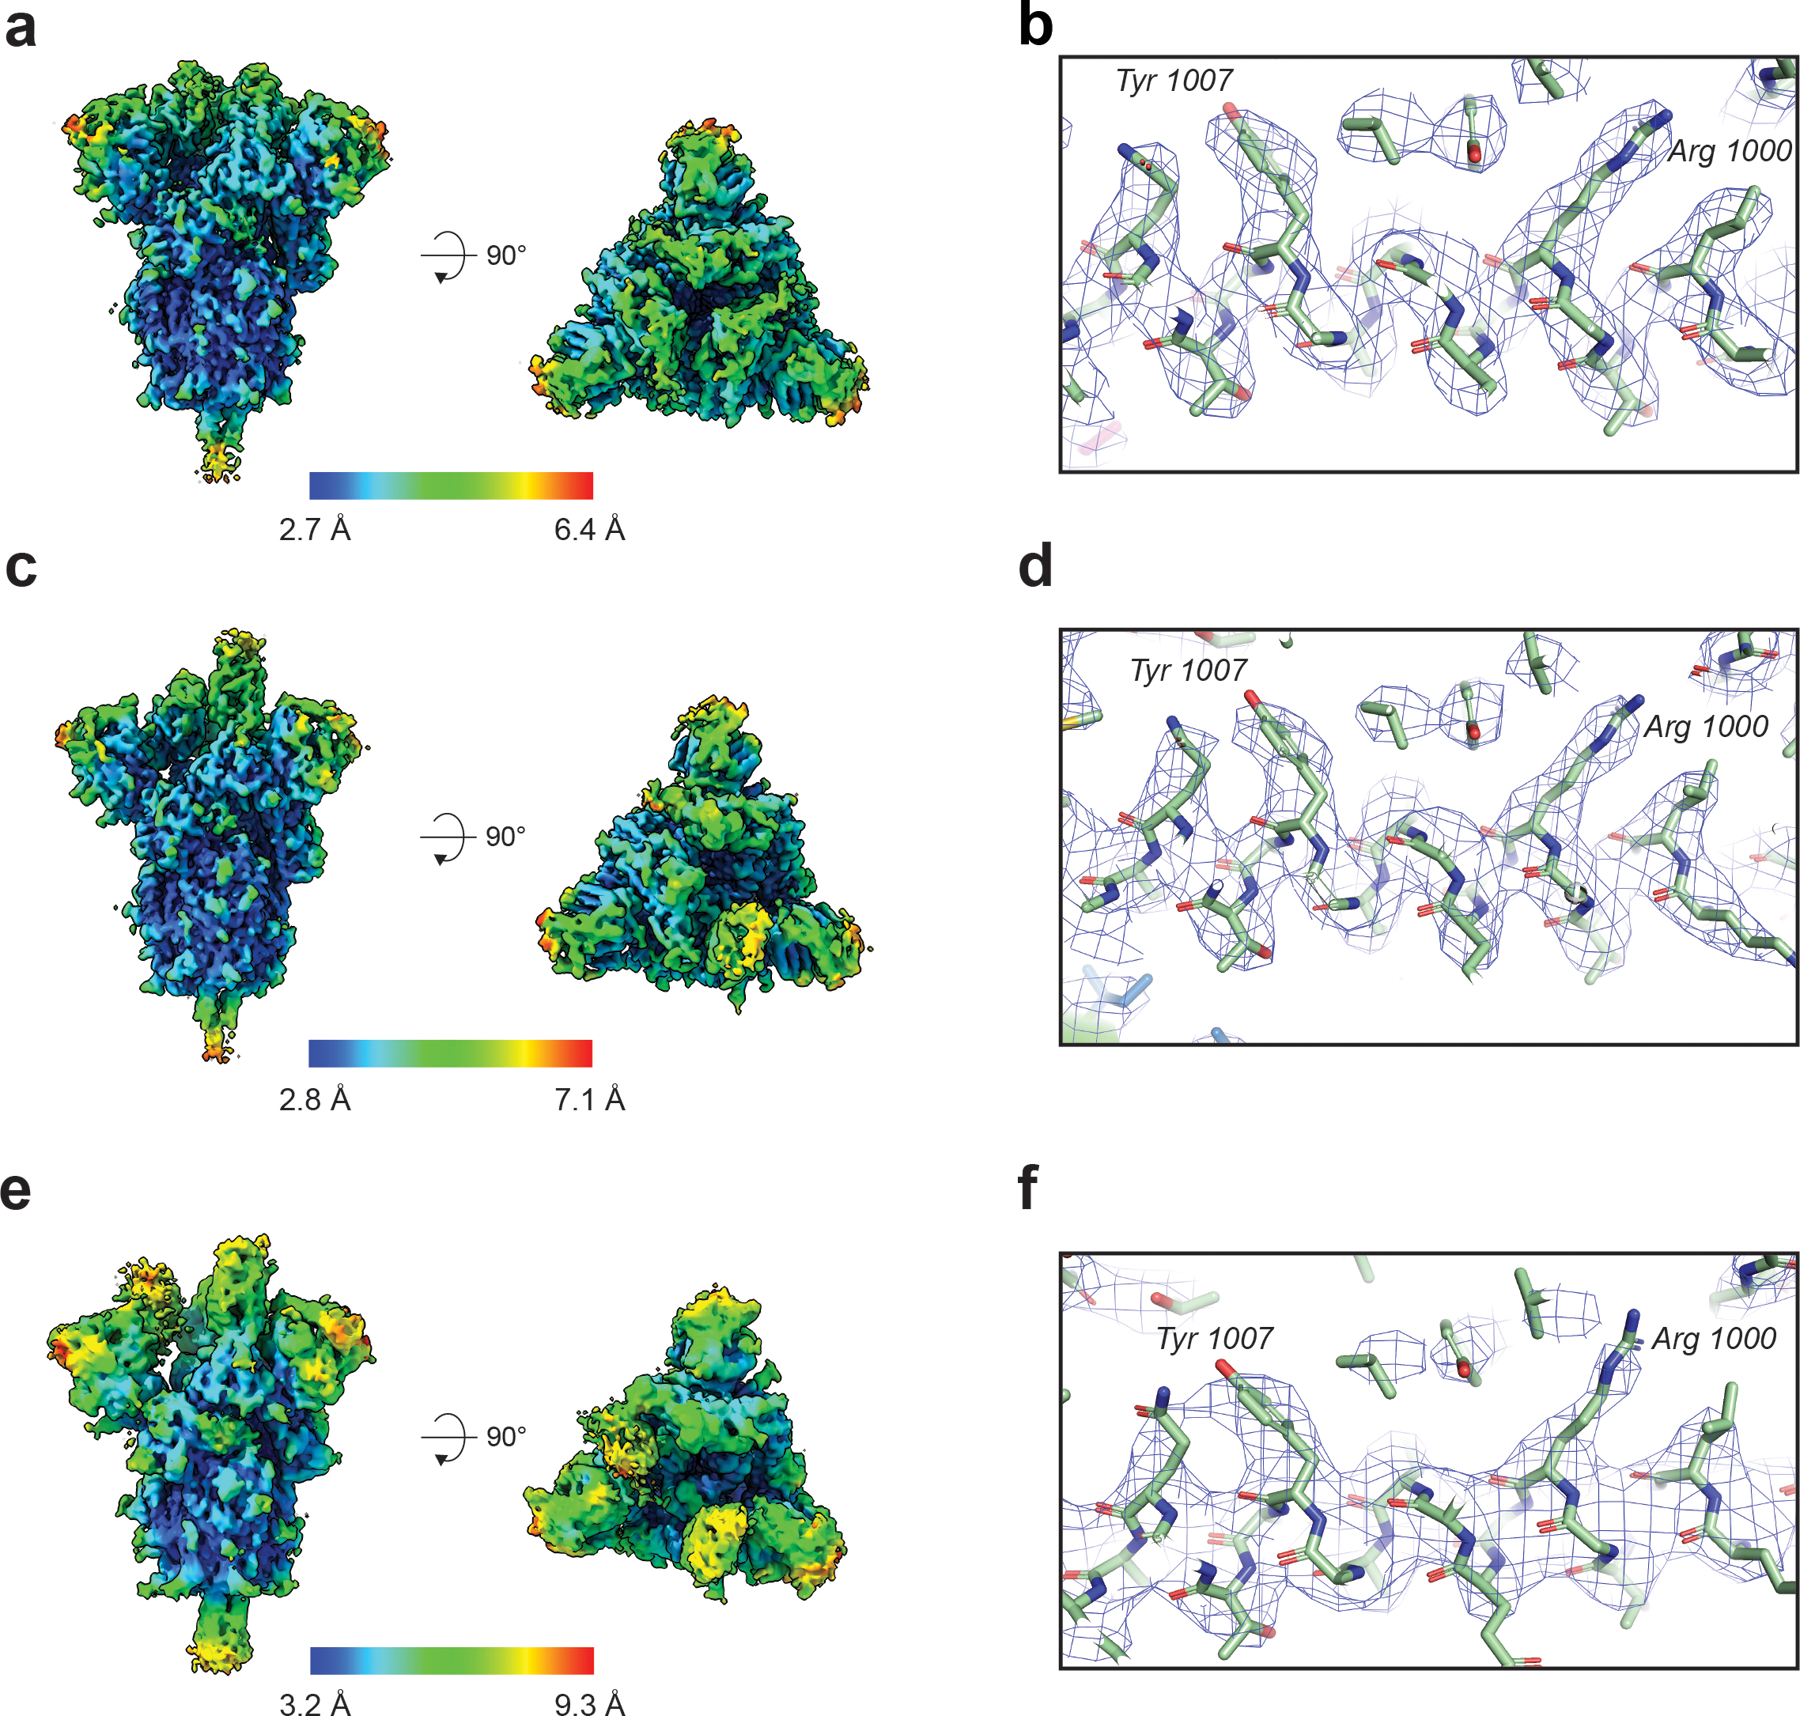
(A) Refined cryo-EM maps colored by local resolution and (B) Zoom-in image showing region in the S2 domain with the cryo-EM map shown as a transparent surface and underlying fitted model in cartoon representation, with residues shown as balls and sticks. (C) and (D) Same information as presented in panels (A) and (B) but for the 1-RBD ‘up’ state. (E) and (F) Same information as presented in panels (A) and (B) but for the 2-RBD ‘up’ state.
Extended Data Fig. 10. β-CoV Vector Analysis of SARS-2 and SARS-2 Designs.
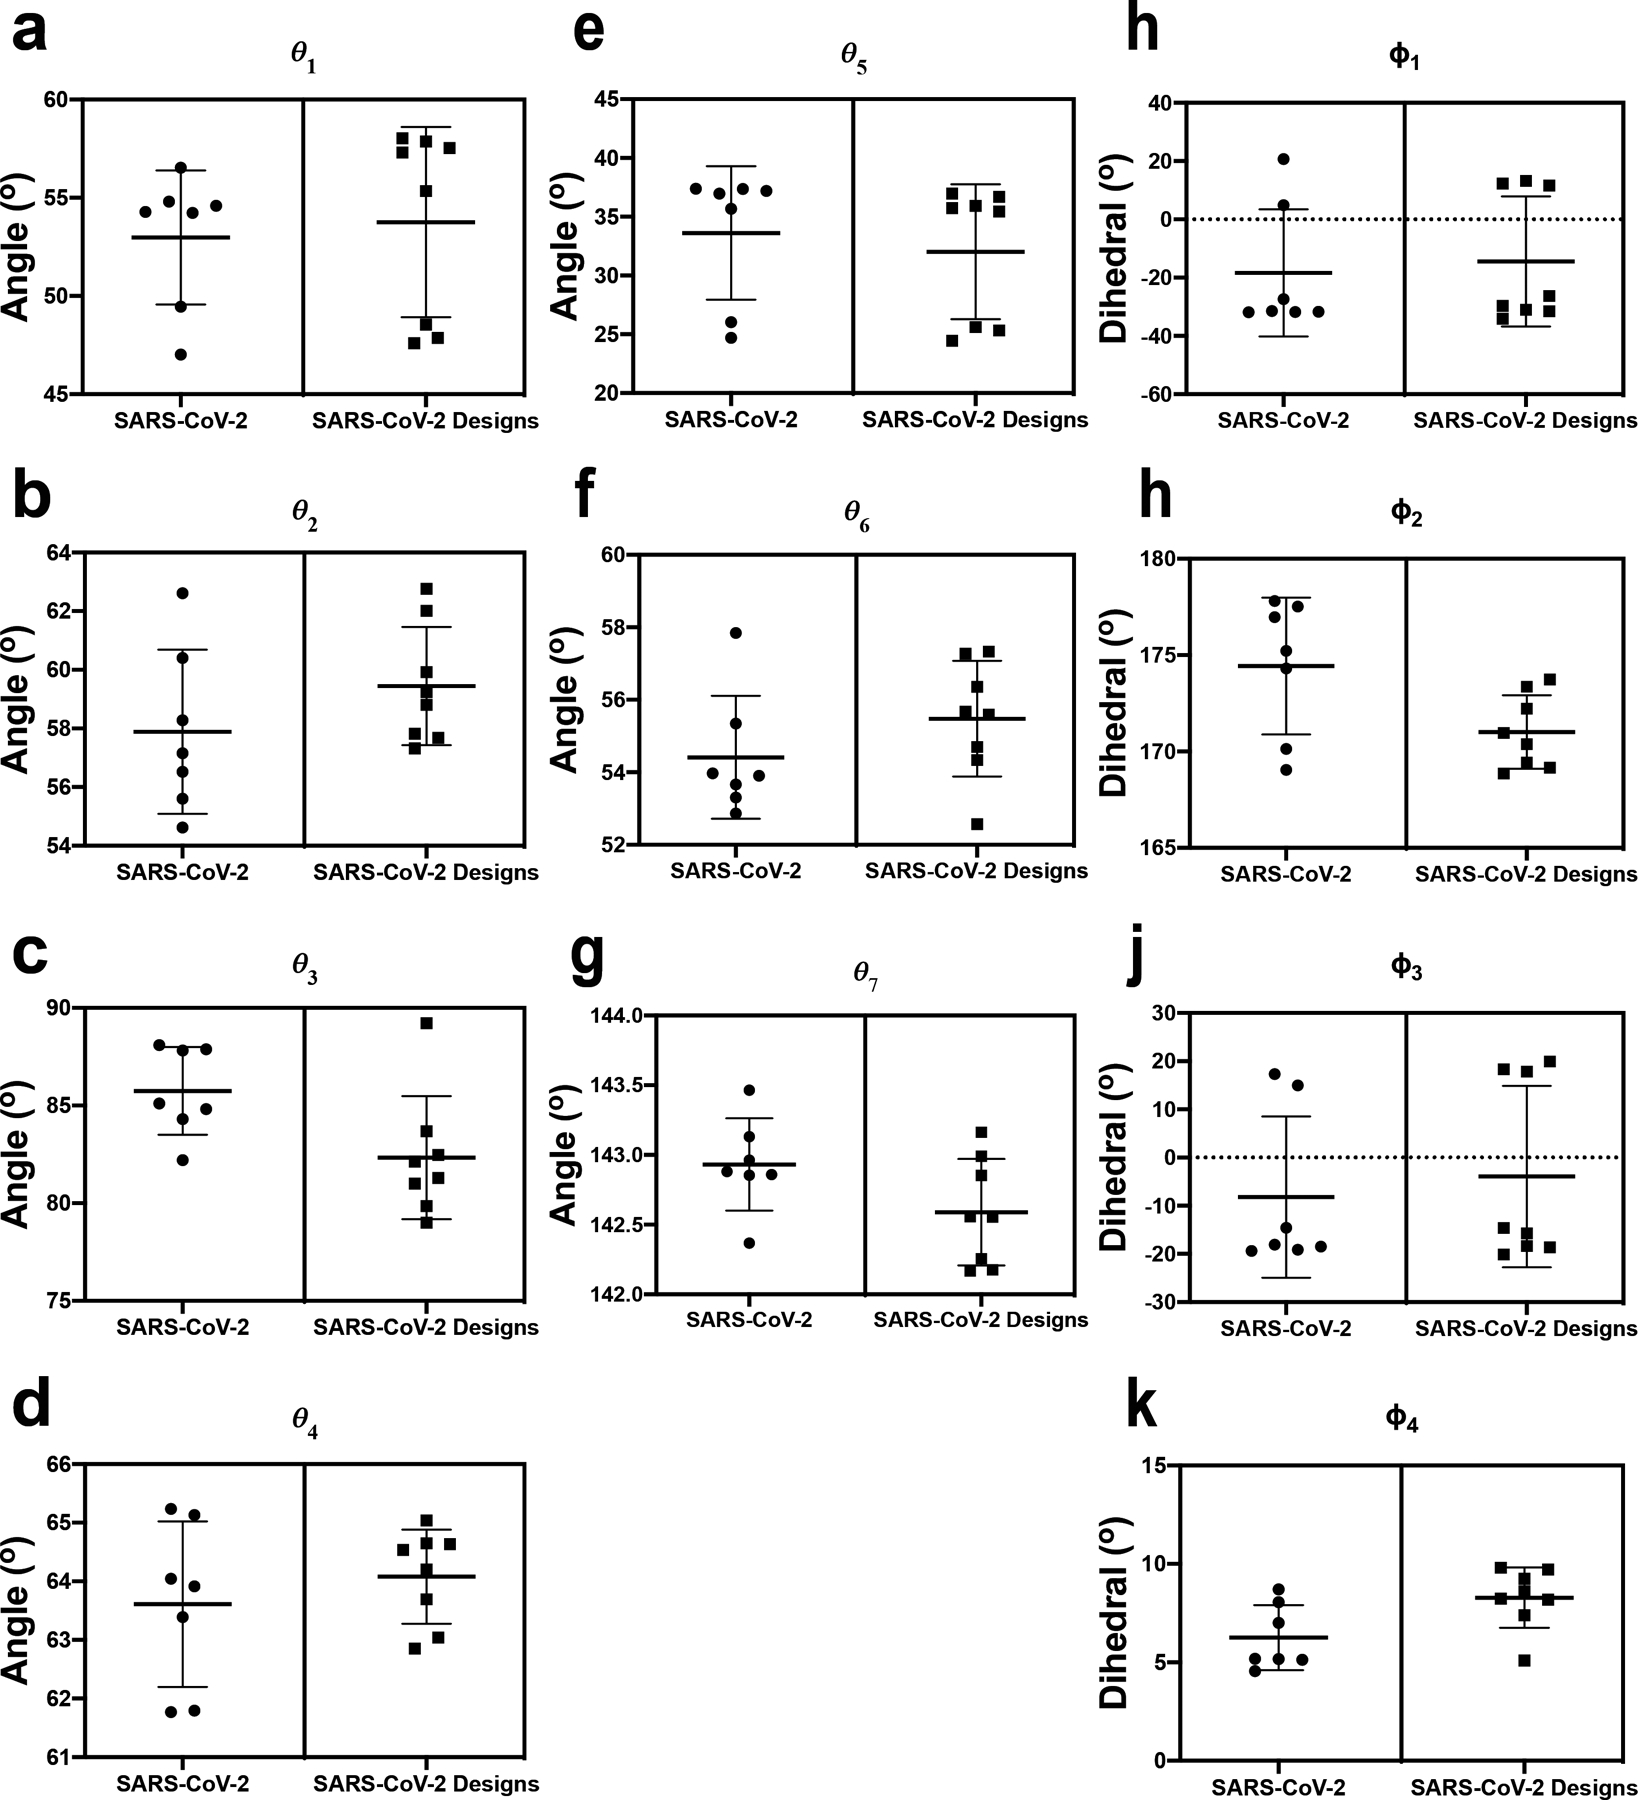
A-K) Angles and dihedrals for SARS-2 structures and SARS-2 designs depicted in Figure 1c. Individual data points are shown as circles or squares; lines denote mean and s.d.
Supplementary Material
Acknowledgements
Initial cryo-EM data were collected on the Titan Krios at the Shared Materials and Instrumentation Facility in Duke University. Data collection for high-resolution structure determination was performed at the National Center for Cryo-EM Access and Training (NCCAT) and the Simons Electron Microscopy Center located at the New York Structural Biology Center, supported by the NIH Common Fund Transformative High Resolution Cryo-Electron Microscopy program (U24 GM129539) and by grants from the Simons Foundation (SF349247) and NY State. We thank Ed Eng, Daija Bobe, Mark Walters and Holly Leddy for microscope alignments and assistance with cryo-EM data collection as well as Jason McLellan for providing the plasmid for the unmutated construct and Kartik Manne for preparing the CR3022 Fab. This work was supported by UM1 AI100645 (B.F.H), the Duke Center for HIV/AIDS Vaccine Immunology-Immunogen Discovery, and UM1 AI44371 (B.F.H.), the Duke Consortium for HIV/AIDS Vaccine Development, Division of AIDS, NIAID, NIH; Duke University Center for AIDS Research (CFAR); R01AI145687 and Translating Duke Health Initiative (P.A. and R.C.H.), the Intramural Research Program of the NIH; National Institute of Environmental Health Sciences (ZIC ES103326 to M.J.B.), and a contract from the State of North Carolina Pandemic Recovery Office through funds from the Coronavirus Aid, Relief, and Economic Security (CARES) Act. This study utilized the computational resources offered by Duke Research Computing (http://rc.duke.edu; NIH 1S10OD018164-01) at Duke University. We thank M. DeLong, C. Kneifel, M. Newton, V. Orlikowski, T. Milledge, and D. Lane from the Duke Office of Information Technology and Research Computing for providing assistance with setting up and maintaining the computing environment.
Footnotes
Competing interests
The authors declare no competing interests.
Code availability
The code developed to determine vector magnitudes, angles, and dihedrals for this study is available from the corresponding authors on reasonable request.
Data availability
Cryo-EM reconstructions and atomic models were deposited in the EMDB and wwPDB with accession codes EMD-21997, EMD-21999, EMD-22000 and EMD-22001, and PDB 6X29, 6X2A, 6X2B and 6X2C. Source data for graphs are available in Supplementary Data 1.
References
- 1.Kirchdoerfer RN et al. Pre-fusion structure of a human coronavirus spike protein. Nature 531, 118–121, doi: 10.1038/nature17200 (2016). [DOI] [PMC free article] [PubMed] [Google Scholar]
- 2.Hoffmann M et al. SARS-CoV-2 Cell Entry Depends on ACE2 and TMPRSS2 and Is Blocked by a Clinically Proven Protease Inhibitor. Cell 181, 271–280 e278, doi: 10.1016/j.cell.2020.02.052 (2020). [DOI] [PMC free article] [PubMed] [Google Scholar]
- 3.Wrapp D et al. Cryo-EM structure of the 2019-nCoV spike in the prefusion conformation. Science 367, 1260–1263, doi: 10.1126/science.abb2507 (2020). [DOI] [PMC free article] [PubMed] [Google Scholar]
- 4.Yuan Y et al. Cryo-EM structures of MERS-CoV and SARS-CoV spike glycoproteins reveal the dynamic receptor binding domains. Nature Communications 8, 15092, doi: 10.1038/ncomms15092 (2017). [DOI] [PMC free article] [PubMed] [Google Scholar]
- 5.Gui M et al. Cryo-electron microscopy structures of the SARS-CoV spike glycoprotein reveal a prerequisite conformational state for receptor binding. Cell Research 27, 119–129, doi: 10.1038/cr.2016.152 (2017). [DOI] [PMC free article] [PubMed] [Google Scholar]
- 6.Song W, Gui M, Wang X & Xiang Y Cryo-EM structure of the SARS coronavirus spike glycoprotein in complex with its host cell receptor ACE2. PLOS Pathogens 14, e1007236, doi: 10.1371/journal.ppat.1007236 (2018). [DOI] [PMC free article] [PubMed] [Google Scholar]
- 7.Kirchdoerfer RN et al. Stabilized coronavirus spikes are resistant to conformational changes induced by receptor recognition or proteolysis. Scientific Reports 8, 15701, doi: 10.1038/s41598-018-34171-7 (2018). [DOI] [PMC free article] [PubMed] [Google Scholar]
- 8.Walls AC et al. Unexpected Receptor Functional Mimicry Elucidates Activation of Coronavirus Fusion. Cell 176, 1026–1039.e1015, doi: 10.1016/j.cell.2018.12.028 (2019). [DOI] [PMC free article] [PubMed] [Google Scholar]
- 9.Pallesen J et al. Immunogenicity and structures of a rationally designed prefusion MERS-CoV spike antigen. Proceedings of the National Academy of Sciences 114, E7348, doi: 10.1073/pnas.1707304114 (2017). [DOI] [PMC free article] [PubMed] [Google Scholar]
- 10.Tortorici MA et al. Structural basis for human coronavirus attachment to sialic acid receptors. Nature Structural & Molecular Biology 26, 481–489, doi: 10.1038/s41594-019-0233-y (2019). [DOI] [PMC free article] [PubMed] [Google Scholar]
- 11.Walls AC et al. Cryo-electron microscopy structure of a coronavirus spike glycoprotein trimer. Nature 531, 114–117, doi: 10.1038/nature16988 (2016). [DOI] [PMC free article] [PubMed] [Google Scholar]
- 12.Pallesen J et al. Immunogenicity and structures of a rationally designed prefusion MERS-CoV spike antigen. Proc Natl Acad Sci U S A 114, E7348–E7357, doi: 10.1073/pnas.1707304114 (2017). [DOI] [PMC free article] [PubMed] [Google Scholar]
- 13.Park Y-J et al. Structures of MERS-CoV spike glycoprotein in complex with sialoside attachment receptors. Nature Structural & Molecular Biology 26, 1151–1157, doi: 10.1038/s41594-019-0334-7 (2019). [DOI] [PMC free article] [PubMed] [Google Scholar]
- 14.Walls AC et al. Structure, Function, and Antigenicity of the SARS-CoV-2 Spike Glycoprotein. Cell, doi: 10.1016/j.cell.2020.02.058 (2020). [DOI] [PMC free article] [PubMed] [Google Scholar]
- 15.Wrapp D et al. Cryo-EM structure of the 2019-nCoV spike in the prefusion conformation. Science 367, 1260, doi: 10.1126/science.abb2507 (2020). [DOI] [PMC free article] [PubMed] [Google Scholar]
- 16.Madhavi Sastry G, Adzhigirey M, Day T, Annabhimoju R & Sherman W Protein and ligand preparation: parameters, protocols, and influence on virtual screening enrichments. Journal of Computer-Aided Molecular Design 27, 221–234, doi: 10.1007/s10822-013-9644-8 (2013). [DOI] [PubMed] [Google Scholar]
- 17.Salam NK, Adzhigirey M, Sherman W & Pearlman DA Structure-based approach to the prediction of disulfide bonds in proteins. Protein Engineering, Design and Selection 27, 365–374, doi: 10.1093/protein/gzu017 (2014). [DOI] [PubMed] [Google Scholar]
- 18.Beard H, Cholleti A, Pearlman D, Sherman W & Loving KA Applying Physics-Based Scoring to Calculate Free Energies of Binding for Single Amino Acid Mutations in Protein-Protein Complexes. PLOS ONE 8, e82849, doi: 10.1371/journal.pone.0082849 (2013). [DOI] [PMC free article] [PubMed] [Google Scholar]
- 19.Walls AC et al. Structure, Function, and Antigenicity of the SARS-CoV-2 Spike Glycoprotein. Cell 181, 281–292 e286, doi: 10.1016/j.cell.2020.02.058 (2020). [DOI] [PMC free article] [PubMed] [Google Scholar]
- 20.Yuan M et al. A highly conserved cryptic epitope in the receptor binding domains of SARS-CoV-2 and SARS-CoV. Science 368, 630, doi: 10.1126/science.abb7269 (2020). [DOI] [PMC free article] [PubMed] [Google Scholar]
- 21.ter Meulen J et al. Human monoclonal antibody combination against SARS coronavirus: synergy and coverage of escape mutants. PLoS Med 3, e237, doi: 10.1371/journal.pmed.0030237 (2006). [DOI] [PMC free article] [PubMed] [Google Scholar]
- 22.Rey FA & Lok S-M Common Features of Enveloped Viruses and Implications for Immunogen Design for Next-Generation Vaccines. Cell 172, 1319–1334, doi: 10.1016/j.cell.2018.02.054 (2018). [DOI] [PMC free article] [PubMed] [Google Scholar]
- 23.de Taeye Steven W. et al. Immunogenicity of Stabilized HIV-1 Envelope Trimers with Reduced Exposure of Non-neutralizing Epitopes. Cell 163, 1702–1715, doi: 10.1016/j.cell.2015.11.056 (2015). [DOI] [PMC free article] [PubMed] [Google Scholar]
- 24.He L et al. HIV-1 vaccine design through minimizing envelope metastability. Science advances 4, eaau6769–eaau6769, doi: 10.1126/sciadv.aau6769 (2018). [DOI] [PMC free article] [PubMed] [Google Scholar]
- 25.Zhang P et al. Interdomain Stabilization Impairs CD4 Binding and Improves Immunogenicity of the HIV-1 Envelope Trimer. Cell Host & Microbe 23, 832–844.e836, doi: 10.1016/j.chom.2018.05.002 (2018). [DOI] [PMC free article] [PubMed] [Google Scholar]
- 26.Chuang G-Y et al. Structure-Based Design of a Soluble Prefusion-Closed HIV-1 Env Trimer with Reduced CD4 Affinity and Improved Immunogenicity. Journal of Virology 91, doi: 10.1128/JVI.02268-16 (2017). [DOI] [PMC free article] [PubMed] [Google Scholar]
- 27.Torrents de la Peña A et al. Improving the Immunogenicity of Native-like HIV-1 Envelope Trimers by Hyperstabilization. Cell reports 20, 1805–1817, doi: 10.1016/j.celrep.2017.07.077 (2017). [DOI] [PMC free article] [PubMed] [Google Scholar]
- 28.Medina-Ramírez M et al. Design and crystal structure of a native-like HIV-1 envelope trimer that engages multiple broadly neutralizing antibody precursors in vivo. The Journal of Experimental Medicine 214, 2573, doi: 10.1084/jem.20161160 (2017). [DOI] [PMC free article] [PubMed] [Google Scholar]
- 29.Steichen JM et al. HIV Vaccine Design to Target Germline Precursors of Glycan-Dependent Broadly Neutralizing Antibodies. Immunity 45, 483–496, doi: 10.1016/j.immuni.2016.08.016 (2016). [DOI] [PMC free article] [PubMed] [Google Scholar]
- 30.Kulp DW et al. Structure-based design of native-like HIV-1 envelope trimers to silence non-neutralizing epitopes and eliminate CD4 binding. Nature Communications 8, 1655, doi: 10.1038/s41467-017-01549-6 (2017). [DOI] [PMC free article] [PubMed] [Google Scholar]
- 31.Yang L et al. Structure-Guided Redesign Improves NFL HIV Env Trimer Integrity and Identifies an Inter-Protomer Disulfide Permitting Post-Expression Cleavage. Frontiers in Immunology 9, 1631 (2018). [DOI] [PMC free article] [PubMed] [Google Scholar]
- 32.Sharma SK et al. Cleavage-independent HIV-1 Env trimers engineered as soluble native spike mimetics for vaccine design. Cell reports 11, 539–550, doi: 10.1016/j.celrep.2015.03.047 (2015). [DOI] [PMC free article] [PubMed] [Google Scholar]
- 33.Guenaga J et al. Structure-Guided Redesign Increases the Propensity of HIV Env To Generate Highly Stable Soluble Trimers. Journal of Virology 90, 2806, doi: 10.1128/JVI.02652-15 (2016). [DOI] [PMC free article] [PubMed] [Google Scholar]
- 34.Sliepen K et al. Structure and immunogenicity of a stabilized HIV-1 envelope trimer based on a group-M consensus sequence. Nature communications 10, 2355–2355, doi: 10.1038/s41467-019-10262-5 (2019). [DOI] [PMC free article] [PubMed] [Google Scholar]
- 35.Korber B et al. Spike mutation pipeline reveals the emergence of a more transmissible form of SARS-CoV-2. bioRxiv, 2020.2004.2029.069054, doi: 10.1101/2020.04.29.069054 (2020). [DOI] [Google Scholar]
- 36.Barnes CO et al. Structures of human antibodies bound to SARS-CoV-2 spike reveal common epitopes and recurrent features of antibodies. Cell, doi: 10.1016/j.cell.2020.06.025 (2020). [DOI] [PMC free article] [PubMed] [Google Scholar]
- 37.Cai Y et al. Distinct conformational states of SARS-CoV-2 spike protein. bioRxiv, 2020.2005.2016.099317, doi: 10.1101/2020.05.16.099317 (2020). [DOI] [PMC free article] [PubMed] [Google Scholar]
- 38.Turoňová B et al. In situ structural analysis of SARS-CoV-2 spike reveals flexibility mediated by three hinges. bioRxiv, 2020.2006.2026.173476, doi: 10.1101/2020.06.26.173476 (2020). [DOI] [PMC free article] [PubMed] [Google Scholar]
- 39.Zost SJ et al. Rapid isolation and profiling of a diverse panel of human monoclonal antibodies targeting the SARS-CoV-2 spike protein. bioRxiv, 2020.2005.2012.091462, doi: 10.1101/2020.05.12.091462 (2020). [DOI] [PMC free article] [PubMed] [Google Scholar]
- 40.Brouwer PJM et al. Potent neutralizing antibodies from COVID-19 patients define multiple targets of vulnerability. bioRxiv, 2020.2005.2012.088716, doi: 10.1101/2020.05.12.088716 (2020). [DOI] [PMC free article] [PubMed] [Google Scholar]
- 41.Pinto D et al. Cross-neutralization of SARS-CoV-2 by a human monoclonal SARS-CoV antibody. Nature, doi: 10.1038/s41586-020-2349-y (2020). [DOI] [PubMed] [Google Scholar]
- 42.Wang L et al. Importance of Neutralizing Monoclonal Antibodies Targeting Multiple Antigenic Sites on the Middle East Respiratory Syndrome Coronavirus Spike Glycoprotein To Avoid Neutralization Escape. Journal of virology 92, e02002–02017, doi: 10.1128/JVI.02002-17 (2018). [DOI] [PMC free article] [PubMed] [Google Scholar]
- 43.Hsieh C-L et al. Structure-based Design of Prefusion-stabilized SARS-CoV-2 Spikes. bioRxiv, 2020.2005.2030.125484, doi: 10.1101/2020.05.30.125484 (2020). [DOI] [PMC free article] [PubMed] [Google Scholar]
- 44.Humphrey W, Dalke A & Schulten K VMD: Visual molecular dynamics. Journal of Molecular Graphics 14, 33–38, doi: 10.1016/0263-7855(96)00018-5 (1996). [DOI] [PubMed] [Google Scholar]
- 45.Team, R. C. R: A Language and Environment for Statistical Computing. (2017).
- 46.Schrödinger Release 2020–1: Maestro (Schrödinger, LLC, New York, NY, 2020). [Google Scholar]
- 47.Scheres SHW in Methods in Enzymology Vol. 579 (ed Crowther RA) 125–157 (Academic Press, 2016).27572726 [Google Scholar]
- 48.Suloway C et al. Automated molecular microscopy: the new Leginon system. J Struct Biol 151, 41–60, doi: 10.1016/j.jsb.2005.03.010 (2005). [DOI] [PubMed] [Google Scholar]
- 49.Zheng SQ et al. MotionCor2: anisotropic correction of beam-induced motion for improved cryo-electron microscopy. Nat Methods 14, 331–332, doi: 10.1038/nmeth.4193 (2017). [DOI] [PMC free article] [PubMed] [Google Scholar]
- 50.Punjani A, Rubinstein JL, Fleet DJ & Brubaker MA cryoSPARC: algorithms for rapid unsupervised cryo-EM structure determination. Nat Methods 14, 290–296, doi: 10.1038/nmeth.4169 (2017). [DOI] [PubMed] [Google Scholar]
- 51.Pettersen EF et al. UCSF Chimera—A visualization system for exploratory research and analysis. Journal of Computational Chemistry 25, 1605–1612, doi: 10.1002/jcc.20084 (2004). [DOI] [PubMed] [Google Scholar]
- 52.Schrodinger L The PyMOL Molecular Graphics System. (2015).
- 53.- Features and development of Coot. - Acta crystallographica. Section D, Biological crystallography - 66, - 486–501, doi:- (2010). [DOI] [PMC free article] [PubMed] [Google Scholar]
- 54.Afonine PV et al. Real-space refinement in PHENIX for cryo-EM and crystallography. Acta Crystallographica Section D 74, 531–544, doi: 10.1107/S2059798318006551 (2018). [DOI] [PMC free article] [PubMed] [Google Scholar]
- 55.Goddard TD et al. UCSF ChimeraX: Meeting modern challenges in visualization and analysis. Protein Sci 27, 14–25, doi: 10.1002/pro.3235 (2018). [DOI] [PMC free article] [PubMed] [Google Scholar]
Associated Data
This section collects any data citations, data availability statements, or supplementary materials included in this article.
Supplementary Materials
Data Availability Statement
Cryo-EM reconstructions and atomic models were deposited in the EMDB and wwPDB with accession codes EMD-21997, EMD-21999, EMD-22000 and EMD-22001, and PDB 6X29, 6X2A, 6X2B and 6X2C. Source data for graphs are available in Supplementary Data 1.


