Abstract
Antibiotic-resistant bacterial infections cause more than 700,000 deaths each year worldwide. Detection of bacteria is critical in limiting infection-based damage. Nanomaterials provide promising sensing platforms owing to their ability to access new interaction modalities. Nanoclusters feature sizes smaller than traditional nanomaterials, providing great sensitive ability for detecting analytes. The distinct optical and catalytic properties of nanoclusters combined with their biocompatibility enables them as efficient biosensors. In this review, we summarize multiple strategies that utilize nanoclusters for detection of pathogenic bacteria.
1. Introduction
Bacterial infections cause more than a million illnesses and 20,000 deaths annually in the United States alone, costing $50–70 billion per year.1, 2 The rapid increase of bacterial infections require facile and cost-effective detection strategies.3–7 Current techniques to detect bacteria include polymerase chain reaction (PCR) and sequencing, which are costly and time-consuming.8–12 Optical and electrochemical detection methods using organic dyes and traditional nanoparticles (NPs) provide facile strategies for analysis of bacteria. However, these sensors are often associated with toxicity and low sensitivity, limiting their practical applications.13–19
When NPs are composed of a small number of atoms, the as-obtained materials are denoted as nanoclusters (NCs) (Figure 1).20 The size of NCs are normally < 2 nm. Significantly for both biomedical and environmental concerns, NCs show minimal organ retention and accumulation.21–23 The physiochemical and optoelectronic properties of NCs are significantly different from their larger counterpart (NPs).24–27 For instance, gold NCs (AuNCs) do not exhibit surface plasmon resonance (SPR) like traditional gold NPs (AuNPs).28 On the other hand, AuNPs do not exhibit fluorescence, unlike many of their smaller AuNC counterparts. These optical differences are caused by many factors such as the quantum confinement effect, discrete energy levels, ligand-to-metal and metal-to-metal charge transfer, the synergistic effect between the protection ligand and the metal core, and additional mechanisms that are still under investigation.29–32 Another important property possessed by NCs is their enhanced catalytic activity compared to NPs.33–39 The catalytic properties of metal catalysts are influenced by the size of particles. For instance, small size palladium NCs (PdNCs) are more active than the larger palladium NPs (PdNPs).40 These special properties of NCs facilitate their biosensing applications,41–46 such as the detection of bacteria.47–49
Figure 1.
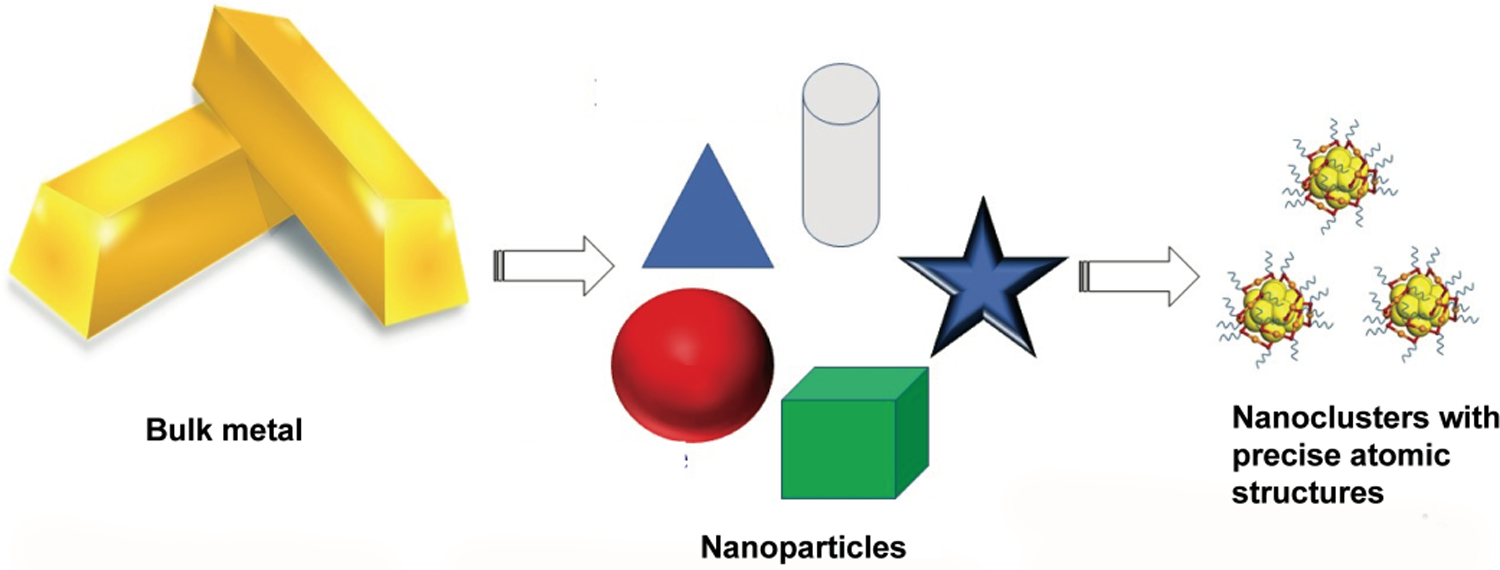
From bulk metal to atomic-precise NCs.
This review discusses current strategies using metal NCs (including gold, silver and copper (AuNCs, AgNCs, and CuNCs)) for the detection of bacteria. These sensor systems use a range of strategies to detect bacteria that are discussed in the course of this review (Figure 2). We also discuss future sensing trends using NCs, including their potential utility for theranostics.
Figure 2.
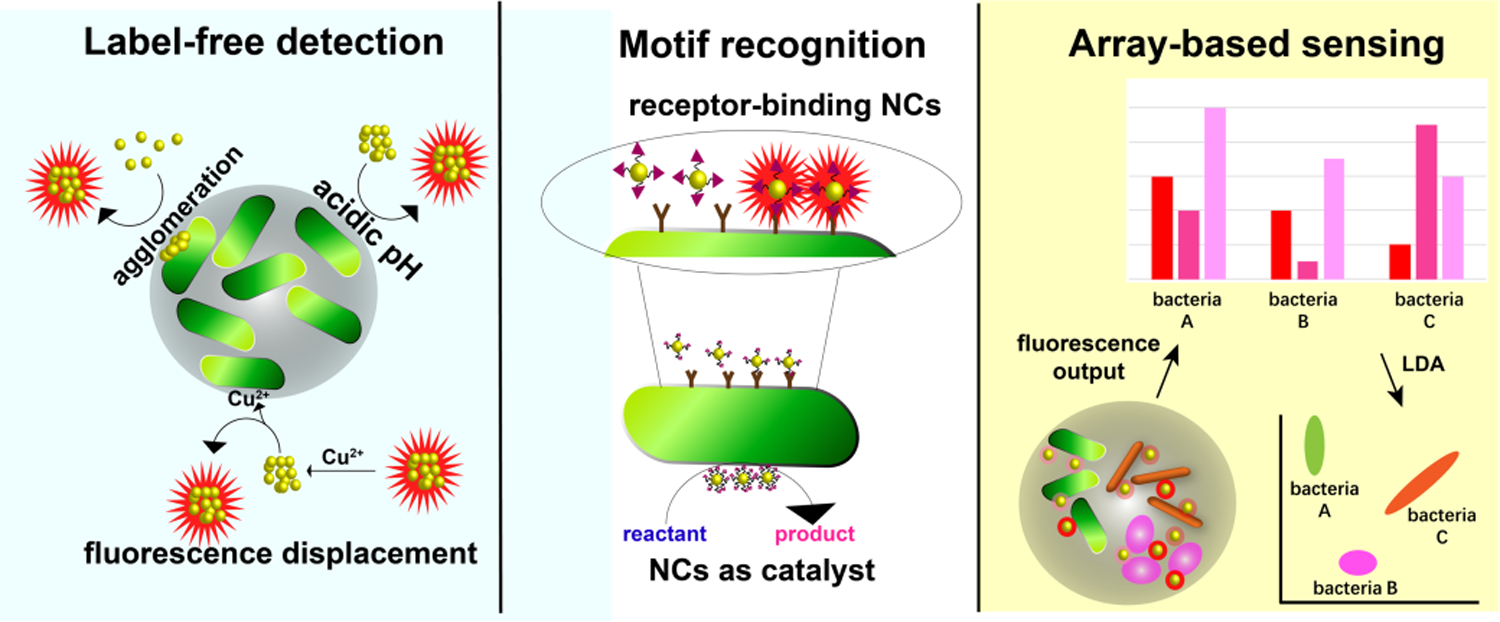
Overview of NCs-based bacterial sensing strategies.
2. Label-free detection of bacteria
2.1. Detection based on pH responsive behaviors
Bacteria can alter the pH value of the surrounding media.50 For example growth of E.coli causes acidification of the surrounding media.51 By means of this phenomenon, the concentration of E. coli was monitored using pH sensitive NCs. Xiong et al designed a pH monitoring system by the combination of dihydrolipoic acid protected AgNCs (DHLA-AgNCs) with agarose-LB (Luria-Bertani medium) hydrogels (Figure 3). The DHLA-AgNC-doped agarose hydrogels show brighter red emission with increasing pH value (Figure 3A, 3C). The red emission concomitantly decreases with increasing concentration of bacteria (Figure 3B). The weakest emission indicates the fully-grown colony of E. coli i.e the most acidic environment. Sensing by pH provides a rapid output, however, this approach is susceptible to environmental interference.
Figure 3.
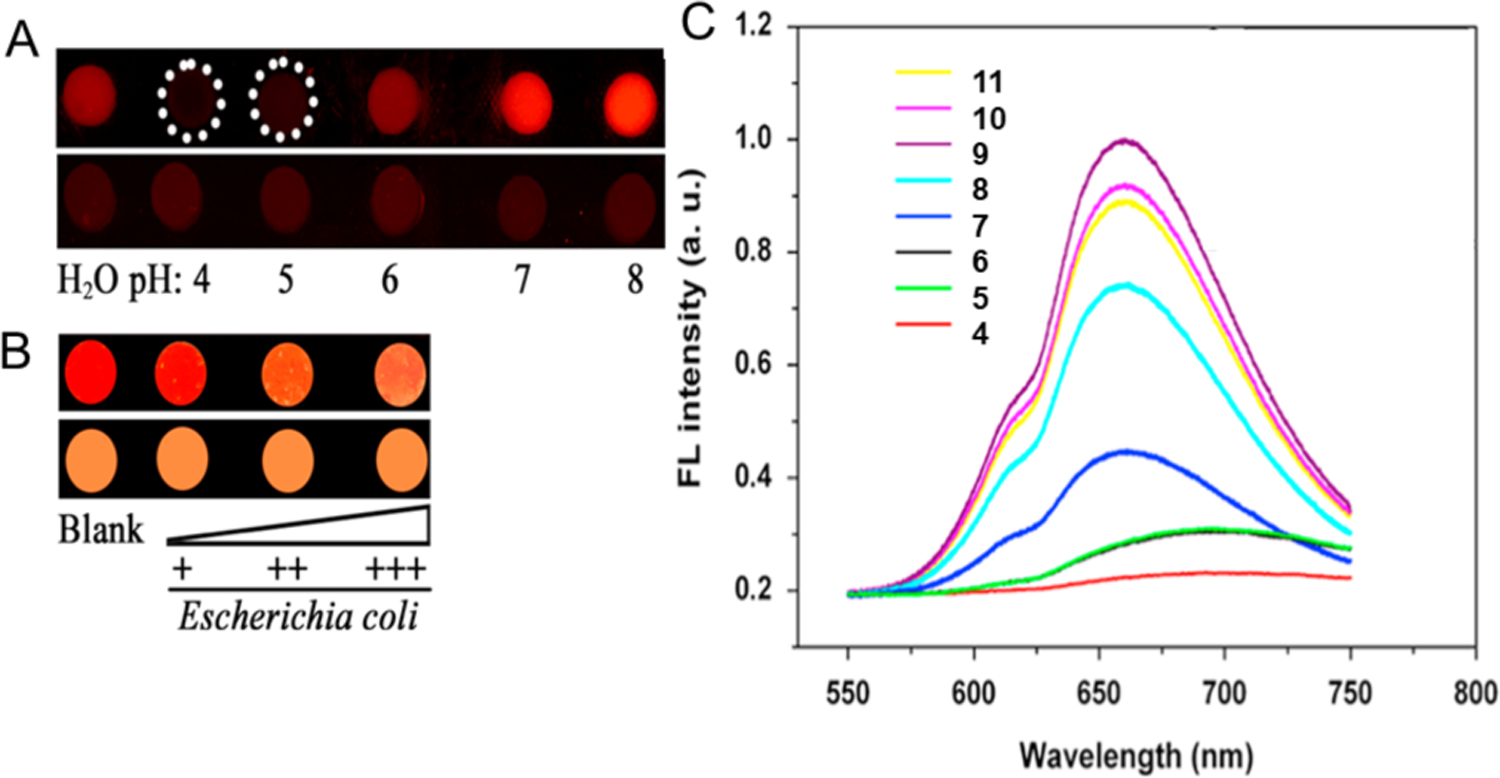
(A) Fluorescence probes for pH using DHLA-AgNCs-doped agarose hydrogels (upper) and agarose hydrogels (lower) under UV-light irradiation. (B) Monitoring of bacterial growth using DHLA-AgNCs-doped agarose-LB hydrogels (upper) and LB solid medium (lower) under UV light irradiation. (C) Fluorescence emission spectra of AgNCs at different pH values (excitation at 432 nm). Adapted with permission from ref.52 Copyright 2016 Elsevier Ltd.
2.2. Agglomeration
Alteration of the optical behavior of NCs can occur through their interaction with bacterial cells. For instance, AuAgNCs are quenched by A. baumannii due to agglomeration (Figure 4).53 This mechanism facilitates a facile route (ca. 40 minutes) to detect A. baumannii with a detection limit of 2.3 × 10³ colony-forming unit (CFU)/mL. The intensity of the fluorescence decreased with increasing concentrations of A. baumannii from 1 × 10⁴ to 5 × 10⁷ CFU /mL and was almost completely quenched at 1 × 10¹⁰ CFU/mL (Figure 4B, C). The TEM (Figure 4D) for AuAgNCs after interaction with A. baumannii shows 30–200 nm size aggregates while no large size particles are observed for the A. baumannii-free micrograph.54 Aggregation-induced quenching provides a promising transduction strategy for sensing of bacteria when integrated with effective and selective recognition processes.
Figure 4.
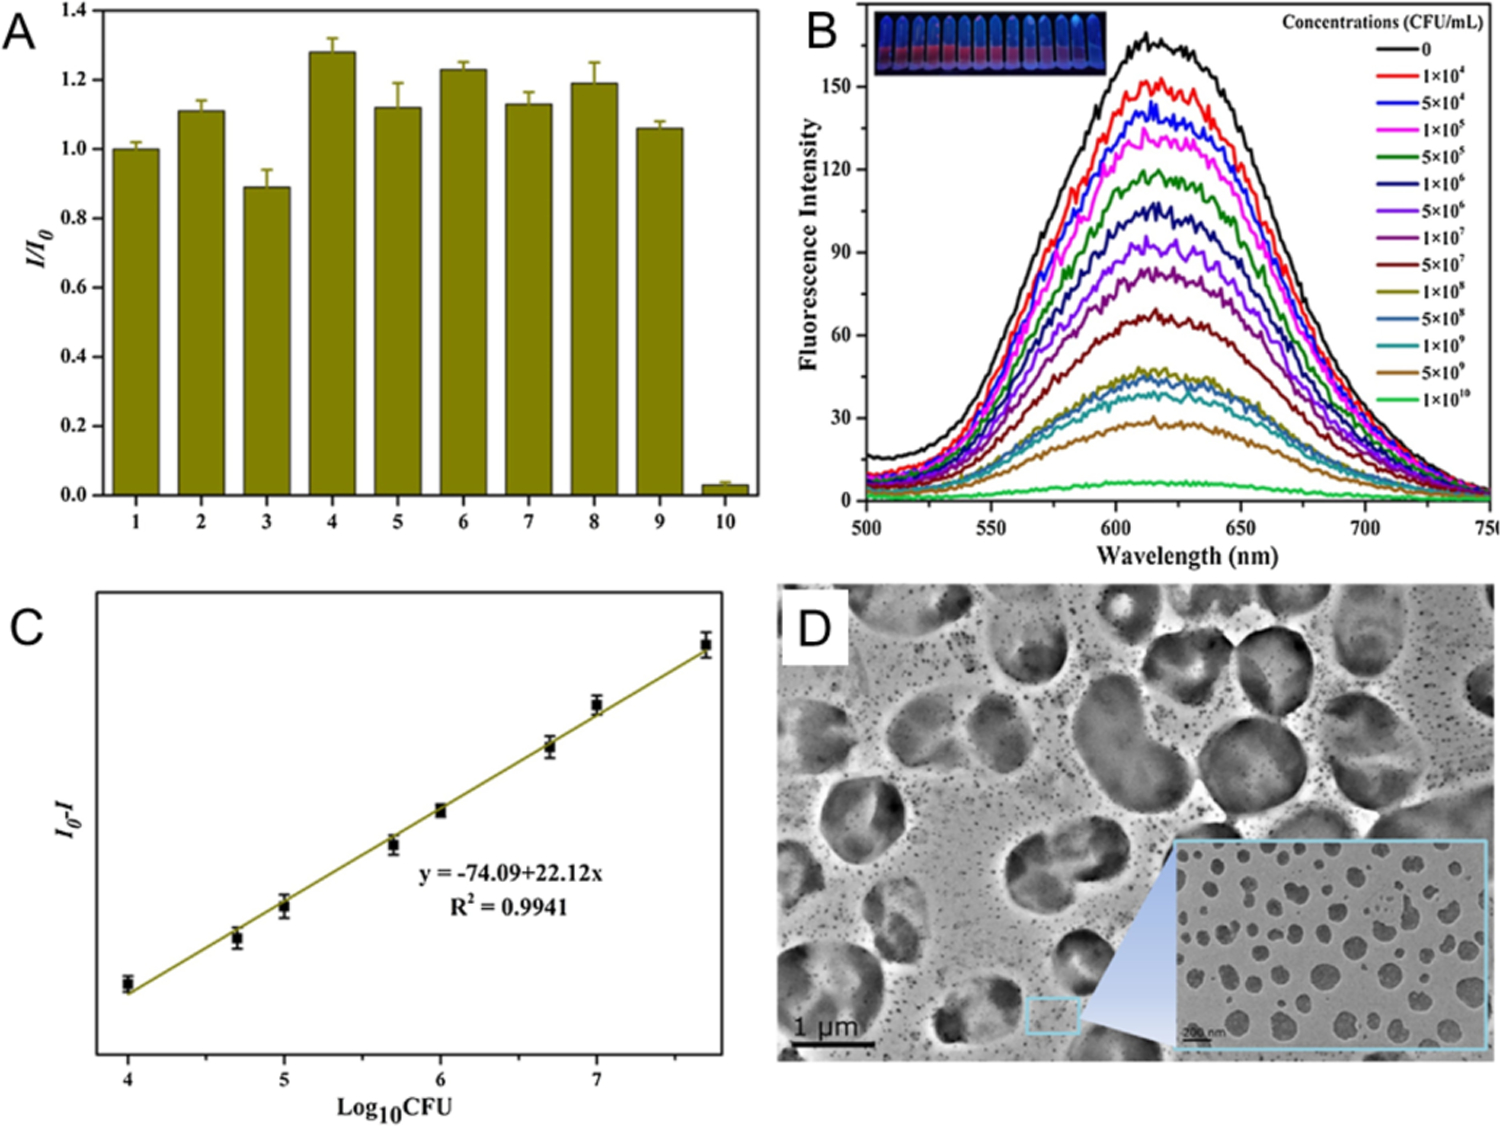
Highly fluorescent AuAgNCs recognizes A. baumannii with high selectivity and sensitivity. (A) The fluorescence of AuAgNCs was quenched by A. baumannii but not by other strains. The numbers 1–10 represent control, B. mycoides, S. aureus, MRSA, C. albicans, P. aeruginosa, E. coli, VRE, S. cerevisiae, and A. baumannii, respectively. (B) The quenching of AuAgNCs in different concentration of A. baumannii. Insets: Photos of A. baumannii treated with AuAgNCs under UV light. (C) Relative fluorescence intensity (I0-I) of AuAgNCs as a function of the logarithm of the A. baumannii concentration. (D) The TEM image of AuAgNCs treated with 1 × 10⁵ CFU/mL of A. baumannii. Adapted with permission from ref.53 Copyright 2016 Elsevier Ltd.
2.3. Fluorescence recovery of metal ion-quenched NCs
Metal ions can bind with the components of bacterial cells; this binding can be used to provide a fluorescence displacement assay readout for bacteria. For instance, BSA-AuNCs were quenched by Cu2+ and formed BSA-AuNC-Cu2+ adducts (Figure 5). Bacteria are known to reduce Cu2+ by various mechanisms. In the presence of E. coli, Cu2+ is reduced to Cu+ possibly by Ndh-2 (a cupric reductase), NADH dehydrogenase and other unknown pathways.55–57 Cu+ can further diffuse through the cytoplasmic membrane. The reduction of Cu2+ and the removal of Cu+ results in the recovery of the fluorescence of BSA-AuNCs. Using this phenomenon, rapid detection of E. coli was achieved with a detection limit of 89 CFU/mL within 0.5 h. This on–off–on sensor can also screen multidrug-resistant bacteria in sepsis blood samples. However, the selectivity for specific bacteria is unknown. For instance, Cupriavidus sp. binds multiple metal ions including Cu2+, resembling the activity of E. coli.58
Figure 5.
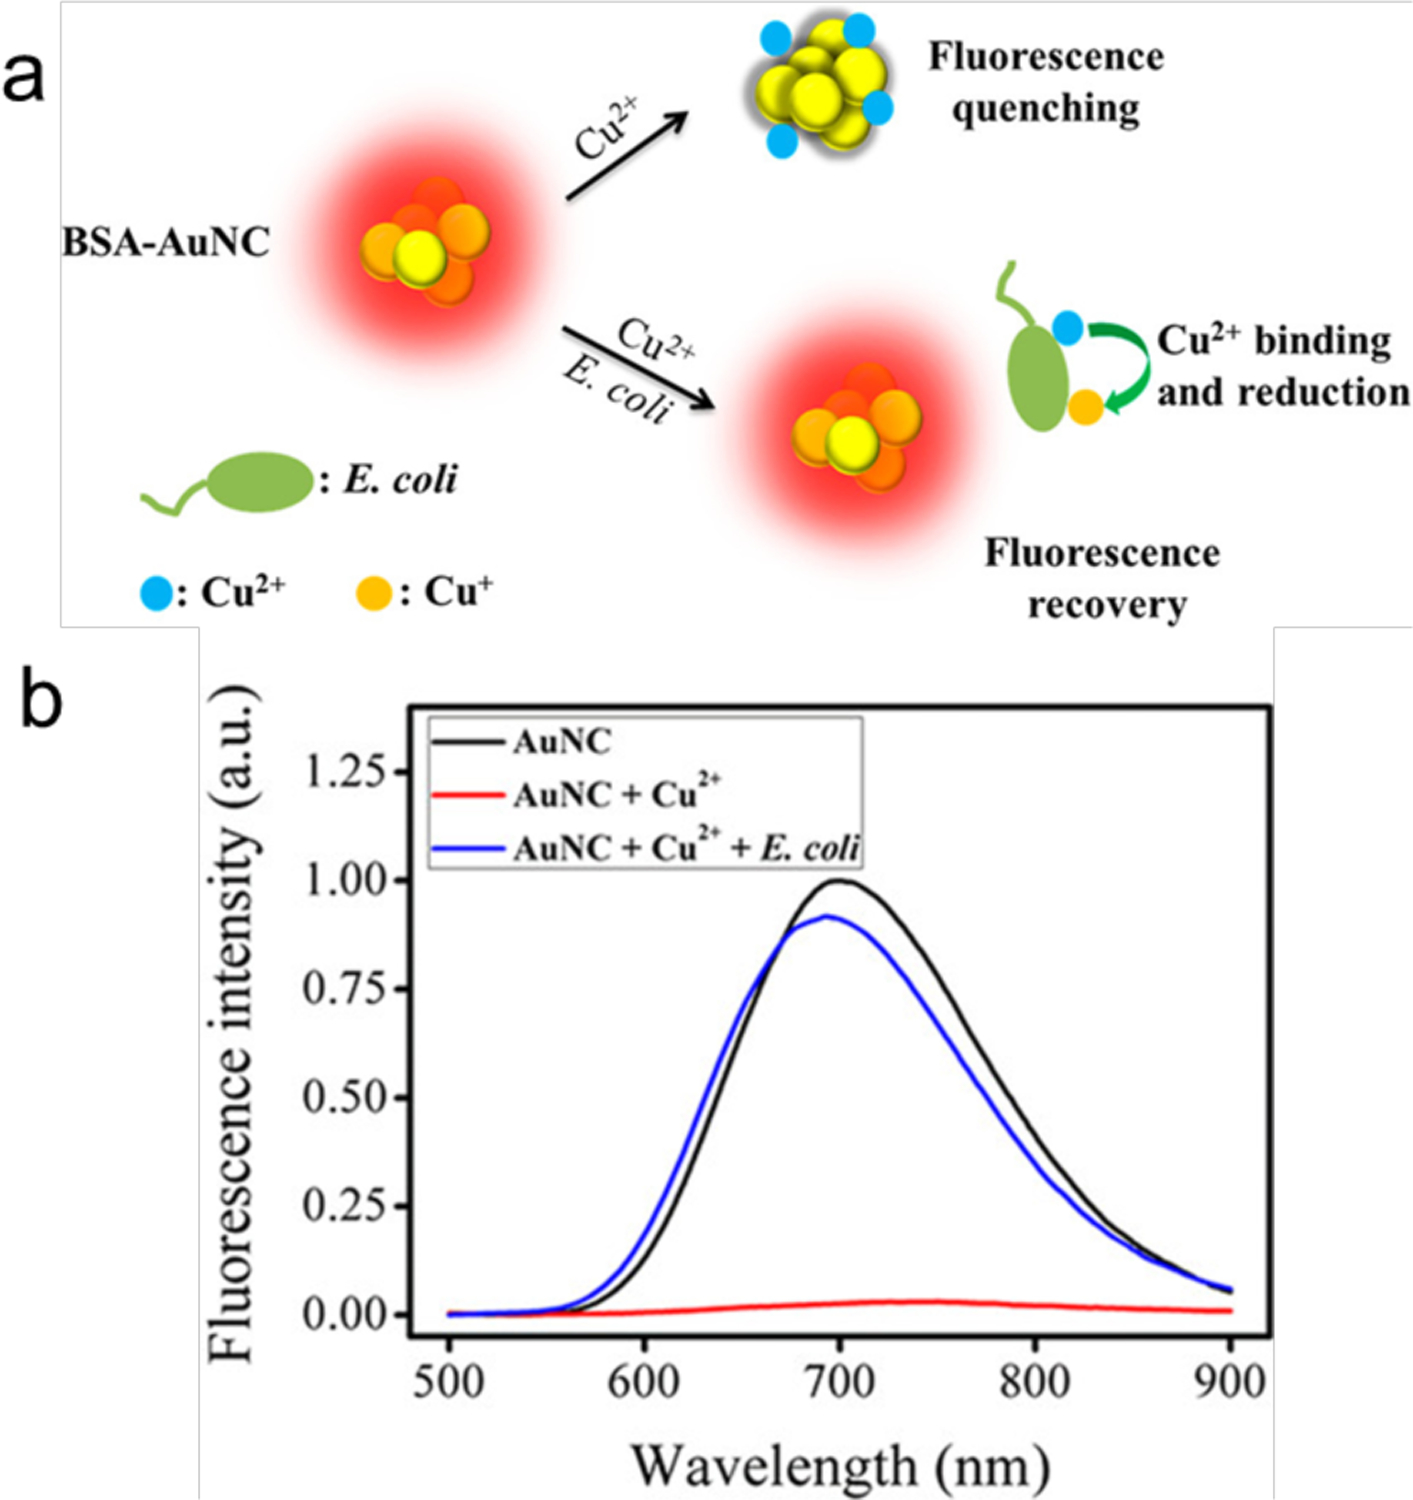
(a) Schematic illustration of the on-off-on AuNCs-based fluorescent probe for rapid E. coli detection. (b) Fluorescence emission spectra of AuNCs (1 μM) and AuNCs-Cu2+ ensemble (1 μM of AuNCs, 4 μM of Cu2+) with and without E. coli (106 CFU/mL) incubation. Reproduced from Ref.59 Copyright 2018 American Chemical Society.
3. Recognition through molecular motifs
3.1. Fluorescence sensing
3.1.1. Specific recognition strategies
3.1.1.1. Recognition of single receptors
NCs are smaller than many NPs60 and can penetrate the cell membrane easily.61, 62 Uptake of NCs by bacteria has been used for bacterial cell imaging, however, little selectivity is typically observed.41 After decorating the NCs with elements that recognize receptors on bacterial cells, selectivity and uptake efficiency can be significantly improved. For instance, E. coli contains acyl homoserine lactone (AHL) receptors. Mukherji et al decorated AuNCs with AHL signal molecules that could recognize the Lux-R regulators within 2 h (Figure 6).63 This functionalization allows differentiation of E. coli from S. aureus (106 cells/mL) suspensions that do not contain this receptor.
Figure 6.
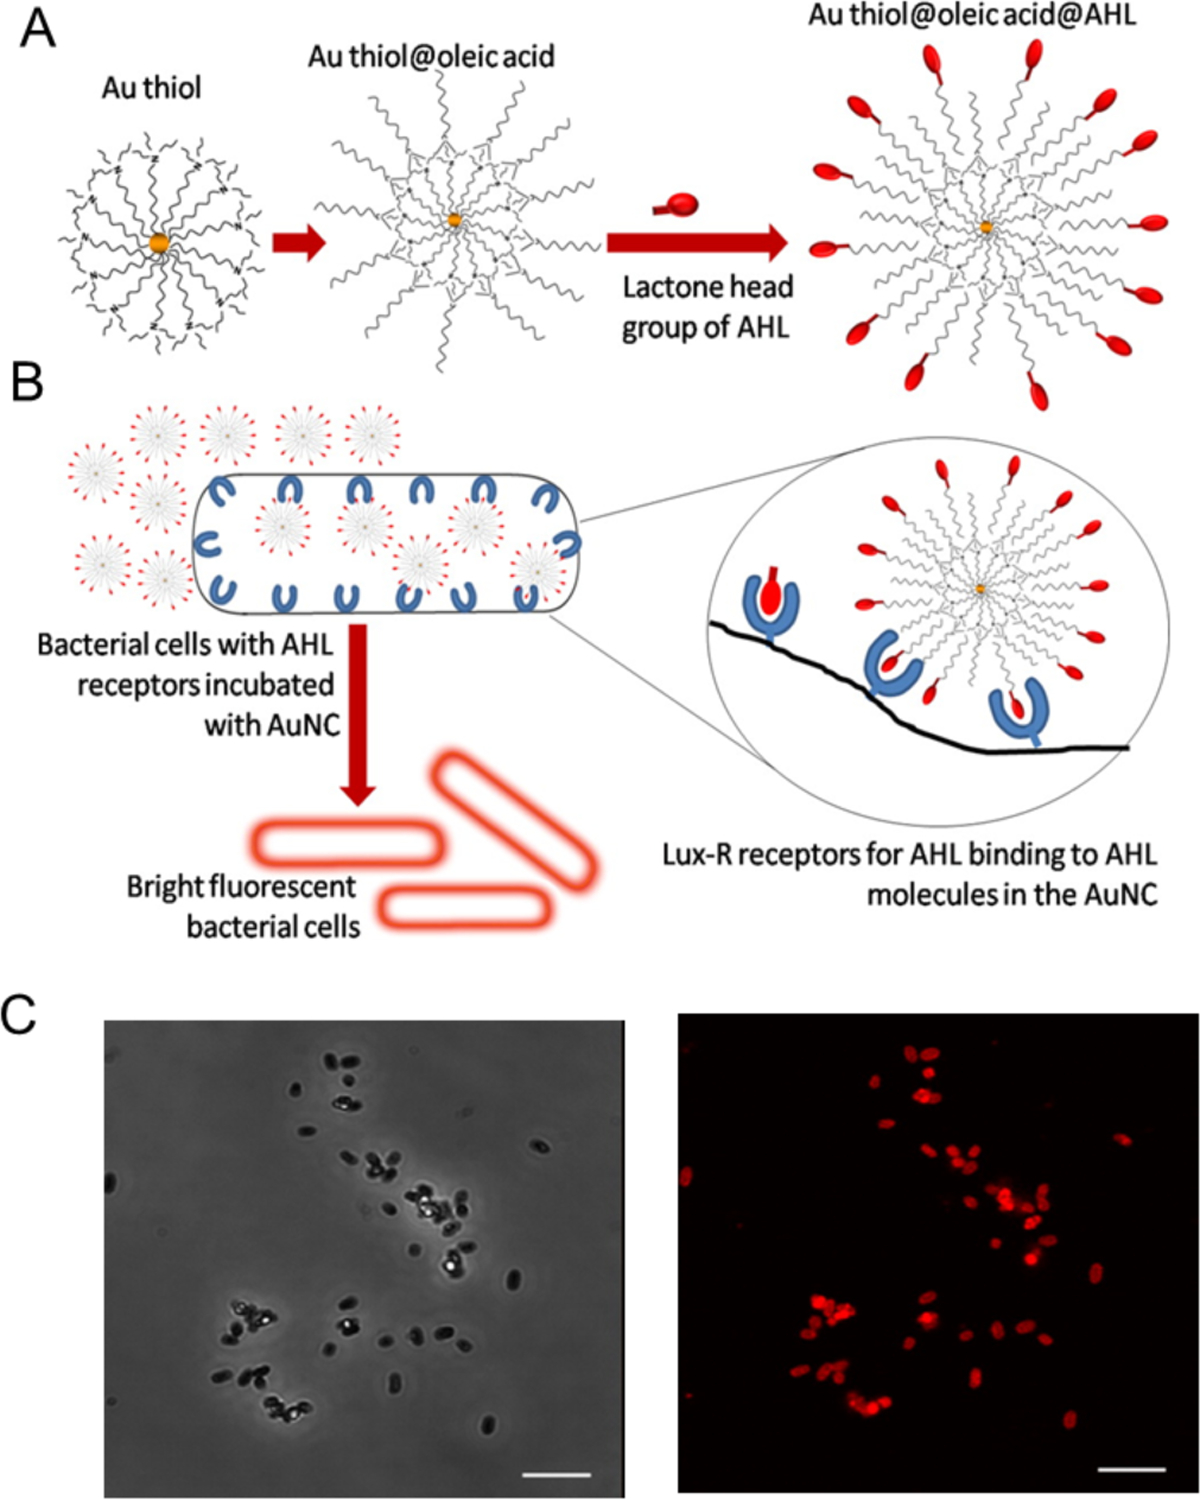
Fabrication of fluorescent probes for bacterial cells: (A) Structure of the probe with AHL signal molecules deployed on the surface with lactone and amide moieties intact and (B) Specific binding of AHL head groups to receptor sites in Lux-R regulators with bacteria. (C) Confocal microscopy images of E. coli incubated with Au@OA@C8-AHL (AuNC probe functionalized with AHL signal molecules): (top) phase contrast image and (bottom) fluorescence image of the same region. Scale bar is 5 μm. Reproduced from ref.63 with permission from The Royal Society of Chemistry.
Further studies used highly fluorescent bovine serum albumin (BSA) protected AuNCs (quantum yield, 14%) functionalized with human anti-staphylococcal immunoglobulin (antiSAlgG) for specific imaging of S.aureus through fluorescence microscopy. The imaging of S. aureus can even be observed by naked eye under UV.64 The studies were performed at physiological pH 7, showing an enhanced selectivity relative to nonspecific electrostatic binding of Au–human serum albumin NCs to S. aureus. In contrast to slow non-specific bacterial cell imaging by GSH-AuNCs (culture time, 24 hours), these specific AuNCs decorated with recognition element can be used for rapid imaging (< 2 h).65
3.1.1.2. Selective NC aggregation on bacterial cell wall
Enzymes such as lysozyme can recognize bacteria by binding to their membrane.60, 66 For instance, the cell wall of E. coli contains a layer of peptidoglycan that is a specific site targeted by lysozyme. Lysozyme-protected AuNCs (Lysozyme-AuNCs) have recognition capabilities similar to lysozyme.67–69 The Lysozyme-AuNCs (used as a fluorescent label) can attach to E. coli, providing turn-on fluorescence (Figure 7).70 The fluorescence intensity of lysozyme-AuNCs changes linearly over the range of 2.4×10⁴ – 6.0×10⁶ CFU/mL with the limit of detection 2.0×10⁴ CFU/mL for E. coli. The sensing time is about 5 minutes. This approach should be generalizable, and NCs protected with other cell wall recognition templates could also be employed to label and detect bacteria.
Figure 7.
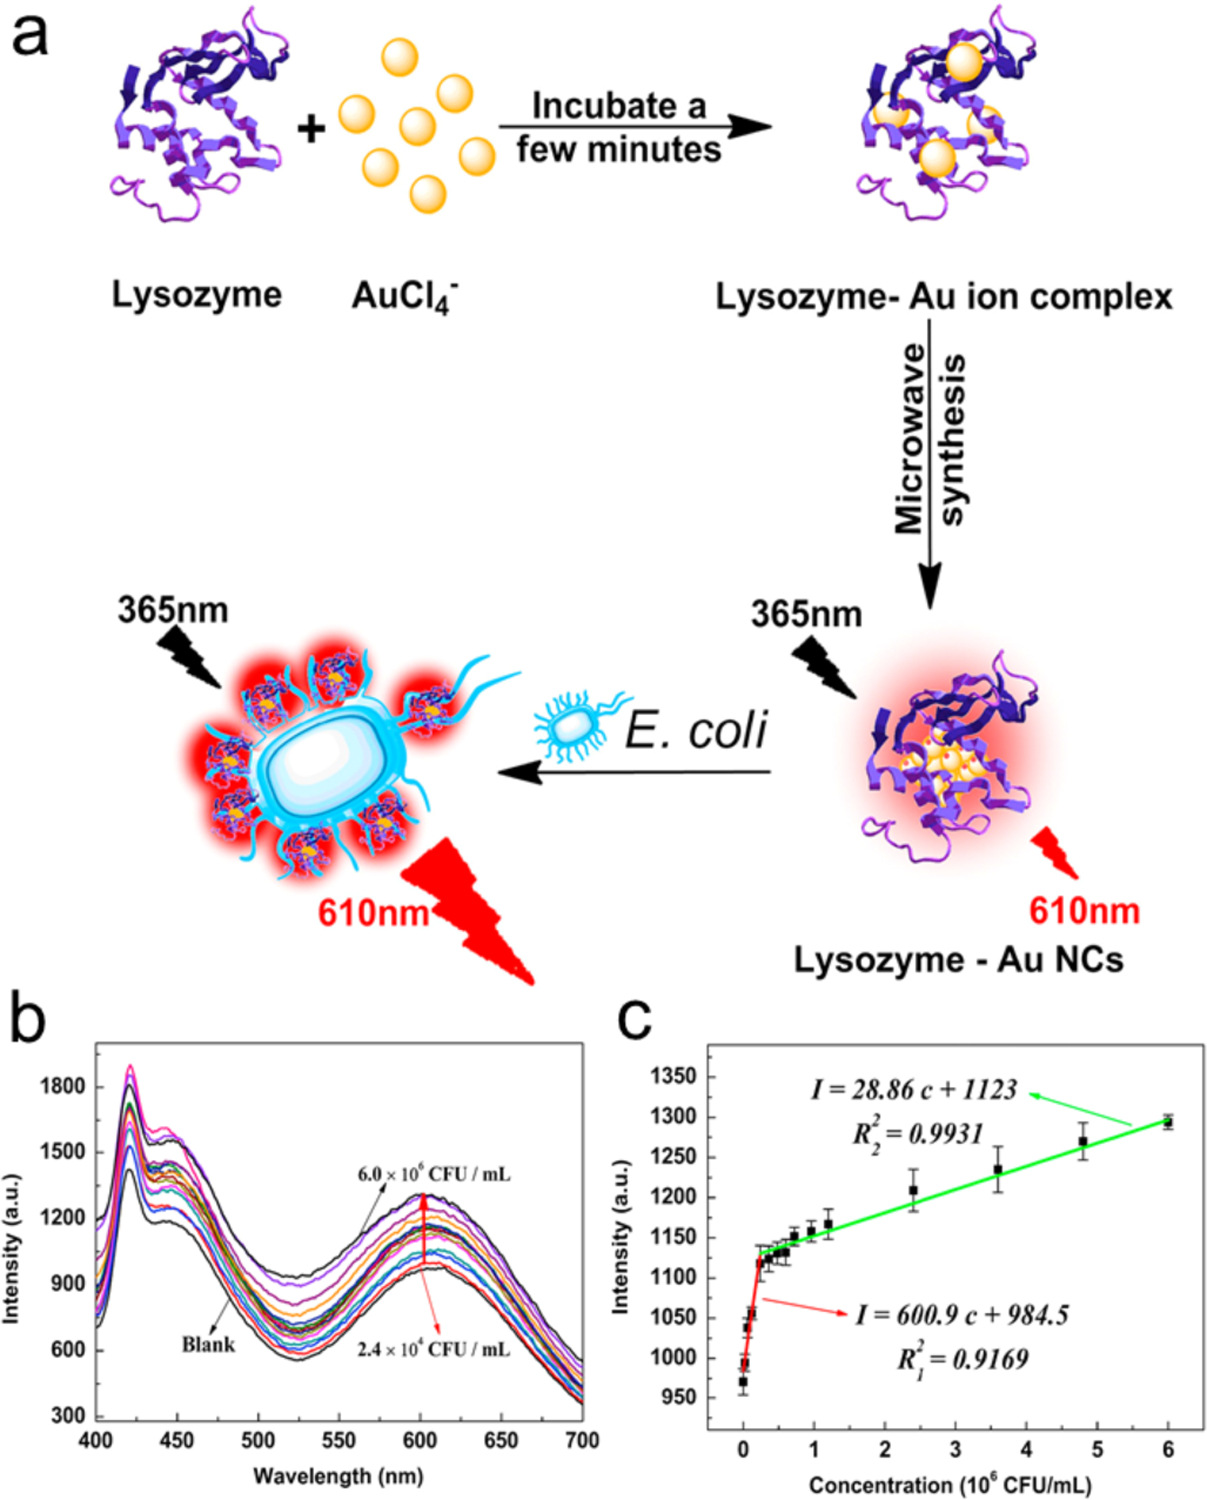
(a) Synthesis of the red-emitting lysozyme-AuNCs and fluorescence enhancement for the analysis of E. coli. (b) Evolution of fluorescence spectra of lysozyme-AuNCs with varying E. coli concentrations. (c) The calibration plots of red fluorescence intensity vs E. coli concentrations, λex/λem=365 nm/610 nm. Adapted with permission from ref.69 Copyright 2015 Elsevier Ltd.
3.1.2. Dual recognition strategies
3.1.2.1. Magnetic enrichment
In magnetic enrichment methods, the analyte is attached to magnet beads (MB) and enriched by pulling down the beads using magnetic fields. Cheng et al developed a strategy for detection of S. aureus by combining two recognition molecules: a DNA aptamer and vancomycin (Van) (Figure 8).71 The vancomycin-protected AuNCs (AuNCs@Van) bind onto the terminal residues (d-alanyl-d-alanine) of N-acetylmuramic acid and N-acetylglucosamine peptide subunits of S. aureus. The aptamer-MB specifically separates S. aureus by binding with the aptamer in the presence of magnetic field. The sandwiched structure is constructed by AuNCs@Van, S. aureus and aptamer-MB (after incubation at 37 °C for 3 h). Enhanced fluorescence is obtained by the enrichment of NCs in the sandwich structure, which increases as a function of the concentration of bacteria. The detection limit for S. aureus is 70 CFU/mL and the detection range is 99.8–103.3% with a standard deviation from 0.3 to 3.8%. This system using other bacteria species exhibits negligible enhancement in fluorescence intensity, demonstrating excellent selectivity.
Figure 8.
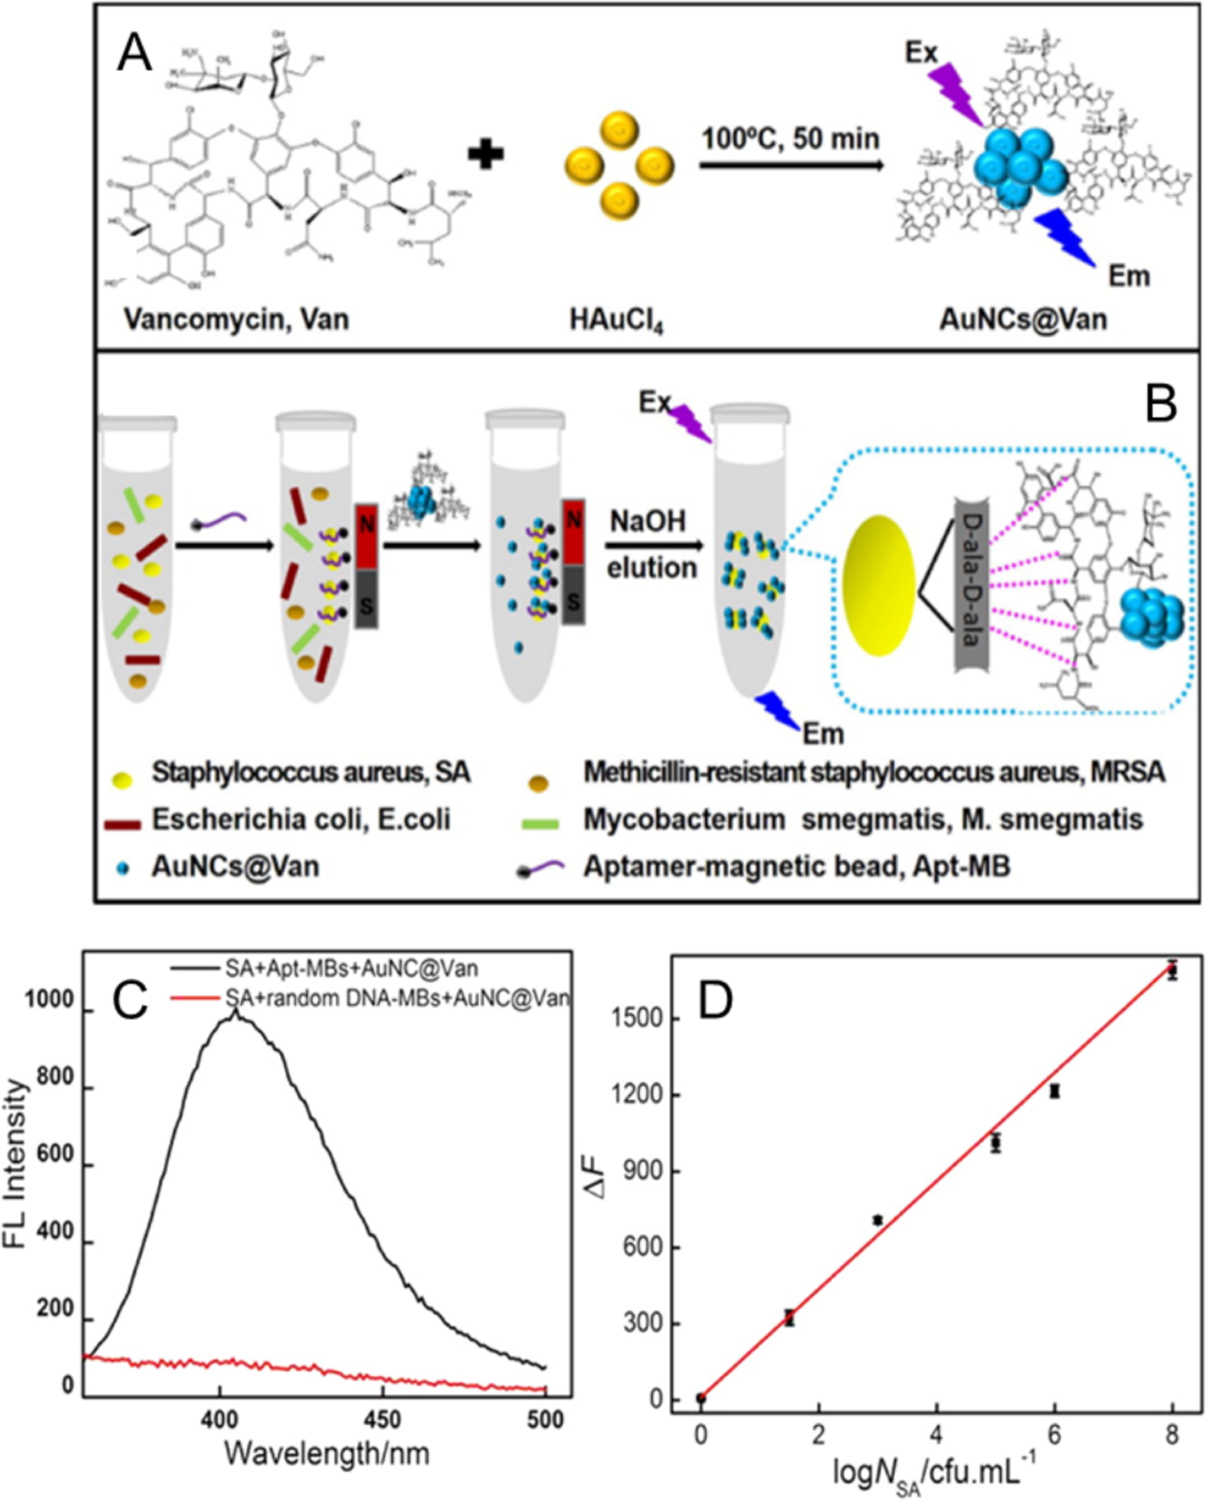
(A) Schematic illustrations of the preparation of AuNCs@Van, (B) and determination of S.aureus in mixtures using the aptamer-MB and AuNCs@Van dual recognition strategy. (C) Fluorescence spectra of detected S. aureus with aptamer-MBs or random DNA-MBs and AuNCs@Van. (D) The linear regression curve of the enhanced fluorescence intensity (ΔF, at 412 nm) vs. the concentration of S. aureus (log NSA/CFU mL−1). Reproduced from Ref.71 Copyright 2016 American Chemical Society.
In another study, nanocapsules with antibody-modified AuNCs embedded in chitosan (AuNCs@CS) and immunomagnetic nanoparticles were used to specifically recognize E. coli O157: H7 (Figure 9).72 After separation by magnetic fields, E. coli O157: H7 were isolated attached to the immunomagnetic nanoparticles and quantified by changes in fluorescence intensity of the AuNCs@CS linked to cells. Compared to traditional independent AuNC immunoassays, the AuNCs@CS nanocapsules amplified the fluorescence signal due to an increased number of fluorescent AuNCs binding to the E. coli O157:H7 cell (Figure 9b). The fluorescence intensity increases as a function of E. coli O157:H7 concentration. The magnetic separation captures 100% of E. coli O157:H7. The detection limit is 1 CFU/mL and the assay only requires 60 min. It is noteworthy that these dual-recognition strategies should all exhibit high sensitivity, selectivity and accuracy for detecting bacteria.
Figure 9.
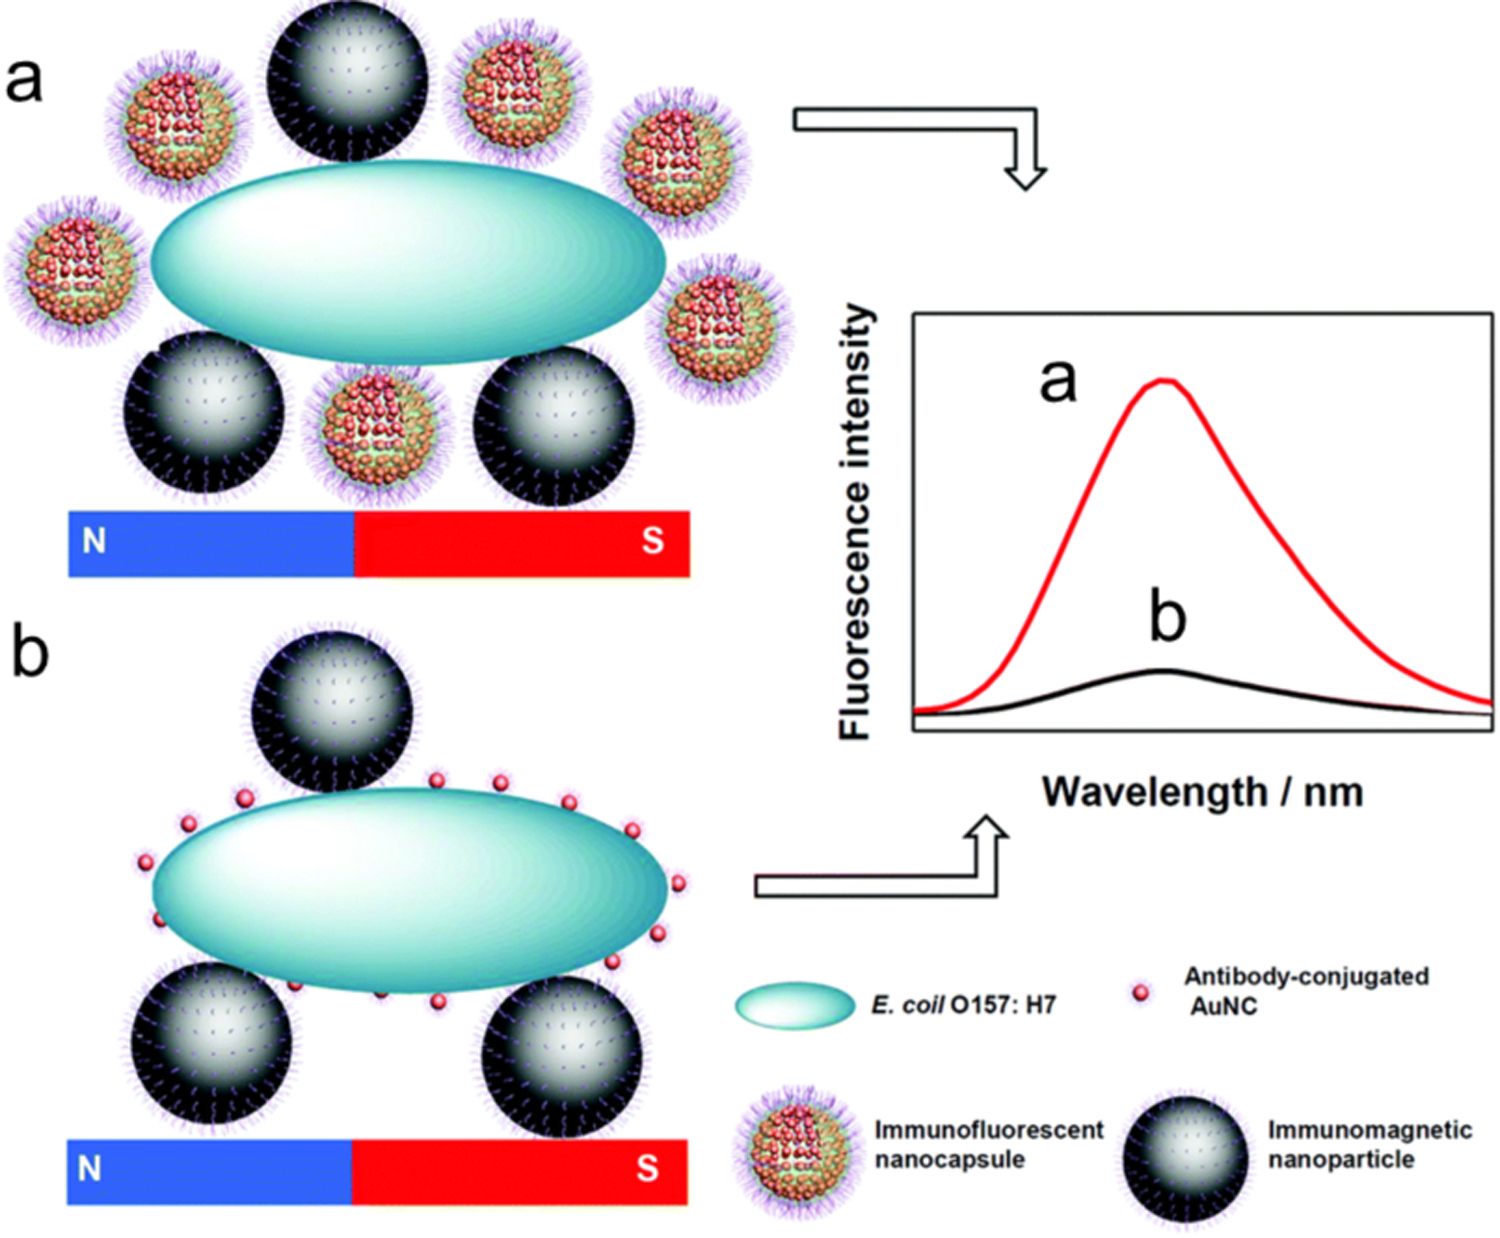
Illustration of the immunoassay of E. coli O157:H7 using (a) AuNCs@CS nanocapsules and (b) independent AuNCs as labels. Reproduced with permission from ref.72 Copyright 2018 The Royal Society of Chemistry.
3.1.2.2. Fluorescence resonance energy transfer
Fluorescence resonance energy transfer (FRET) refers to an energy transfer process between fluorophore donors (accept photons and transfer energy) and acceptors. The optical properties of both donor and acceptor may change in the presence of analytes,73,74 which can be used to generate two or more signal channels or enhanced sensitivity. The FRET mechanism has been employed for detection of bacteria based on the application of NCs. For instance, S. aureus was detected by means of energy transfer from fluorescent AuNCs to non-fluorescent AuNPs (Figure 10).75 In this sensing process, vancomycin-functionalized AuNCs act as a donor while the aptamer modified AuNPs serve as an acceptor. In the presence of S. aureus, the two moieties come in close proximity and the emission of the donor significantly changes due to FRET.76 Using this strategy S. aureus (incubated at 37 °C for 30 min) was specifically quantified with a detection limit of 10 CFU/mL, demonstrating the potential benefits of FRET-based methods.
Figure 10.
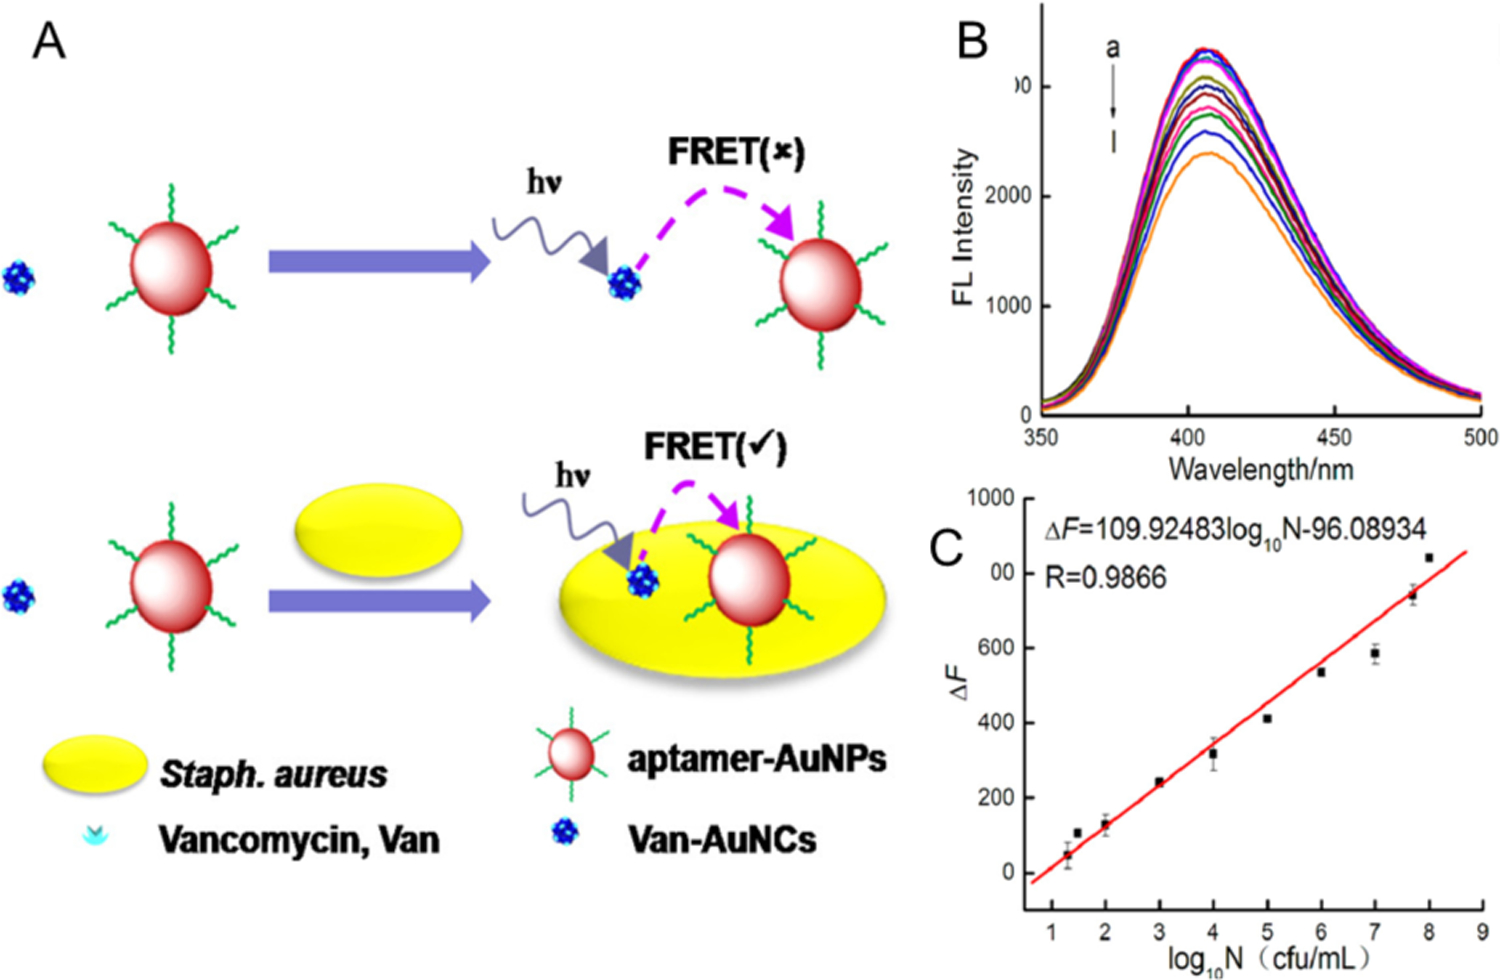
(A) Illustration of the vancomycin and aptamer dual-recognition FRET assay for detection of S. aureus) (B) Fluorescence spectra of the FRET biosensor in the presence of S. aureus at varying concentrations (curves a-l correspond to 0, 10, 20, 30, 102, 103, 104, 105, 106, 107, 5 × 10⁷ and 108 CFU/mL, respectively). (C) Calibration curve showing the linear relationship between fluorescence intensity and the logarithm of S. aureus concentration (log10N CFU/mL). Reproduced with permission from ref.75 Copyright 2018 American Chemical Society
3.2. Catalysis
Catalysts can be used to accelerate reduction/oxidation reactions,77 a strategy that has been applied to sensing. For instance, Huang et al developed a UV-assisted AuNC-chitosan composite sensor with an S. aureus specific aptamer.78 S. aureus was attached to the composite and catalyzed H2O2 decomposition to •OH radicals. 3,3,5,5-tetramethylbenzidine (TMB) was concomitantly oxidized to TMB (ox-TMB, blue color) by •OH radicals. The colorimetric readout of ox-TMB distinguishes S. aureus from other bacteria within 30 minutes. This method exhibits a detection limit of 1 × 10² CFU/mL. The catalytic activity of AuNCs is stable enough to resist 4 h of UV irradiation.
Another catalytic sensing strategy uses a nanoenzyme-triggered catalytic amplification strategy to detect L. monocytogenes based on AgNCs (Figure 11). The o-phenylenediamine (OPD) mediated aggregation of gold nanoparticles (GNPs) via NH-gold chemistry (Figure. 11a). In the absence of L. monocytogenes, no AgNCs can be captured by magnetic separation. GNPs, in contrast, were aggregated by the OPD (dark blue colour) indicator. L. monocytogenes could be captured by aptamer-modified magnetic beads and then recognized by immunoglobulin IgY-coated AgNCs (IgY-BSA-AgNCs) to form sandwich complexes. After magnetic separation, the AgNCs from the ‘sandwich’ catalyzed OPD conversion to oxidized OPD (ox-OPD). The colour of GNPs (red) were preserved because GNPs did not change with ox-OPD (Figure. 11b). The detection limit of this colorimetric sensor is 10 CFU/mL and the test time is ~30 minutes. providing excellent platform to monitor bacteria in complex system with little interference.
Figure 11.
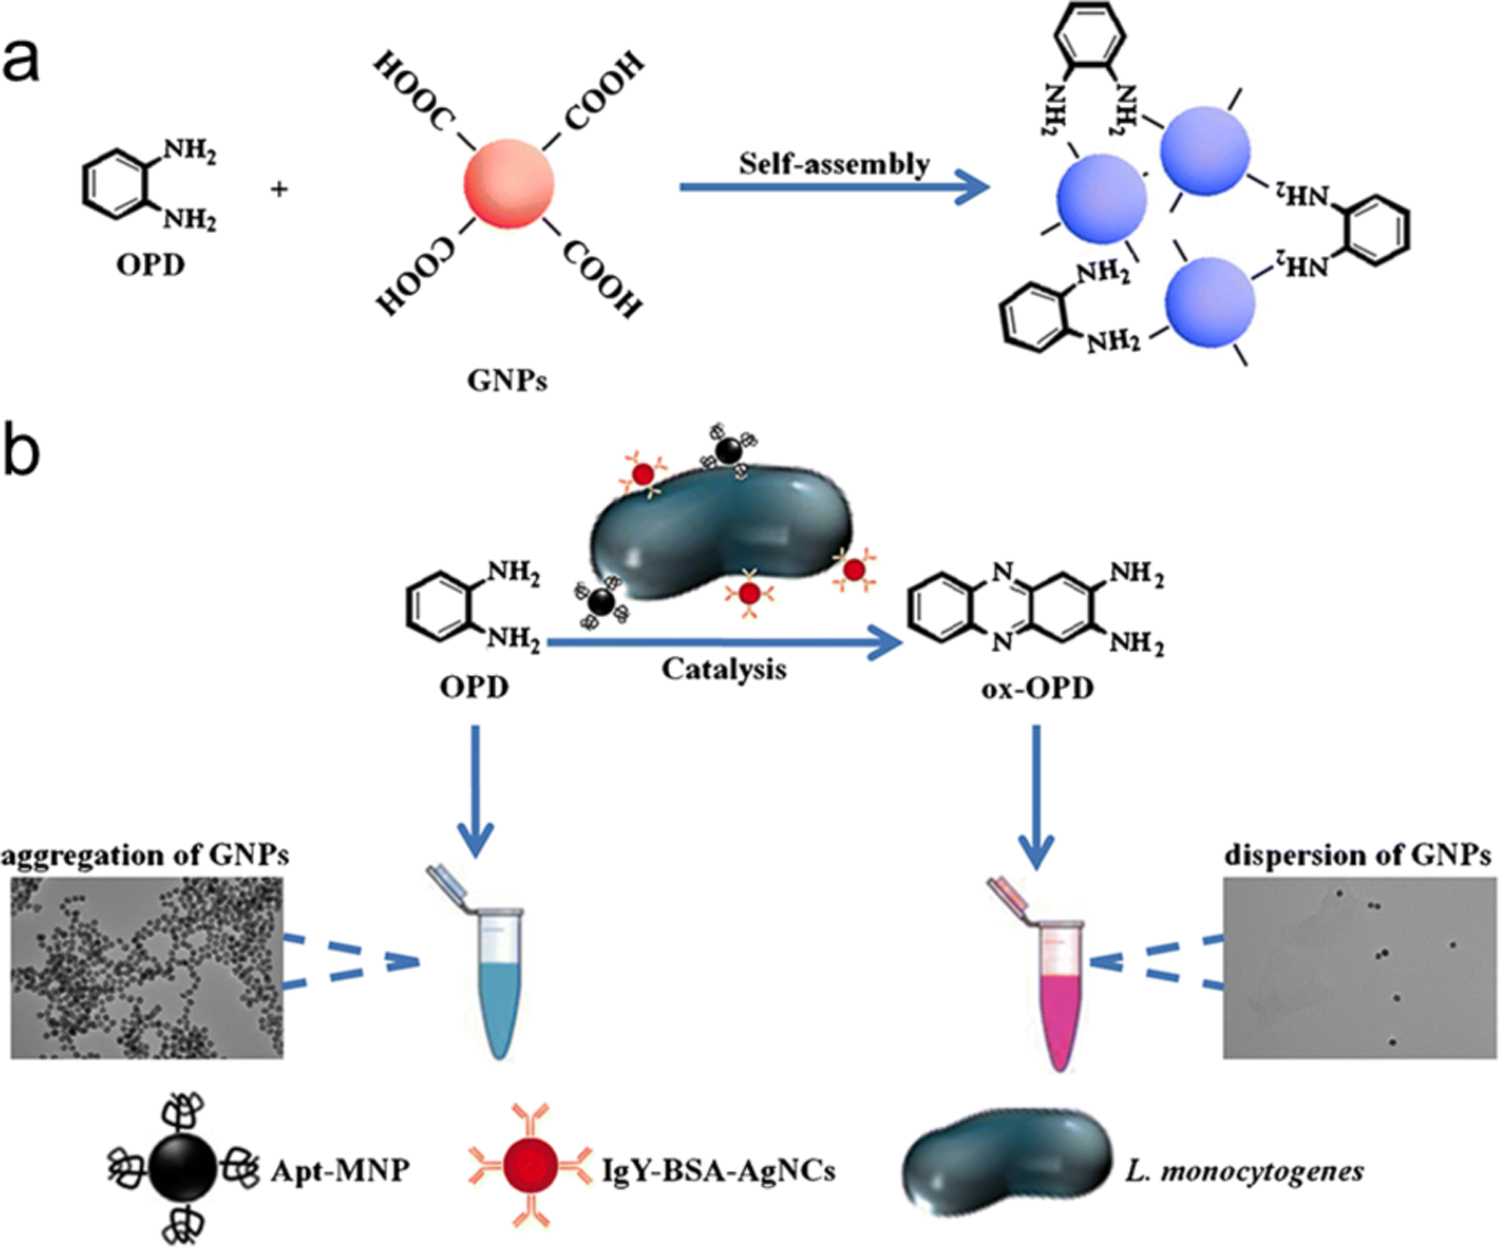
Schematic representation of the colorimetric detection of L. monocytogenes. (a) OPD causes the aggregation of AuNPs. (b) The IgY-BSA-AgNCs attached onto the sandwich-type immunocomplex for catalytic oxidization of OPD to produce ox-OPD. Adapted with permission from ref.34 Copyright 2018 Springer Nature.
3.3. In situ synthesis of NCs
Bacterial components (e.g. proteins, polysaccharides, peptides) are potential templates for the growth of fluorescent NCs.79, 80 This strategy has been used to sense and differentiate between bacterial strains. For example, bacterial cell walls can bind with the COOH group of 3-mercaptopropionic acid (MPA) and serve as a template for the synthesis of AuNCs. With changes in bacterial concentration, the fluorescence intensity changes with the generation of different amounts of AuNCs on the bacterial cell walls. In further experiment, kanamycin destroyed non-resistant bacterial cell walls while cell wall of resistant bacteria remained intact. Significant differences in the growth of AuNCs was observed for kanamycin-resistant strains in comparison to nonkanamycin-resistant strains after treating with kanamycin (Figure 12). Similarly, lysozyme damages the cell wall of Gram-positive bacteria but not Gram-negative bacteria, distinguishing Gram-positive from Gram-negative bacteria.81
Figure 12.
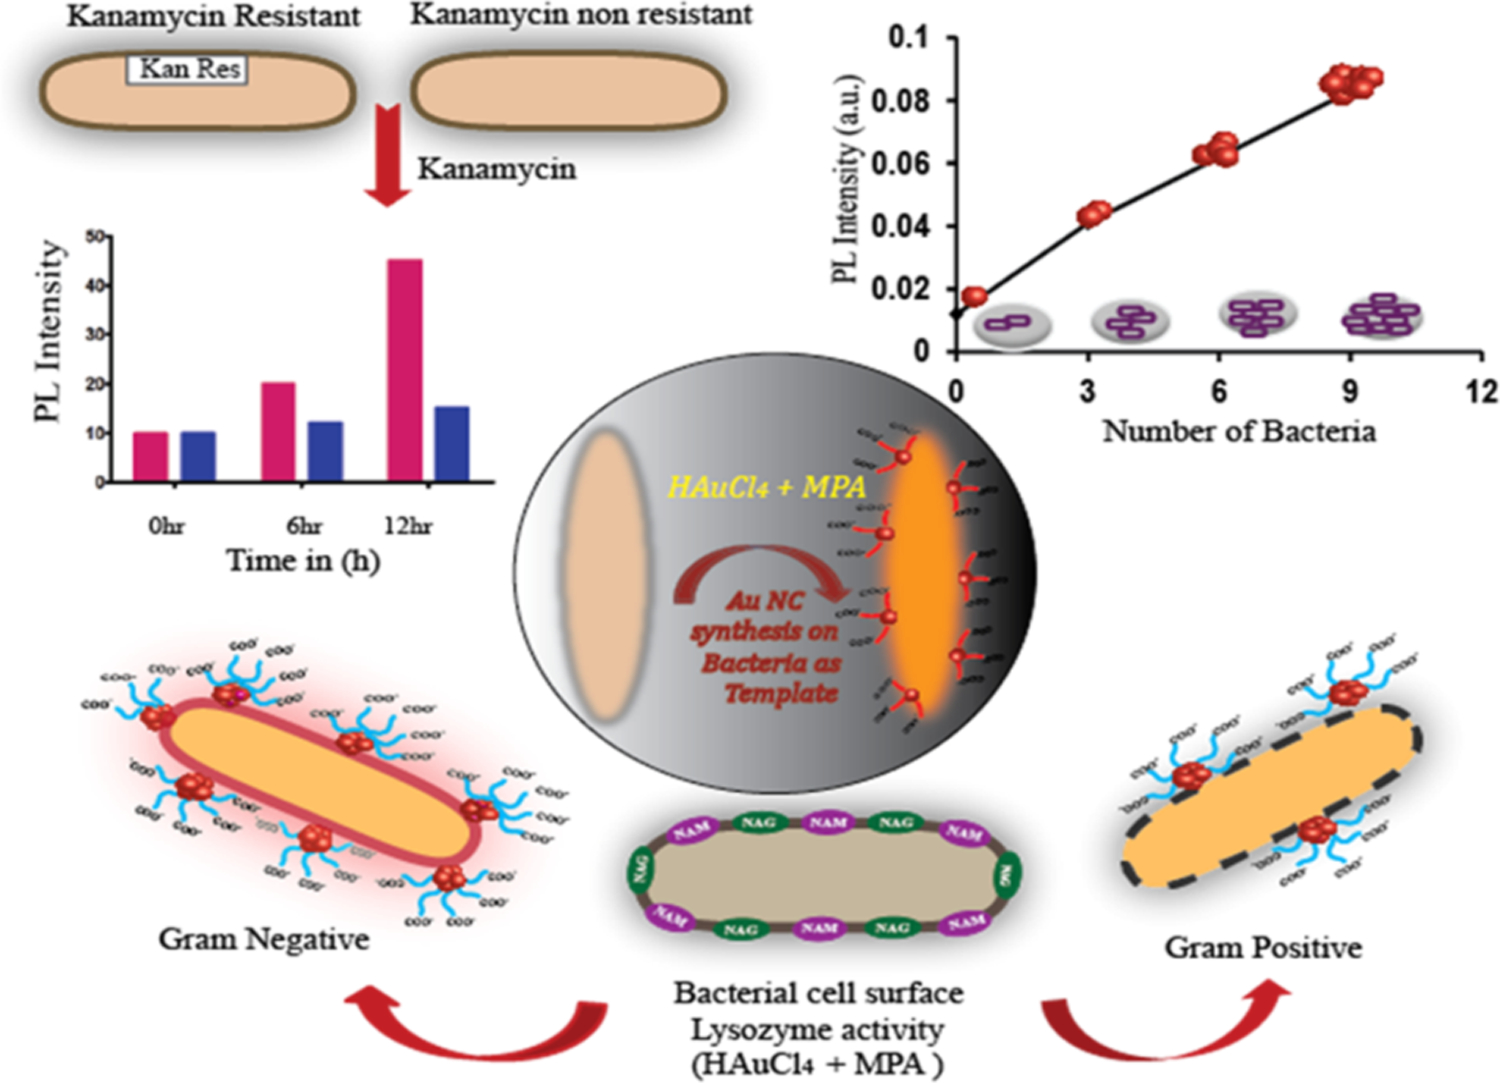
Schematic representation of AuNCs synthesized on bacterial cell wall and the differentiation between Gram-Positive and Gram-Negative Bacteria. Reproduced from Ref.80 Copyright 2018 American Chemical Society. Further permissions related to the material excerpted should be directed to the ACS.
Kaur’s group combined the recognition capability of the antimicrobial peptide leucocin A (LeuA) and the in situ growth of 3-mercaptopropionic acid (MPA) protected AuNCs (MPA-AuNCs) for the detection of L. monocytogenes.82 Leucocin A was immobilized on a glass surface to capture L. monocytogenes (Figure 13). The MPA-AuNCs (fluorescent label) were grown in situ on bacteria to generate fluorescence (Figure 13a). The detection limit was 2000 CFU using just 10 μL of sample with ca. 50 min assay time. This in situ generation of NCs provides a promising strategy for on-site bacterial detection.
Figure 13.
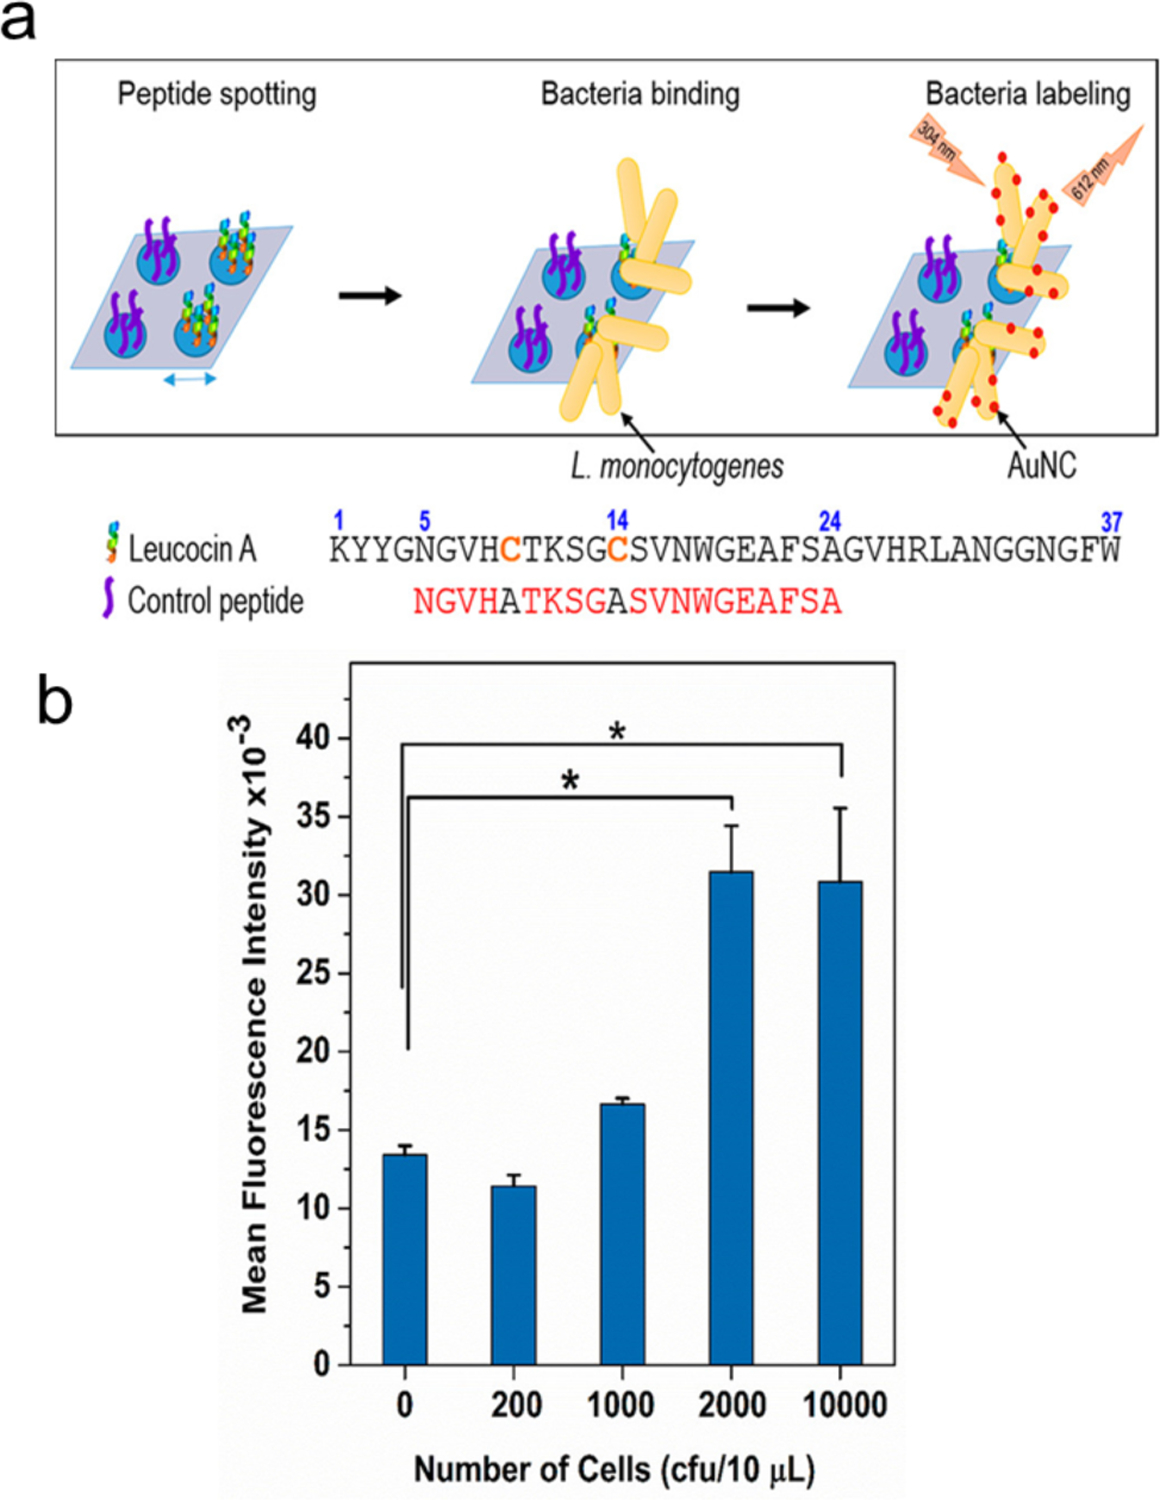
(a) Scheme for the specific detection of Listeria monocytogenes using leucocin A (LeuA) and AuNCs. (b) Fluorescence response of bound bacteria with increasing bacterial concentration (L. monocytogenes) per spot. Peptide LeuA (10 μL, 0.1 mM) was spotted on glass slide followed by bacteria (10 μL) and MPA-AuNCs (12 μL). Reproduced from Ref.82 Copyright 2018 American Chemical Society.
3.4. Other fluorescence/catalysis methods
A number of molecular recognition motifs such as antibiotics, aptamers and peptides have been used to modify nanomaterials to enable selective/specific sensing (Table 1).83.
Table 1.
Sensors based on the optical or catalytic properties of NCs for recognition of bacteria through the identification by a molecular motif.
| NCs | Molecular motif | Bacteria | The Advantage from NCs | Detection Limit | Ref. |
|---|---|---|---|---|---|
| DNA-AgNCs | Aptamer | S. typhimurium, | Fluorescence | 8 CFU/mL | 84 |
| DNA-AgNCs | DNAzyme | E. coli | Fluorescence | 60 CFU/mL | 85 |
| DNA-AgNCs | Aptamer | Salmonella | Catalysis | 0.97 fM | 86 |
| DNA-AgNCs | Aptamer | E. coli, S. aureus | Fluorescence | 100 fM | 87 |
| CHI-AuNCs | Aptamer | S. aureus, SE-B | Catalysis | 1.0× 10⁻¹² g/mL | 78 |
| BSA-AuNCs | AntiSAIgG | MSSA and MRSA | Fluorescence | - | 64 |
| AuNCs@Mann | Mannose | E. coli J96 | Fluorescence | 2×10⁶ cells/mL | 88 |
| HSA-AuNCs | Peptide | S. aureus, MRSA | Fluorescence | 106 cells/mL | 89 |
| Pep-AuNCs | Peptide | Listeria monocytogenes | Fluorescence | 2000 CFU/mL | 82 |
CHI- chitosan; HSA - human serum albumin; Pep- peptide; Mann-mannose; MSSA- methicillin-susceptible Staphylococcus aureus; MRSA- methicillin-resistant Staphylococcus aureus; SE-B-Staphylococcal enterotoxin B.
4. Sensing arrays
The above-mentioned sensors were designed for detecting one type of bacteria using a recognition motif. An alternate strategy is to use array-based sensing strategies for detecting multiple types of bacteria.90 For instance, human serum albumin (HSA), lysozyme (Lyz) and lactoferrin (Lf) protected NCs have been used for analysis of bacteria.69, 89, 91 Li et al constructed a sensor array based on the combination of HSA-AuNCs, Lyz-AuNCs, Lf-AuNCs, and vancomycin functionalized HSA-AuNCs (Van-AuNCs) (Figure 14).92 The first three probes identify the bacterial cells by the protein template. The last probe combines antibiotics with proteins to more specifically target the corresponding bacteria. Based on the sensing array, six types of bacterial cells including A. faecalis, B. subtilis, S. aureus, E. coli, MRSA (methicillin-resistant S. aureus) and KREC (kanamycin resistant E. coli) were discriminated. The bacteria could be identified at levels as low as as 1.2 × 10⁷ cells/mL, with test time of 1 h. Wu et al reported a similar fluorescence sensing array based on metal ions modified AuNCs for analyzing bacterial cells.93 The probes containing Zn2+-Lys-AuNCs, Cd2+-Lys-AuNCs, Zn2+-BSA-AuNCs, Cd2+-BSA-AuNCs, Zn2+-HSAAuNCs, and Cd2+-HSA-AuNCs were combined as the sensing array. The Gram-positive and −negative bacteria in suspensions (OD600 = 0.05) were differentiated and the test time was <30 minutes. Yang et al. fabricated a sensing array based on (+)AuNPs/FA-AuAgNCs for the discrimination of sulfur-emitting bacteria.94 The non-sulfur (E. Coli, S.aures) and sulfur-emitting bacteria (C. thiooxidans, T. prufunda, A. Caldus SM-1) were distinguished at ca. 30 minute at a level of OD600 = 0.005. These sensing arrays open up avenues for analyzing complicated bacterial infection systems.
Figure 14.
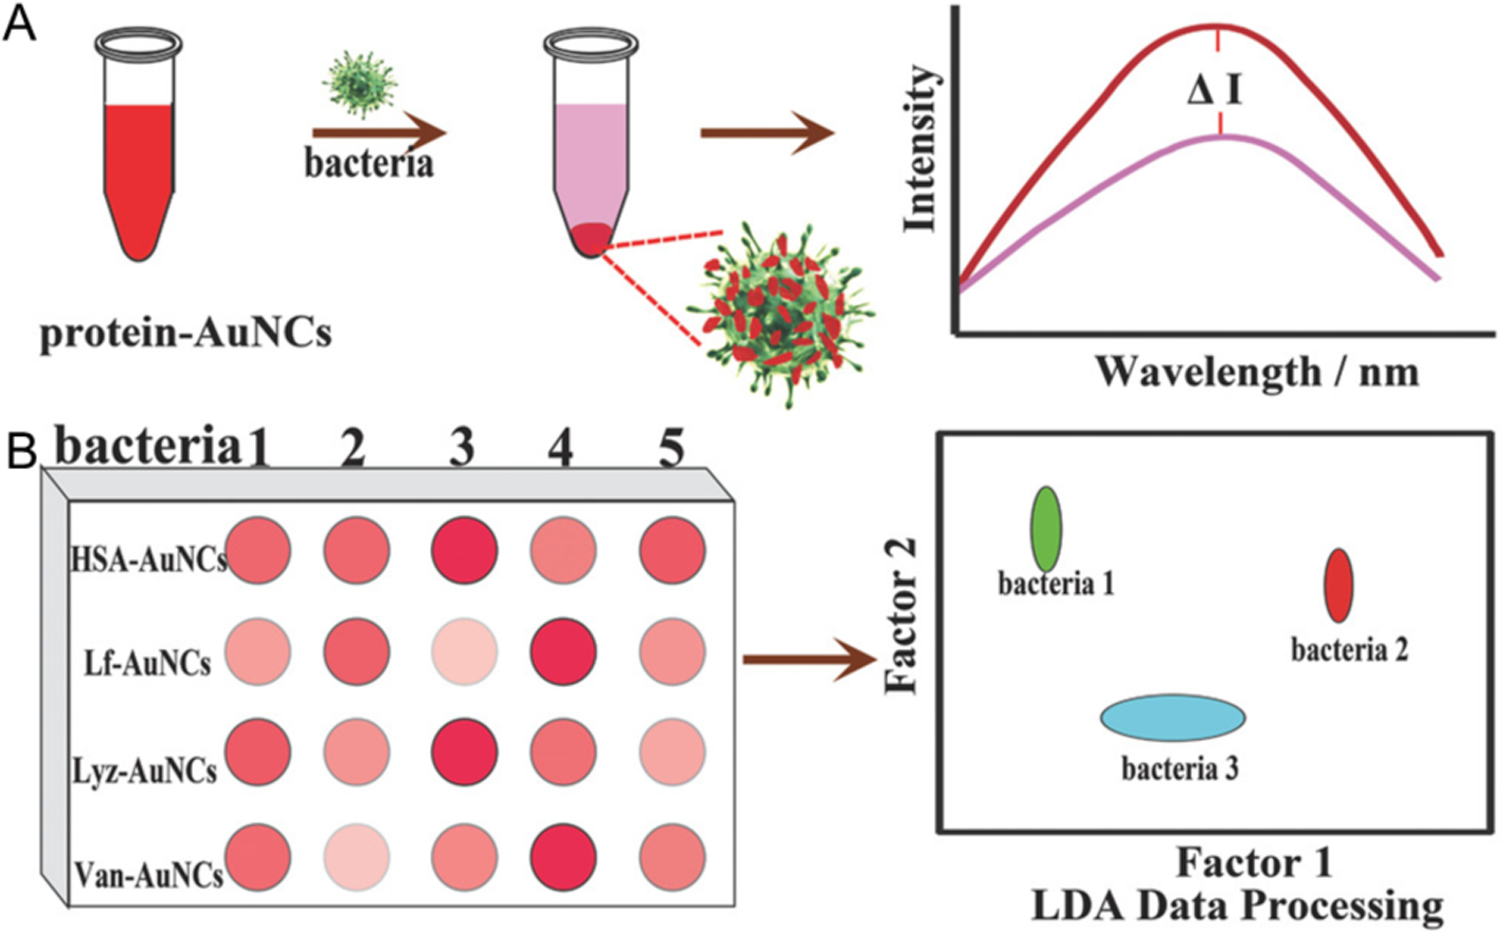
Schematic illustration of protein protected AuNCs-based fluorescence sensing array for discrimination of bacteria. A) The fluorescence intensities of the protein-AuNCs were significantly reduced in the presence of bacteria. B) Fluorescence pattern generated from the different responses of the protein-AuNCs probes toward bacteria. Reproduced with permission from ref.92 Copyright 2018 The Royal Society of Chemistry.
5. Potential point-of-care applications
The fluorescence of NCs can change during antimicrobial processes, a phenomenon that could be employed for point-of care theranostics. In results that highlight this potential, Alsaiari et al designed a bacteria-responsive AuNCs@lysozyme-mesoporous silica (AuNCs@Lys-MSN) nanofiller for bacterial sensing and therapy (Figure 15). The electrostatic interaction between negatively-charged AuNCs@Lys and positively-charged aminated MSN provided an assembled drug carrier and detection system. In the presence of bacteria, AuNC@Lys detached from the MSN surface and the fluorescence of AuNC@Lys was quenched (Figure 15a). The release of entrapped kanamycin also occurred. The drug release system employed the adsorption of the AuNCs@Lys-MSN onto the bacteria upon bacterial contamination (Figure 15b), followed by the degradation of the bacterial cell wall by lysozyme that quenched the fluorescence of AuNCs. The fluorescence of AuNCs depended on the lysozyme catalytic activity and gradually quenched over time (Figure 15c).
Figure 15.
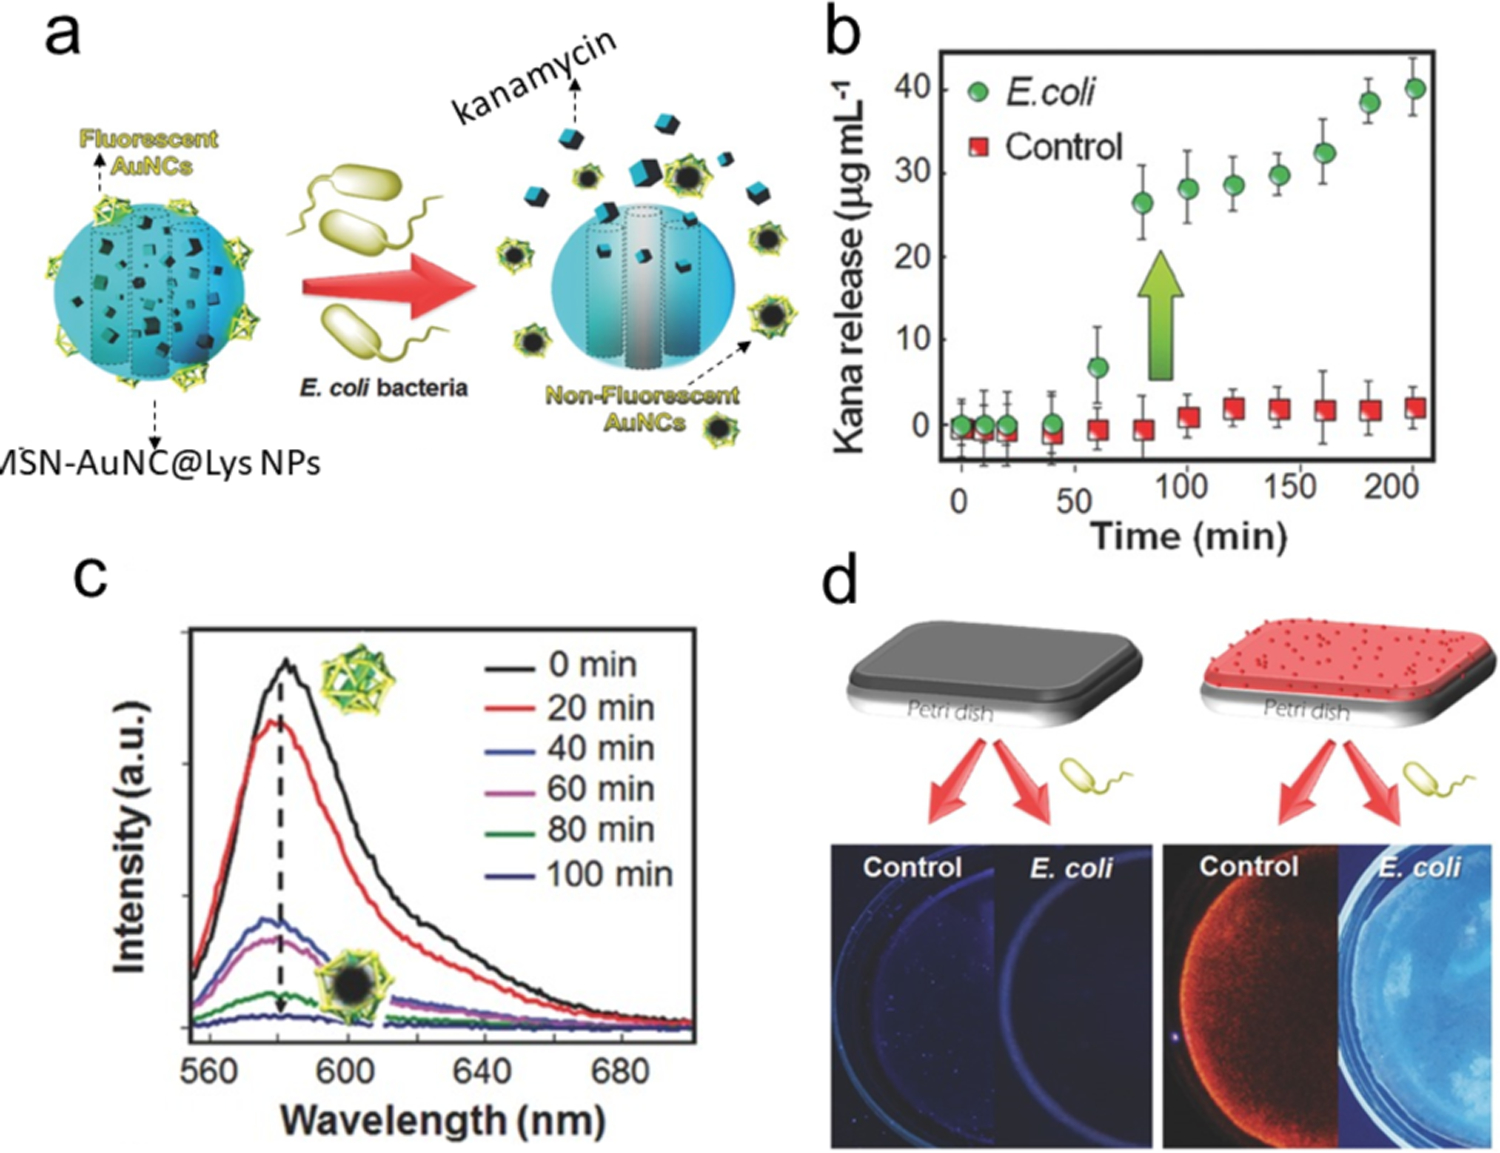
a) Illustration of the bacteria-triggered cargo release from MSNAuNC@Lys NPs and the simultaneous quenching of fluorescence upon the E. coli exposure (kanamycin represented by cubes). b) Kanamycin release profiles from the mixed membrane in the presence of E. coli bacteria or in LB broth. c) Fluorescence emission spectra of AuNC@Lys: as the activity of lysozyme increases, the fluorescence of AuNCs decreases. d) The nanofiller-free and nanofiller-doped membranes was immersed with and without E. coli containing broth. Adapted with permission from ref.95 Copyright 2017 Wiley-VCH Verlag GmbH & Co. KGaA, Weinheim.
In a different approach, an antibacterial polymer membrane containing AuNC@Lys-MSN loaded with kanamycin was fabricated on a photostimulable phosphor (PSP) plate as a theranostic device. The membrane shows bright red emission in absence of bacterial contamination. Upon encountering high bacterial contamination, the red emission was quenched as the detachment of AuNC@Lys from MSN while releasing the drugs (Figure 15d).
In yet another theranostic example, quaternary ammonium (QA) capped AuNCs were used for in vivo disinfection of MRSA. The live/dead bacteria can be differentiated at the same time using imaging method because the dissipated membrane charge of dead cells fails to bind QA-AuNCs.96 The fabrication of more sensitive devices for theranostics of bacterial infection is still expected.97,98, 99 Most recently, NCs were used for in-vivo disease monitoring based on their catalysis effect and high renal clearance ability.23 It indicates the in-vivo diagnosis of bacterial infection is very promising.
Conclusions
NCs provide a promising platform for detection and discrimination of bacteria. Unlike many metal NPs, NCs do not need covalent modification of fluorophores, which can reduce the complexity of the sensing strategy.NCs can detect bacteria without attachment of specific recognition elements, but the specificity is an area with substantial room for improvement. Appropriate engineering of NCs with recognition elements enable the NC-based probes with high specificity to recognize bacteria. NCs can grow in situ on bacterial cell walls and distinguish the targeted cells by treating with appropriate antibiotics. This in situ growth of NCs enable the on-site sensing of bacteria. Building on these single-element studies, NC-based sensing arrays have unique capabilities to identify different complex bacterial mixtures. Cs can also be used for theranostics and theranostics may be employed for future point-of-care diagnosis of bacterial infections. Despite the progress so far, efforts are required to improve the sensitivity, selectivity and practicality of NCs-based bacterial sensors. Additionally, integrating NC technology into devices will be required to enable point-of-care applications.
Supplementary Material
Acknowledgements
This work was supported by the NIH (AI AI134770). The authors also thank China Scholarship Council for the collaboration support to D.L.
Footnotes
Conflicts of interest
There are no conflicts to declare.
Notes and references
- 1.Li B and Webster TJ, J Orthop Res, 2018, 36, 22–32. [DOI] [PMC free article] [PubMed] [Google Scholar]
- 2.Smith PA, Koehler MFT, Girgis HS, Yan D, Chen Y, Chen Y, Crawford JJ, Durk MR, Higuchi RI, Kang J, Murray J, Paraselli P, Park S, Phung W, Quinn JG, Roberts TC, Rouge L, Schwarz JB, Skippington E, Wai J, Xu M, Yu Z, Zhang H, Tan MW and Heise CE, Nature, 2018, 561, 189–194. [DOI] [PubMed] [Google Scholar]
- 3.Silverman SM, Moses JE and Sharpless KB, Chemistry, 2017, 23, 79–83. [DOI] [PubMed] [Google Scholar]
- 4.McEwen SA, Angulo FJ, Collignon PJ and Conly JM, The Lancet Planetary Health, 2018, 2, e279–e282. [DOI] [PubMed] [Google Scholar]
- 5.Silver SBSKYLL, Biochemical pharmacology,, 2017, 133, 63–73. [DOI] [PubMed] [Google Scholar]
- 6.Stephan NCNCJVLKS, Drug Discovery Today, 2017, 22 234–248. [DOI] [PMC free article] [PubMed] [Google Scholar]
- 7.Yong-Guan Zhu YZ, Li Bing, Huang Chu-Long, Zhang Si-Yu, Yu Shen, Chen Yong-Shan, Zhang Tong, Gillings Michael R., Su Jian-Qiang, Nature microbiology, 2017, 2, 16270. [DOI] [PubMed] [Google Scholar]
- 8.Saulnier D, De Decker S, Tourbiez D and Travers MA, J Microbiol Methods, 2017, 140, 67–69. [DOI] [PubMed] [Google Scholar]
- 9.Chakvetadze C, Purcarea A, Pitsch A, Chelly J and Diamantis S, IDCases, 2017, 8, 94–95. [DOI] [PMC free article] [PubMed] [Google Scholar]
- 10.Ashraf A, Imran M, Yaqub T, Tayyab M, Shehzad W and Thomson PC, Mol Cell Probes, 2017, 33, 57–64. [DOI] [PubMed] [Google Scholar]
- 11.Marx V, Nature Methods, 2017, 14, 37–40. [DOI] [PubMed] [Google Scholar]
- 12.Durand ML, Clin Microbiol Rev, 2017, 30, 597–613. [DOI] [PMC free article] [PubMed] [Google Scholar]
- 13.Sui Ching Phung JMC, Macka Mirek, Shane, Powell M, Guijt Rosanne M, and Breadmore Michael C., Analytical Chemistry, 2017, 89 6513–6520. [DOI] [PubMed] [Google Scholar]
- 14.Leng X, Wang Y, Liu S, Pei Q, Cui X, Tu Y, Liu X and Huang J, Sensors and Actuators B: Chemical, 2017, 252, 689–696. [Google Scholar]
- 15.Bhardwaj N, Bhardwaj SK, Nayak MK, Mehta J, Kim K-H and Deep A, TrAC Trends in Analytical Chemistry, 2017, 97, 120–135. [Google Scholar]
- 16.Xue L, Zheng L, Zhang H, Jin X and Lin J, Sensors and Actuators B: Chemical, 2018, 265, 318–325. [Google Scholar]
- 17.Yang B, Chen B, He M and Hu B, Anal Chem, 2017, 89, 1879–1886. [DOI] [PubMed] [Google Scholar]
- 18.Hu RR, Yin ZZ, Zeng YB, Zhang J, Liu HQ, Shao Y, Ren SB and Li L, Biosens Bioelectron, 2016, 78, 31–36. [DOI] [PubMed] [Google Scholar]
- 19.Chen J, Andler SM, Goddard JM, Nugen SR and Rotello VM, Chem Soc Rev, 2017, 46, 1272–1283. [DOI] [PMC free article] [PubMed] [Google Scholar]
- 20.Cifuentes-Rius A, Ivask A, Das S, Penya-Auladell N, Fabregas L, Fletcher NL, Houston ZH, Thurecht KJ and Voelcker NH, ACS Appl Mater Interfaces, 2017, 9, 41159–41167. [DOI] [PubMed] [Google Scholar]
- 21.Sultan D, Ye D, Heo GS, Zhang X, Luehmann H, Yue Y, Detering L, Komarov S, Taylor S, Tai YC, Rubin JB, Chen H and Liu Y, Small, 2018, 14, e1703115. [DOI] [PubMed] [Google Scholar]
- 22.Nair LV, Nair RV, Shenoy SJ, Thekkuveettil A and Jayasree RS, Journal of Materials Chemistry B, 2017, 5, 8314–8321. [DOI] [PubMed] [Google Scholar]
- 23.Loynachan CN, Soleimany AP, Dudani JS, Lin Y, Najer A, Bekdemir A, Chen Q, Bhatia SN and Stevens MM, Nat Nanotechnol, 2019, DOI: 10.1038/s41565-019-0527-6, in press. [DOI] [PMC free article] [PubMed] [Google Scholar]
- 24.Zhang J, Li Z, Huang J, Liu C, Hong F, Zheng K and Li G, Nanoscale, 2017, 9, 16879–16886. [DOI] [PubMed] [Google Scholar]
- 25.Chakraborty I and Pradeep T, Chem Rev, 2017, 117, 8208–8271. [DOI] [PubMed] [Google Scholar]
- 26.Li H, Li L, Pedersen A, Gao Y, Khetrapal N, Jonsson H and Zeng XC, Nano Lett, 2015, 15, 682–688. [DOI] [PubMed] [Google Scholar]
- 27.Higaki T, Zhou M, Lambright KJ, Kirschbaum K, Sfeir MY and Jin R, J Am Chem Soc, 2018, 140, 5691–5695. [DOI] [PubMed] [Google Scholar]
- 28.Li D, Chen Z, Wan Z, Yang T, Wang H and Mei X, RSC Advances, 2016, 6, 34090–34095. [Google Scholar]
- 29.Dipankar Bain SM, Paramanik Bipattaran, Patra Amitava, ACS Sustainable Chem. Eng, 2018, 6, 2334–2343. [Google Scholar]
- 30.Wu Z and Jin R, Nano Lett, 2010, 10, 2568–2573. [DOI] [PubMed] [Google Scholar]
- 31.Chen Y, Yang T, Pan H, Yuan Y, Chen L, Liu M, Zhang K, Zhang S, Wu P and Xu J, J Am Chem Soc, 2014, 136, 1686–1689. [DOI] [PubMed] [Google Scholar]
- 32.Muhammad U. Farooq VN, Rozhkova Elena A., Sci Rep, 2018, 8, 2907. [DOI] [PMC free article] [PubMed] [Google Scholar] [Retracted]
- 33.Yin M-M, Chen W-Q, Liu Y and Jiang F-L, ACS Applied Nano Materials, 2019, 2, 408–417. [Google Scholar]
- 34.Liu Y, Wang J, Song X, Xu K, Chen H, Zhao C and Li J, Microchim Acta, 2018, 185, 360. [DOI] [PubMed] [Google Scholar]
- 35.Li D, Chen Z and Mei X, Adv Colloid Interface Sci, 2017, 250, 25–39. [DOI] [PubMed] [Google Scholar]
- 36.Cui Y, Yang J, Zhou Q, Liang P, Wang Y, Gao X and Wang Y, ACS Appl Mater Interfaces, 2017, 9, 5900–5906. [DOI] [PubMed] [Google Scholar]
- 37.Zheng Y, Lai L, Liu W, Jiang H and Wang X, Adv Colloid Interface Sci, 2017, 242, 1–16. [DOI] [PubMed] [Google Scholar]
- 38.Jiao Zhai LZ, Zheng Lingna, Gao Fuping, Gao Liang, Liu Ru, Wang Yaling, Gao Xueyun, ACS Omega, 2017, 2, 276–282. [DOI] [PMC free article] [PubMed] [Google Scholar]
- 39.Rong Yan ZS, Chen Jie, Wu Hao, Zhao Yuan, Qiu Lin, Jiang Pengju, Mou Xiao Zhou, Wang Jian Hao, and Li Yong Qiang, ACS Sustainable Chem. Eng, 2018, 6, 4504–4509. [Google Scholar]
- 40.Song Y, Gutiérrez OY, Herranz J and Lercher JA, Applied Catalysis B: Environmental, 2016, 182, 236–246. [Google Scholar]
- 41.Chen LY, Wang CW, Yuan Z and Chang HT, Anal Chem, 2015, 87, 216–229. [DOI] [PubMed] [Google Scholar]
- 42.Zhang L and Wang E, Nano Today, 2014, 9, 132–157. [Google Scholar]
- 43.Jin R, Zeng C, Zhou M and Chen Y, Chem Rev, 2016, 116, 10346–10413. [DOI] [PubMed] [Google Scholar]
- 44.Mao B, Qu F, Zhu S and You J, Sensors and Actuators B: Chemical, 2016, 234, 338–344. [Google Scholar]
- 45.Xiaoning Li SMR, Gupta Akash, Saha Krishnendu, Jiang Ziwen, Moyano Daniel F., Sahar Ali, Riley Margaret A., and Rotello Vincent M., ACS Nano, 2014, 8, 10682–10686. [DOI] [PMC free article] [PubMed] [Google Scholar]
- 46.Jiang X, Du B, Huang Y and Zheng J, Nano Today, 2018, 21, 106–125. [DOI] [PMC free article] [PubMed] [Google Scholar]
- 47.Siamak Javani RL, Latorre Alfonso, Flors Cristina, Cortajarena Aitziber L., and Somoza Álvaro, ACS Appl. Mater. Interfaces, 2016, 8, 10147–10154. [DOI] [PubMed] [Google Scholar]
- 48.Wang HY, Hua XW, Wu FG, Li B, Liu P, Gu N, Wang Z and Chen Z, ACS Appl Mater Interfaces, 2015, 7, 7082–7092. [DOI] [PubMed] [Google Scholar]
- 49.Mishra SK, Raveendran S, Ferreira JM and Kannan S, Langmuir, 2016, 32, 10305–10316. [DOI] [PubMed] [Google Scholar]
- 50.Park JH, Kumar G, Park JH, Park HD and Kim SH, Bioresour Technol, 2015, 188, 109–116. [DOI] [PubMed] [Google Scholar]
- 51.Ara Koh FDV, Kovatcheva-Datchary Petia, Backhed Fredrik, Cell, 2016, 6, 1332–1345. [DOI] [PubMed] [Google Scholar]
- 52.Xiong H, Zheng H, Wang W, Liang J, Wen W, Zhang X and Wang S, Biosens Bioelectron, 2016, 86, 164–168. [DOI] [PubMed] [Google Scholar]
- 53.Zheng Y, Wang X and Jiang H, Sensors and Actuators B: Chemical, 2018, 277, 388–393. [Google Scholar]
- 54.Yang Y, Han A, Li R, Fang G, Liu J and Wang S, Analyst, 2017, 142, 4486–4493. [DOI] [PubMed] [Google Scholar]
- 55.Durgadas CV, Sharma CP and Sreenivasan K, Analyst, 2011, 136, 933–940. [DOI] [PubMed] [Google Scholar]
- 56.Rensing C and Grass G, FEMS Microbiology Reviews, 2003, 27, 197–213. [DOI] [PubMed] [Google Scholar]
- 57.Solioz M, Mycobacterial Diseases, 2016, 6, 1000210. [Google Scholar]
- 58.Yang Y, Hu M, Zhou D, Fan W, Wang X and Huo M, RSC Advances, 2017, 7, 18793–18802. [Google Scholar]
- 59.Rong Yan ZS, Chen Jie, Wu Hao, Zhao Yuan, Qiu Lin, Jiang Pengju, Mou Xiao-Zhou, Wang Jianhao, Li Yong-Qiang, ACS Sustainable Chem. Eng, 2018, 6, 4504–4509. [Google Scholar]
- 60.Baker M, Nature Methods, 2010, 7, 957–962. [DOI] [PubMed] [Google Scholar]
- 61.Liu Z, Jing X, Zhang S and Tian Y, Anal Chem, 2019, 91, 2488–2497. [DOI] [PubMed] [Google Scholar]
- 62.Pranantyo D, Liu P, Zhong W, Kang ET and Chan-Park MB, Biomacromolecules, 2019, DOI: 10.1021/acs.biomac.9b00392, 2922–2933. [DOI] [PubMed] [Google Scholar]
- 63.Mukherji R, Samanta A, Illathvalappil R, Chowdhury S, Prabhune A and Devi RN, ACS Appl Mater Interfaces, 2013, 5, 13076–13081. [DOI] [PubMed] [Google Scholar]
- 64.Khlebtsov B, Tuchina E, Tuchin V and Khlebtsov N, RSC Advances, 2015, 5, 61639–61649. [Google Scholar]
- 65.Kong L, Chu X, Ling X, Ma G, Yao Y, Meng Y and Liu W, Microchimica Acta, 2016, 183, 2185–2195. [Google Scholar]
- 66.Linda Eriksson PLH, Ingegerd Johansson, Scientific Reports, 2017, 7, 5861. [DOI] [PMC free article] [PubMed] [Google Scholar]
- 67.Russell BA, Jachimska B, Komorek P, Mulheran PA and Chen Y, Phys Chem Chem Phys, 2017, 19, 7228–7235. [DOI] [PubMed] [Google Scholar]
- 68.Wang X, Cao W, Xiang Q, Jin F, Peng X, Li Q, Jiang M, Hu B and Xing X, Mater Sci Eng C Mater Biol Appl, 2017, 76, 886–896. [DOI] [PubMed] [Google Scholar]
- 69.Liu J, Lu L, Xu S and Wang L, Talanta, 2015, 134, 54–59. [DOI] [PubMed] [Google Scholar]
- 70.Goswami N, Yao Q, Luo Z, Li J, Chen T and Xie J, J Phys Chem Lett, 2016, 7, 962–975. [DOI] [PubMed] [Google Scholar]
- 71.Cheng D, Yu M, Fu F, Han W, Li G, Xie J, Song Y, Swihart MT and Song E, Anal Chem, 2016, 88, 820–825. [DOI] [PubMed] [Google Scholar]
- 72.Cheng C, Yang L, Zhong M, Deng W, Tan Y, Xie Q and Yao S, Analyst, 2018, 143, 4067–4073. [DOI] [PubMed] [Google Scholar]
- 73.Li D, Wang G, Peng Y, Chen Z, Gao X, Cheng L and Mei X, Nanoscale Advances, 2019, 1, 1086–1095. [DOI] [PMC free article] [PubMed] [Google Scholar]
- 74.Wang Q, Wang X, Sun Y, Yang X, Zhang L, Zhang Q, Hu ZQ and Hu HY, Chem Commun (Camb), 2019, 55, 5064–5067. [DOI] [PubMed] [Google Scholar]
- 75.Yu M, Wang H, Fu F, Li L, Li J, Li G, Song Y, Swihart MT and Song E, Anal Chem, 2017, 89, 4085–4090. [DOI] [PubMed] [Google Scholar]
- 76.Krainer G, Hartmann A and Schlierf M, Nano Lett, 2015, 15, 5826–5829. [DOI] [PubMed] [Google Scholar]
- 77.Creran B, Li X, Duncan B, Kim CS, Moyano DF and Rotello VM, ACS Appl Mater Interfaces, 2014, 6, 19525–19530. [DOI] [PMC free article] [PubMed] [Google Scholar]
- 78.Xie X, Tan F, Xu A, Deng K, Zeng Y and Huang H, Sensors and Actuators B: Chemical, 2019, 279, 289–297. [Google Scholar]
- 79.Ding H, Li H, Liu P, Hiltunen JK, Wu Y, Chen Z and Shen J, Microchimica Acta, 2014, 181, 1029–1034. [Google Scholar]
- 80.Goswami U, Sahoo AK, Chattopadhyay A and Ghosh SS, ACS Omega, 2018, 3, 6113–6119. https://pubs.acs.org/doi/10.1021/acsomega.8b00504. [DOI] [PMC free article] [PubMed] [Google Scholar]
- 81.West AL, Schaeublin NM, Griep MH, Maurer-Gardner EI, Cole DP, Fakner AM, Hussain SM and Karna SP, ACS Appl Mater Interfaces, 2016, 8, 21221–21227. [DOI] [PubMed] [Google Scholar]
- 82.Hossein-Nejad-Ariani H, Kim T and Kaur K, ACS Applied Nano Materials, 2018, 1, 3389–3397. [Google Scholar]
- 83.Wang LS, Gopalakrishnan S and Rotello VM, Langmuir, 2018, DOI: 10.1021/acs.langmuir.8b03235, in press. [DOI] [PubMed] [Google Scholar]
- 84.Leng X, Wang Y, Li R, Liu S, Yao J, Pei Q, Cui X, Tu Y, Tang D and Huang J, Microchim Acta, 2018, 185, 168. [DOI] [PubMed] [Google Scholar]
- 85.Zheng L, Qi P and Zhang D, Sensors and Actuators B: Chemical, 2018, 276, 42–47. [Google Scholar]
- 86.Ye Y, Liu Y, He S, Xu X, Cao X, Ye Y and Zheng H, Sensors and Actuators B: Chemical, 2018, 272, 53–59. [Google Scholar]
- 87.Lin X, Liu Y, Deng J, Lyu Y, Qian P, Li Y and Wang S, Chemical Science, 2018, 9, 1774–1781. [DOI] [PMC free article] [PubMed] [Google Scholar]
- 88.Chan PH, Ghosh B, Lai HZ, Peng HL, Mong KK and Chen YC, PLoS One, 2013, 8, e58064. [DOI] [PMC free article] [PubMed] [Google Scholar]
- 89.Chan PH and Chen YC, Anal Chem, 2012, 84, 8952–8956. [DOI] [PubMed] [Google Scholar]
- 90.Geng Y, Peveler WJ and Rotello V, Angew Chem Int Ed Engl, 2019, 58, 5190–5200. [DOI] [PMC free article] [PubMed] [Google Scholar]
- 91.Xavier PL, Chaudhari K, Verma PK, Pal SK and Pradeep T, Nanoscale, 2010, 2, 2769–2776. [DOI] [PubMed] [Google Scholar]
- 92.Ji H, Wu L, Pu F, Ren J and Qu X, Adv Healthc Mater, 2018, 7, 1701370. [DOI] [PubMed] [Google Scholar]
- 93.Wu Y, Wang B, Wang K and Yan P, Analytical Methods, 2018, 10, 3939–3944. [Google Scholar]
- 94.Yang JY, Yang T, Wang XY, Wang YT, Liu MX, Chen ML, Yu YL and Wang JH, Anal Chem, 2019, 91, 6012–6018. [DOI] [PubMed] [Google Scholar]
- 95.Alsaiari SK, Hammami MA, Croissant JG, Omar HW, Neelakanda P, Yapici T, Peinemann KV and Khashab NM, Adv Healthc Mater, 2017, 6, 1601135. [DOI] [PubMed] [Google Scholar]
- 96.Xie Y, Liu Y, Yang J, Liu Y, Hu F, Zhu K and Jiang X, Angew Chem Int Ed Engl, 2018, 57, 3958–3962. [DOI] [PubMed] [Google Scholar]
- 97.Li LL and Wang H, Adv Healthc Mater, 2013, 2, 1351–1360. [DOI] [PubMed] [Google Scholar]
- 98.Zhou W, Le J, Chen Y, Cai Y, Hong Z and Chai Y, TrAC Trends in Analytical Chemistry, 2019, 112, 175–195. [Google Scholar]
- 99.Tsuru A, Setoguchi T, Kawabata N, Hirotsu M, Yamamoto T, Nagano S, Yokouchi M, Kakoi H, Kawamura H, Ishidou Y, Tanimoto A and Komiya S, BMC Res Notes, 2015, 8, 288. [DOI] [PMC free article] [PubMed] [Google Scholar]
Associated Data
This section collects any data citations, data availability statements, or supplementary materials included in this article.


