Abstract
Protein tyrosine phosphatase 1B (PTP1B) is a key negative regulator of insulin and an effective target for the treatment of type 2 diabetes (T2D). A natural hyperbranched proteoglycan extracted from Ganoderma lucidum, namely, Fudan-Yueyang G. Lucidum (FYGL), was demonstrated capable of inhibiting the activity of PTP1B. Here, to identify the effective active components of FYGL, three different components, the polysaccharide FYGL-1, proteoglycans FYGL-2, and FYGL-3, were isolated from FYGL, and then, the protein moiety of FYGL-3 was further separated, namely, FYGL-3-P. Their abilities to enhance the glucose uptake in cells and inhibit the activity of PTP1B were compared. The inhibitory mechanisms were systematically explored by spectroscopic methods and MD simulations. The results showed that FYGL-3 and FYGL-3-P significantly enhanced the insulin-provoked glucose uptake in insulin-resistant HepG2 cells, detected by the glucose oxidase method. Also, the FYGL-3-P protein moiety in FYGL played an essential role in inhibiting the activity of PTP1B. A strong, enthalpy-driven, and multitargeted interaction by electrostatic forces between PTP1B and FYGL-3-P dramatically inhibited the catalytic activity of PTP1B. These results provided deep insights into the molecular mechanisms of FYGL inhibiting the activity of PTP1B and structurally helped researchers seek natural PTP1B inhibitors.
Introduction
Protein tyrosine phosphatase 1B (PTP1B) is a key regulator regulating and dephosphorylating insulin receptors.1,2 The overexpression of PTP1B can inhibit the signaling cascades of the insulin receptor, leading to insulin resistance and type 2 diabetes (T2D).1 Therefore, PTP1B is considered an effective target for ameliorating insulin resistance and T2D.
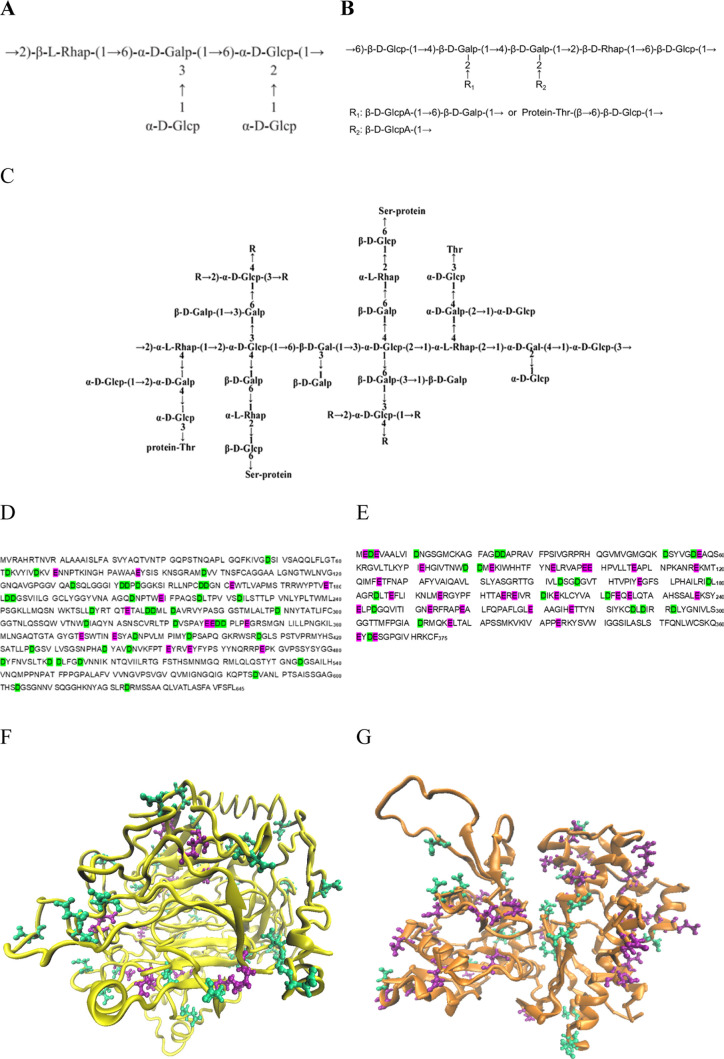
Ganoderma lucidum is a basidiomycete fungus that has been widely used for immunomodulation3 and antitumour4 in Asia and also has been used to prevent T2D.5,6 Hassan et al. reported that G. lucidum could ameliorate diabetic nephropathy via a down-regulatory effect on TGFbeta-1 and TLR-4/NFkappaB signaling pathways.7 In our lab, a proteoglycan was extracted previously from the G. lucidum fruit body, namely, Fudan-Yueyang G. Lucidum (FYGL).8 Approximately 1% FYGL can be extracted from dried raw materials, and it has been demonstrated that it could inhibit the catalytic activity of PTP1B and decrease the plasma glucose value and then prevent T2D in vivo.8 Furthermore, three main fractions were isolated from FYGL: the heteropolysaccharide FYGL-1, the proteoglycan FYGL-2, and the highly branched proteoglycan FYGL-3, with molecular weights of 78, 61, and 100 kD, respectively.9FYGL-2 contains 85 ± 2% heteropolysaccharide and FYGL-3 contains 82 ± 2% highly branched heteropolysaccharide.9−11 The dominant repeating units of the polysaccharide moieties of FYGL-1, FYGL-2, and FYGL-3 are shown in Figure 1A–C, respectively, characterized by chemical analysis, mass spectroscopy, and NMR spectroscopy.9,11 The sequences of the protein moieties of FYGL-2 and FYGL-3 are shown in Figure 1D,E, respectively, characterized by mass spectroscopy, and their structures are shown in Figure 1F,G, respectively, predicted by the Iterative Threading ASSEmbly Refinement (I-TASSER) approach12−14 (being submitted results).
Figure 1.
Structures of polysaccharide components of (A) FYGL-1, (B) FYGL-2, and (C) FYGL-3. Sequences of the protein moieties of (D) FYGL-2 and (E) FYGL-3. Predicted structures of the protein moieties of (F) FYGL-2 and (G) FYGL-3. p: pyranose; f: furanose; Thr: threonine; Ser: serine. The acidic amino acids Asp and Glu are marked in green and purple, respectively.
Despite the good efficacy of FYGL in treating T2D in vivo, the effective active components and the mechanisms of FYGL inhibiting PTP1B activity remained unclear. In this work, to determine the most effective component in FYGL inhibiting the catalytic activity of PTP1B and to understand the key functional mechanisms, the insulin-provoked glucose uptake influenced by FYGL-1, FYGL-2, FYGL-3, and FYGL-3-P, a protein moiety separated from FYGL-3, were investigated in insulin-resistant HepG2 cells. Moreover, the inhibitory effects of different components of FYGL against PTP1B activity were compared. Furthermore, interactions between PTP1B and polysaccharide or protein moieties of FYGL were investigated in depth to reveal the structure/efficacy relationship of FYGL on inhibiting PTP1B activity both experimentally and theoretically.
Results and Discussion
Effect of Different Components of FYGL on HepG2 Cell Viability
Before comparing the effects of different components of FYGL on ameliorating insulin resistance in HepG2, their effects on HepG2 cell viability were tested first. As shown in Figure 2, the cell viability of HepG2 was hardly affected by FYGL-1 at a concentration range from 100 to 800 μg/mL. The cell viability was not significantly changed by FYGL-2 and FYGL-3 at a concentration lower than 400 μg/mL and by FYGL-3-P at a concentration lower than 200 μg/mL. These results indicated that the FYGL-1 polysaccharide was safe for HepG2 in a wide concentration range, while the protein or the proteoglycan moieties of FYGL were safe for HepG2 at a relatively low concentration.
Figure 2.
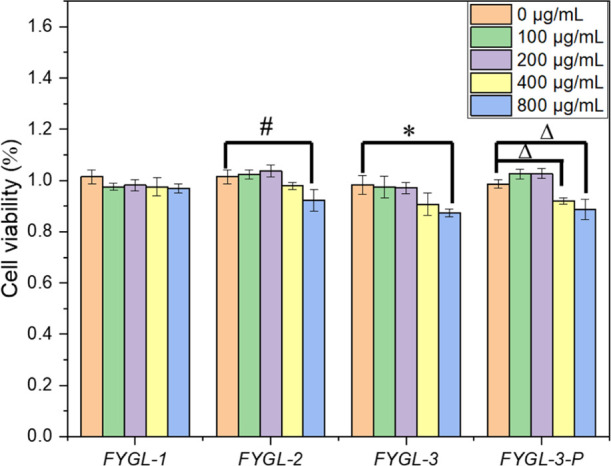
Effects of different components of FYGL on the cell viability of HepG2. Data are the mean ± S.E. (n = 4). #p < 0.05; *p < 0.05 and Δp < 0.05 vs the given group.
The insulin-resistant state of HepG2 was built by transfecting the PTP1B plasmid into the cells, where PTP1B was over-expressed. As shown in Figure 3, the glucose intake of HepG2 treated with insulin was dramatically decreased after the PTP1B plasmid was transferred into the cells, indicating that the cells were resistant to insulin.
Figure 3.
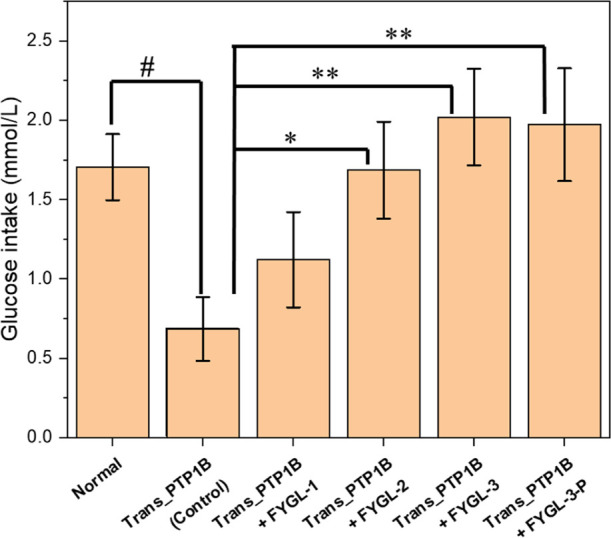
Glucose uptake of HepG2 stimulated by 10 U/mL insulin before and after the PTP1B plasmid transfected into the cells and that affected by 100 μg/mL different components of FYGL. The group transferred with the PTP1B plasmid without FYGL was the control group. Data are the mean ± S.E. (n = 4). #p < 0.05; *p < 0.05 and **p < 0.01 vs the given group.
The glucose intake of HepG2 was significantly increased with the treatments of 100 μg/mL FYGL-2, FYGL-3, and FYGL-3-P, where the effects of FYGL-3 and FYGL-3-P were more significant than that of FYGL-2. However, although the glucose intake in the FYGL-1 group was slightly higher than that in the control group, there was no significant difference between them. These results indicated that proteoglycan components of FYGL were more effective in increasing insulin sensitivity in HepG2 cells than the polysaccharide component, suggesting that the protein moieties of FYGL played key roles in inhibiting PTP1B and ameliorating insulin resistance. The effects of different components of FYGL on inhibiting PTP1B will be further explored on a molecular basis in the following.
Effects of Different Components of FYGL on Inhibiting PTP1B Activity
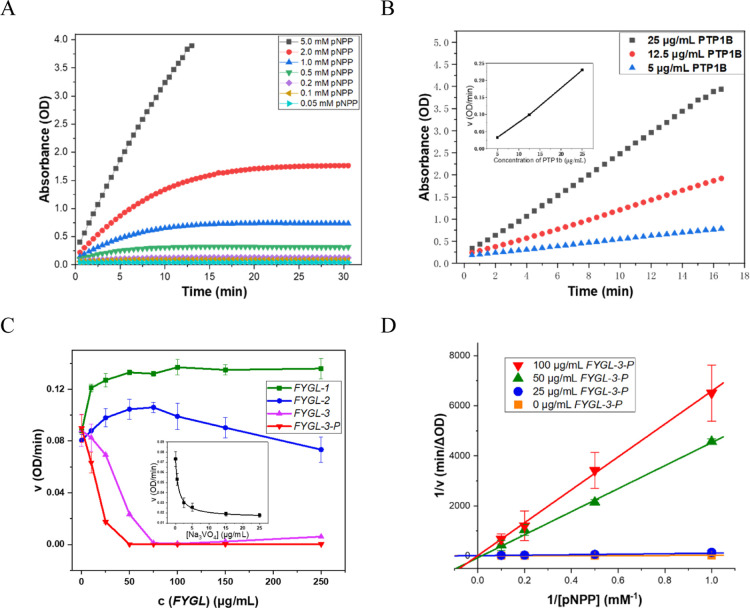
Normally, the hydrolysis rate of p-nitrophenol phosphate (pNPP) catalyzed by PTP1B depends on the concentration of pNPP and the catalytic activity of PTP1B. Therefore, the catalytic activity of PTP1B can be evaluated accurately only when there is excessive pNPP. As shown in Figure 4A, the relative hydrolysis rate of pNPP, expressed by the slope of the curve, remained constant within 15 min only at 5.0 mM pNPP and 12.5 μg/mL PTP1B, indicating that the substrate had been excessive at this condition. Figure 4B shows that the hydrolysis rates of pNPP were positively associated with the concentration of PTP1B at 5.0 mM pNPP so that the activity of PTP1B was evaluated at 5.0 mM pNPP.
Figure 4.
(A) Hydrolysis rate of pNPP at different concentrations catalyzed by 12.5 μg/mL PTP1B. (B) Hydrolysis rate of 5.0 mM pNPP catalyzed by PTP1B at different concentrations. The inset illustrated the hydrolysis rate of pNPP positively relating to the concentration of PTP1B. (C) Effects of different components of FYGL on the hydrolysis rates of 5.0 mM pNPP catalyzed by 12.5 μg/mL PTP1B, where Na3VO4 was used as the positive control shown in the inset. (D) Lineweaver–Burk plot of the inhibitory effect of FYGL-3-P on PTP1B-catalyzed hydrolysis of pNPP. Data are the mean ± S.E. (n = 3).
As shown in Figure 4C and Table 1, the polysaccharide component FYGL-1 hardly exhibited any inhibitory activity against PTP1B, while the proteoglycans FYGL-2 and FYGL-3 inhibited the catalytic activity of PTP1B. However, the effect of FYGL-2 inhibiting PTP1B was not as strong as that of FYGL-3. To further investigate the effect of FYGL-3 inhibiting PTP1B, the protein moiety of FYGL-3, that is, FYGL-3-P, was divided, and it exhibited stronger inhibitory activity than FYGL-3. These results indicated that protein moieties in FYGL played more important roles in inhibiting the activity of PTP1B. Although the quantitative influence of FYGL-2 and FYGL-3 on inhibiting the activity of PTP1B was not linear from cellular basis to molecular basis possibly because their uptake into cells was different, which might be affected by some factors, such as the molecular structures, interaction between molecules and cell membranes, cell activity, and so on, the trend of FYGL-2 and FYGL-3 on inhibiting PTP1B activity was similar between the HepG2 cell level and molecular level on ameliorating insulin resistance, which would be referenceable for the efficacy in vivo. The different sequences and structures of the protein moieties in FYGL-2 and FYGL-3 (shown in Figure 1) could make their properties different.
Table 1. Inhibitory Activity of Different Components of FYGL against PTP1B.
| components | IC50 (μg/mL)a |
|---|---|
| FYGL-1 | |
| FYGL-2 | 439 ± 105 |
| FYGL-3 | 35.5 ± 6.5 |
| FYGL-3-P | 15.4 ± 3.3 |
| Na3VO4 | 1.61 ± 0.31 |
To further elucidate the inhibition mode of FYGL-3-P against PTP1B, kinetic analyses were performed. As shown in Figure 4D, reciprocal curves of FYGL-3-P at different concentrations inhibiting PTP1B-catalyzed hydrolysis of pNPP were nearly intersected to the 1/ν axis, which suggested that the inhibition mode of FYGL-3-P against PTP1B was competitive. The result of competitive inhibition indicated that FYGL-3-P could bind at the main catalytic active site of PTP1B.
Physicochemical Mechanisms of PTP1B Interacting with the Protein or the Polysaccharide Moieties of FYGL
To investigate the physicochemical mechanisms of the interaction between FYGL and PTP1B, FYGL-3-P and FYGL-1 were selected as examples of the protein and the polysaccharide moieties of FYGL, respectively. Binding affinity and thermodynamic parameters were determined by isothermal titration calorimetry (ITC) thermogram curves. Generally speaking, the standard Gibbs energy of binding (ΔGΘ) is derived from 1(15,16)
| 1 |
where ΔHΘ is the standard enthalpy, ΔSΘ is the entropy, and T is the temperature.
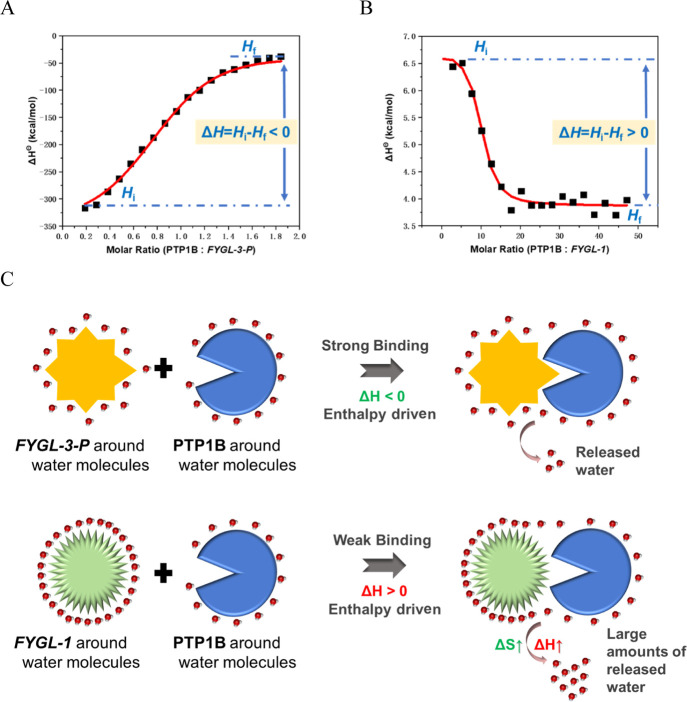
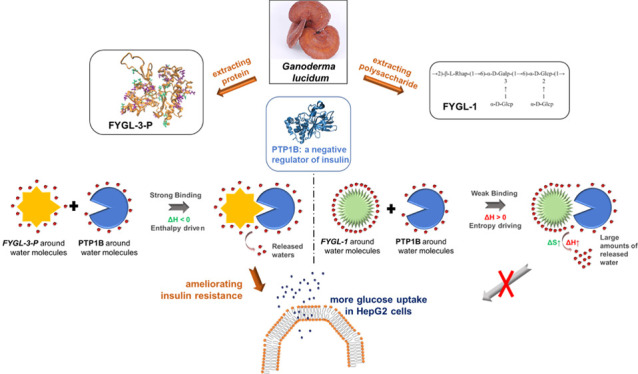
As shown in Figure 5, ΔHΘ was the difference between initial enthalpy Hi and final enthalpy Hf. The interaction between PTP1B and FYGL-3-P was driven by favorable negative enthalpy (ΔHΘ = Hi – Hf < 0), indicating that this interaction was mainly from some intermolecular forces such as van der Waals forces, electrostatic forces, and so on.17,18 This enthalpically driven interaction, which is between FYGL-3-P and PTP1B in our system, usually is strong and specific.17 However, for the interaction between PTP1B and FYGL-1, ΔHΘ > 0 and ΔHΘ was unfavorable. In general, ΔGΘ is always negative for a spontaneous process; therefore, according to eq 1, ΔSΘ for the process of PTP1B interacting with FYGL-1 should be positive (ΔSΘ > 0 and favorable). This indicated that the interaction between PTP1B and FYGL-1 was entropically driven, according to the research by Freire et al.,(17) and this entropically driven interaction came from the increase of entropy when water molecules transferred from a protein to bulk solvent (Figure 5C). This entropically driven binding, sometimes called hydrophobic interaction,17 is usually weak and nonspecific. To summarize, the interaction between PTP1B and the FYGL-3-P protein moiety was enthalpically driven and strong, while the interaction between PTP1B and the FYGL-1 polysaccharide moiety was entropically driven and weak, which was a reasonable explanation for the better inhibitory activity of FYGL-3-P against PTP1B than FYGL-1.
Figure 5.
ITC thermogram curves when 4 × 10⁻⁷ mol/L PTP1B was dropped into 2 × 10⁻⁵ mol/L (A) FYGL-1 or (B) FYGL-3-P at 25 °C. (C) Schematic of enthalpically driven or entropically driven interactions between PTP1B and FYGL-3-P or FYGL-1.
MD Simulation of the Interaction between PTP1B and FYGL-3-P
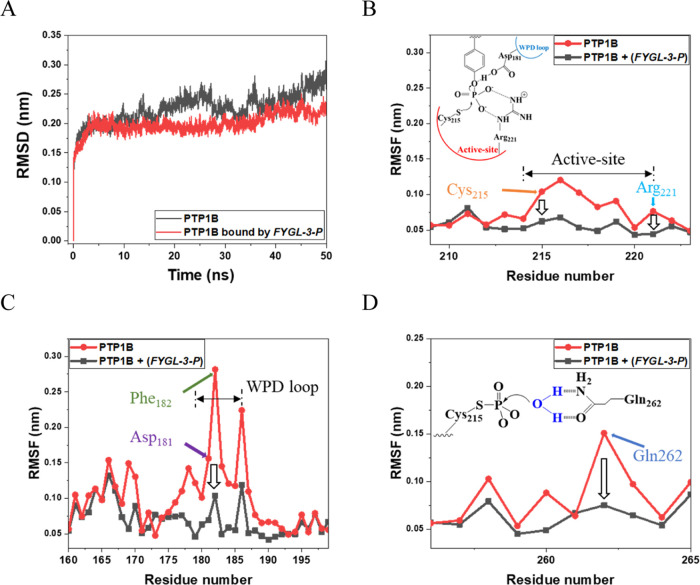
MD simulation was further used to investigate the influence of FYGL-3-P on PTP1B in aqueous solution. The root mean square deviation (RMSD) was used to measure the spatial variations of PTP1B molecules over the MD simulation period and to understand the stability of PTP1B.19 As shown in Figure 6A, the RMSD of PTP1B fluctuated sharply over the MD simulation period, which suggested that the structure of PTP1B changed violently in aqueous solution. However, for the PTP1B bound by FYGL-3-P, the RMSD quickly reached the energy convergence and equilibrium state within 5 ns and maintained a relatively constant value over the simulation period. This phenomenon indicated that the structure of PTP1B was stabilized by FYGL-3-P, and in other words, PTP1B in this state was not as active as that in its natural state. This result was consistent with the conclusions of ITC tests.
Figure 6.
(A) RMSD of PTP1B and the influences of FYGL-3-P. RMSF of PTP1B and the influences of FYGL-3-P at (B) active site, (C) WPD loop, and (D) Gln262 in PTP1B.
The root mean square fluctuation (RMSF) usually reflects the deviation in fluctuations around the averaged position of each residue or atom during the MD simulation; therefore, it was used to investigate the influences of FYGL-3-P on each residue of PTP1B.20 Higher RMSF indicated a more flexible residue. Figure 6B shows the RMSF of PTP1B at the active site (main catalytic site) of PTP1B and the influences of FYGL-3-P. The base of the active site is a loop of 8 residues from 214 to 221 that forms a cradle-like structure to coordinate to the substrate.21 Among these residues of the active site, Cys215 and Arg221 played the most important roles during the hydrolysis of a substrate because they combined with the aryl-phosphate moiety of the substrate to catalyze its hydrolysis.21 With the influences of FYGL-3-P, the RMSF of Cys215 and Arg221 dropped significantly, suggesting that the motions of these residues were strongly restricted by FYGL-3-P. The restriction of Cys215 and Arg221 decreased the catalytic activity of PTP1B.
Besides the active site, there are also some inactive sites around the active site in PTP1B that also play important roles in the hydrolysis of substrates. For example, in natural conditions, when the active site was combined with a substrate, the active site would be closed by the WPD (W-P-D; Trp-Pro-Asp; tryptophan, proline, and aspartic acid) loop to form a tight binding pocket for the substrate, and this process was essential for the hydrolysis of the substrate catalyzed by PTP1B.21 As shown in Figure 6C, the RMSF of Phe182 in the WPD loop was much larger than that of other residues, resulting from the frequent change of the WPD loop between “open” and “close” conformations. However, with the influence of FYGL-3-P, the RMSF of Phe182 declined sharply, indicating that the motion of Phe182 was dramatically restricted. In this case, the substrate was not easy to be close after binding with the active site of PTP1B, resulting in the decrease of the catalytic efficiency of PTP1B. Similarly, Asp181 in the WPD loop, which acted as an acid to protonate the tyrosyl leaving group,21 was also restricted in the same way. In addition, during the hydrolysis of a cysteinyl-phosphate intermediate, Gln262 in PTP1B swung into the catalytic site to activate a nucleophilic water molecule and then to improve the hydrolysis efficiency, as shown in Figure 6D.22 The RMSF showed that the motion of Gln262 was also restricted by FYGL-3-P, indicating that Gln262 moved less freely with the influences of FYGL-3-P. Besides the active site, many inactive sites in PTP1B were also restricted by the influences of FYGL-3-P, which contributed to the effective inhibition of PTP1B by FYGL-3-P.
According to the results of ITC, the restriction of the catalytic sites of PTP1B resulted from the favorable binding between FYGL-3-P and PTP1B. The simulated average binding free energy and the energetic contribution for the interaction between PTP1B and FYGL-3-P were calculated according to the MD results, as shown in Table 2. It was found that the favorable electrostatic free energy played the most important role in the total binding free energy, indicating that the strong electrostatic force greatly contributed to the binding of PTP1B with FYGL-3-P. According to the structure of FYGL-3-P, as shown in Figure 1G, there were large amounts of acidic amino acids on FYGL-3-P; therefore, the net charges of FYGL-3-P in solution were calculated as −12e. The negatively charged FYGL-3-P could naturally attract some positively charged groups on PTP1B, resulting in the strong electrostatic interaction between PTP1B and FYGL-3-P.
Table 2. Binding Free Energy and the Energetic Contribution for the Interaction between PTP1B and FYGL-3-P.
| system | PTP1B + FYGL-3-Pa |
|---|---|
| van der Waals free energy (×102 kJ/mol) | –1.2 ± 0.5 |
| electrostatic free energy (×102 kJ/mol) | –6.1 ± 2.0 |
| SASA free energy (×102 kJ/mol) | –0.18 ± 0.07 |
| polar solvation free energy (×102 kJ/mol) | 6.2 ± 2.2 |
| total binding free energy (×102 kJ/mol) | –1.2 ± 1.6 |
Data are the mean ± S.E.
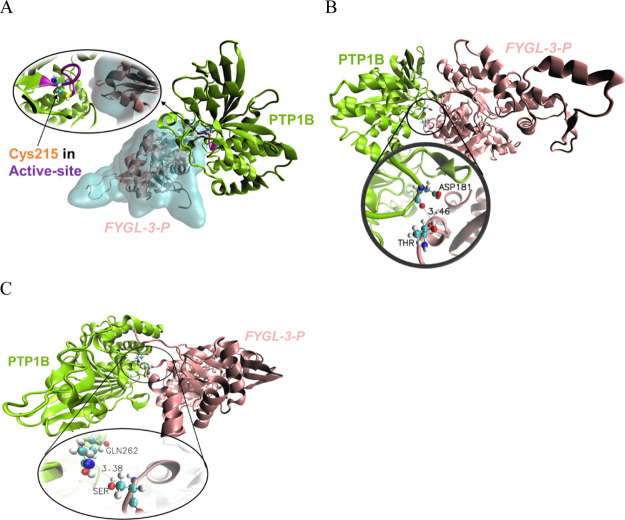
Visual inspection of the MD results showed the interaction between FYGL-3-P and PTP1B. As shown in Figure 7A, the active site of PTP1B hardly interacted with FYGL-3-P directly, but some groups around the active site easily bonded to FYGL-3-P directly. Figure 7A shows that the active site of PTP1B was buried when PTP1B was bound with FYGL-3-P, which greatly increased the steric hindrance when a substrate came close to the active site and ultimately decreased the catalytic activity of PTP1B. As a direct binding group in PTP1B with FYGL-3-P, for example, Asp181 in the WPD loop of PTP1B was easy to be directly attracted by Thr in FYGL-3-P, as shown in Figure 7B. Generally, the cutoff donor-to-acceptor distance for an energetically significant hydrogen bond in proteins is 3.5 Å.23Figure 7B shows that the distance between the carbonyl group of Asp181 in PTP1B and the hydroxyl group of Thr in FYGL-3-P was 3.46 Å, which was less than the cutoff distance for an energetically significant hydrogen bond. Similarly, Gln262 in PTP1B was also easily bonded to Ser in FYGL-3-P by a hydrogen bond between the amide group and the hydroxyl group, according to a short donor-to-acceptor distance of 3.38 Å. These direct and indirect interactions between FYGL-3-P and those key catalytic sites in PTP1B resulted in the restriction of the motion of PTP1B, which ultimately resulted in the inhibition of the catalytic activity of PTP1B.
Figure 7.
Visual MD results for the interaction between PTP1B and FYGL-3-P at (A) Cys215 in the active site, (B) Asp181 in the WPD loop, and (C) Gln262 in PTP1B, where the unit of the bond length was “Å”.
1H NMR of PTP1B Influenced by FYGL-1 or FYGL-3-P
1H NMR spectra were used to further investigate the interactions between the different components of FYGL and PTP1B. Generally speaking, T2, the transverse relaxation time of spin nuclei, is responsible for the linewidth of the resonance peak and is inversely proportional to the linewidth.24,25 Interactions between peptides and ligands can shorten T2 due to restricting the motion of residues, which leads to the broadening of resonance peaks and the decrease of the peak height.26−28
As shown in Figure 8, 1H NMR peaks in the range of 3.2–5.2 ppm were assigned to 1H in PTP1B, and the solvent peak DMSO was located at approximately 2.5 ppm. The peaks of PTP1B without FYGL-3-P present in the range of 3.2–4.4 and 4.5–4.6 ppm were relatively sharp. However, with the influence of FYGL-3-P, peaks in these regions were significantly broadened and the peak heights were also suppressed, suggesting that the interaction between PTP1B and FYGL-3-P was strong. However, with the influence of FYGL-1, the change of the PTP1B NMR signal was hardly observed, indicating that the interaction between PTP1B and FYGL-1 was much weaker than that between PTP1B and FYGL-3-P. These results firmly supported the conclusions from ITC analysis and MD simulations, suggesting that the inhibition effects of FYGL against PTP1B mainly resulted from the strong interaction between PTP1B and FYGL-3-P.
Figure 8.
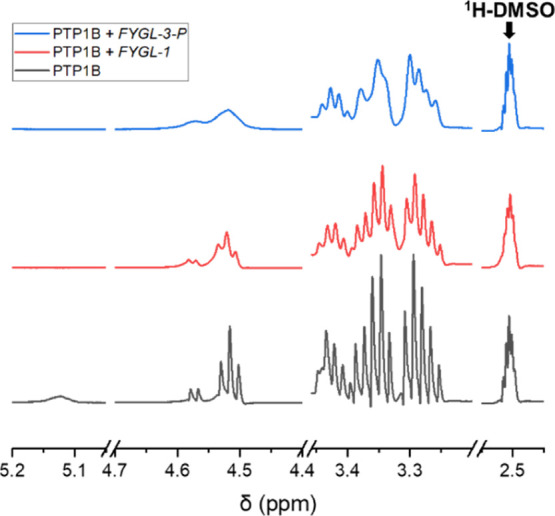
1H NMR spectra of 1.0 mg/mL PTP1B in DMSO-d6 influenced by 0.1 mg/mL FYGL-1 or FYGL-3-P.
Conclusions
PTP1B is a key negative regulator of insulin and an effective target for the treatment of T2D. A natural hyperbranched proteoglycan FYGL, extracted from G. lucidum, has been demonstrated capable of inhibiting the activity of PTP1B and decreasing blood glucose in vivo. In this work, the effects and inhibition mechanism of FYGL on PTP1B activity were systematically investigated. On a cellular basis, it was demonstrated that the proteoglycan or the protein components isolated from FYGL (i.e., FYGL-2, FYGL-3, and FYGL-3-P) significantly ameliorated PTP1B-induced insulin resistance in HepG2 cells, while the FYGL-1 polysaccharide failed to work. Furthermore, it was found that FYGL-3 was more effective in inhibiting the catalytic activity of PTP1B than others, and the FYGL-3-P protein moiety played a key role in inhibiting PTP1B. The inhibition mode of FYGL-3-P against PTP1B was competitive inhibition, indicating that FYGL-3-P could bind with the catalytic sites of PTP1B. However, the FYGL-1 polysaccharide has no effects on inhibiting PTP1B activity. The FYGL-3-P protein moiety could bind strongly with PTP1B driven by favorable enthalpy, which mainly came from strong electrostatic interactions and hydrogen bonds between FYGL-3-P and PTP1B. The WPD loop and Gln262 in PTP1B were restricted by FYGL-3-P, resulting from the strong and multitargeted interactions between FYGL-3-P and PTP1B. Oppositely, the interaction between FYGL-1 and PTP1B was entropy driven and relatively weak. This work provided deep insights into the molecular mechanisms of FYGL inhibiting the activity of PTP1B and ameliorating insulin resistance and would be of great structural help in the discovery of natural PTP1B inhibitors.
Materials and Methods
Materials
PTP1B was purchased from Viva Biotech (Shanghai, China) Ltd. Diethylaminoethyl-cellulose DEAE-52 was purchased from Nanjing Dulai Biotechnology Co., Ltd. HepG2 cell lines were provided by Fuxiang Co. Ltd. (China). DMEM was purchased from Gibco Co. Ltd. (USA). Cell counting kit-8 (CCK-8) was purchased from Dojindo Co. Ltd. (China). The PTP1B plasmid was from Sino Biological Inc (China). The glucose kit (glucose oxidase method) was from Nanjing Jiancheng Bioengineering Institute (China). The Lipo8000 transfection reagent was purchased from Beyotime Biotechnology (Chain). Other reagents were all purchased from Aladdin Industrial Corporation. FYGL was prepared as described in our previous work.8
Isolation of FYGL-1, FYGL-2, FYGL-3, and FYGL-3-P
FYGL-1, FYGL-2, and FYGL-3 were separated by a DEAE-52 cellulose column in a gradient manner with 0, 0.1, and 0.3 M NaCl eluent, respectively, and the elution volume was 2, 4 ,and 6 L for 2 g of feedstock, respectively.9 The eluted fractions were dialyzed to remove NaCl and lyophilized.
The linkage between the saccharide and the protein in FYGL-3 was broken by 1 M NaBH4 and 0.1 M NaOH mixture solution at 37 °C for 48 h. The protein moiety of FYGL-3 was precipitated with saturated (NH4)2SO4 solution and then dialyzed and lyophilized in turn to obtain FYGL-3-P.
Cell Culture and Cell Viability Assay
The HepG2 cells were cultured in a DMEM supplement with 10% FBS and 1% penicillin–streptomycin at 37 °C in an atmosphere with 5% CO2.
Cell viability was assessed using the CCK-8 assay.29 The HepG2 cells were seeded with different components of FYGL in 96-well plates at 1 × 10⁵ cells/well and incubated at 37 °C for 4.5 h. The treatment time of 4.5 h was on the experience during which the cell viability of HepG2 has hardly changed with the concentration change of FYGL. Then, the cells were incubated in DMEM with 10% CCK-8 solution for another 1 h. Each sample was replicated in four wells. Ultimately, the absorbance values were measured at 450 nm by a microplate reader (Bio-Tek, USA).
Insulin-Resistance Model and Glucose Uptake in HepG2 Cells
The HepG2 cells were transferred into 6-well plates at 5 × 10⁵ cells/well for 24 h. Then, the cells were transfected with 2.5 μg of the PTP1B plasmid by using the Lipo8000 transfection reagent to establish an insulin-resistant model and incubated in serum-free DMEM with or without 100 μg/mL different components of FYGL.30 Ultimately, the cells were stimulated with 10 U/mL insulin for 25 min and incubated in serum-free DMEM media for 24 h to test glucose uptake by the glucose oxidase method as described previously.31
PTP1B Inhibition Assay
PTP1B activity was monitored according to a method previously reported using pNPP as a substrate by a microplate reader (Bio-Tek, USA).8 The pNPP substrate was dephosphorylated by PTP1B, and the concentration of the product is proportional to the optical density (OD) of absorbance at 405 nm. pNPP was treated with PTP1B in buffer solution (pH 8.0) containing 50 mM Tris and 150 mM NaCl at 37 °C with or without different components of FYGL. The activity of PTP1B was evaluated by the rate of increased OD, namely, ν. The IC50 value is a concentration of the inhibitor required to decrease the initial PTP1B activity by 50%, which was used to evaluate the inhibitory potency of the inhibitors. The inhibiting kinetic analysis was performed according to eq 2
| 2 |
where νmax is the maximum velocity, [S] is the concentration of the substrate, and Km is the corresponding constant for the substrate derived from the slope of the Lineweaver–Burk plots.32
Isothermal Titration Calorimetry
ITC is a versatile method to characterize biological binding interactions by directly detecting the heat effect upon binding. The thermogram was obtained by precision calorimetry, and the thermogram curve was fitted with a nonlinear regression fit.15 For precisely measuring the binding constant Kb, standard enthalpy ΔHΘ, and binding stoichiometry n, the initial molar ratio of protein to ligand is usually set in the range from 10 to 1000.15 In this work, PTP1B at 4 × 10⁻⁷ mol/L was dropped into 2 × 10⁻⁵ mol/L FYGL-1 or FYGL-3-P at 25 °C on PEAQ-ITC (Malvern Panalytical, England).
MD Simulation
The 3D structure of PTP1B was obtained from the RCSB PDB database and that of FYGL-3-P was predicted by I-TASSER.12−14,33 ZDOCK was used to determine the initial binding poses.34,35 The predocked PTP1B with FYGL-3-P was taken as the initial structure of the complex for the MD simulations. The MD simulations of the complexes were run within 50 ns at 310 K by using GROMACS-5.1.2,36 and CHARMM36 force field and TIP3P water configuration were used to get reliable results as much as possible.37,38 NaCl was added to neutralize the system.36 The total charges were estimated by the Amber99SB-ILDN force field and given by GROMACS.37,39 The binding free energy Gbinding was obtained from the MD results by the molecular mechanics Poisson–Boltzmann surface (MM-PBSA) approach.40
1H NMR of PTP1B with FYGL-1 or FYGL-3-P
PTP1B was dissolved in deuterated DMSO-d6 at 1.0 mg/mL in the absence or presence of 0.1 mg/mL FYGL-1 or FYGL-3-P. 1H NMR spectra were acquired with 16 scans on an AVANCE III HD 400 MHz spectrometer (Bruker BioSpin International, Switzerland).
Statistical Analysis
Data are presented as means ± standard error (S.E.). The one-way ANOVA test was performed to analyze the statistical significance between the two groups. A p-value less than 0.05 (p < 0.05) is considered statistically significant.
Acknowledgments
This work was supported by the National Natural Science Foundation of China (nos. 21374022 and 81374032), the National Health Commission of the People’s Republic of China (no. 2017ZX09301006), and Science and Technology Commission of Shanghai Municipality (no. 17401902700).
Accession Codes
PTP1B: UniProtKB—P18031 (PTN1_HUMAN).
The authors declare no competing financial interest.
References
- Goldstein B. J.; Bittner-Kowalczyk A.; White M. F.; Harbeck M. Tyrosine dephosphorylation and deactivation of insulin receptor substrate-1 by protein-tyrosine phosphatase 1B: possible facilitation by the formation of a ternary complex with the Grb2 adaptor protein. J. Biol. Chem. 2000, 275, 4283–4289. 10.1074/jbc.275.6.4283. [DOI] [PubMed] [Google Scholar]
- Zhang S.; Zhang Z. Y. PTP1B as a drug target: recent developments in PTP1B inhibitor discovery. Drug Discov. Today 2007, 12, 373–381. 10.1016/j.drudis.2007.03.011. [DOI] [PubMed] [Google Scholar]
- van der Hem L. G.; van der Vliet J. A.; Bocken C. F. M.; Kino K.; Hoitsma A. J.; Tax W. J. M. Ling Zhi-8: studies of a new immunomodulating agent. Transplantation 1995, 60, 438–443. 10.1097/00007890-199509000-00006. [DOI] [PubMed] [Google Scholar]
- Sun J.; He H.; Xie B. J. Novel antioxidant peptides from fermented mushroom Ganoderma lucidum. J. Agric. Food Chem. 2004, 52, 6646–6652. 10.1021/jf0495136. [DOI] [PubMed] [Google Scholar]
- Paterson R. R. M. Ganoderma - a therapeutic fungal biofactory. Phytochemistry 2006, 67, 1985–2001. 10.1016/j.phytochem.2006.07.004. [DOI] [PubMed] [Google Scholar]
- Soong R.; Brender J. R.; Macdonald P. M.; Ramamoorthy A. Association of highly compact type II diabetes related islet amyloid polypeptide intermediate species at physiological temperature revealed by diffusion NMR spectroscopy. J. Am. Chem. Soc. 2009, 131, 7079–7085. 10.1021/ja900285z. [DOI] [PubMed] [Google Scholar]
- Hassan H. M.; Mahran Y. F.; Ghanim A. M. H. Ganoderma lucidum ameliorates the diabetic nephropathy via down-regulatory effect on TGFbeta-1 and TLR-4/NFkappaB signalling pathways. J. Pharm. Pharmacol. 2021, 73, 1250–1261. 10.1093/jpp/rgab058. [DOI] [PubMed] [Google Scholar]
- Teng B.-S.; Wang C.-D.; Yang H.-J.; Wu J.-S.; Zhang D.; Zheng M.; Fan Z.-H.; Pan D.; Zhou P. A protein tyrosine phosphatase 1B activity inhibitor from the fruiting bodies of Ganoderma lucidum (Fr.) Karst and its hypoglycemic potency on streptozotocin-induced type 2 diabetic mice. J. Agric. Food Chem. 2011, 59, 6492–6500. 10.1021/jf200527y. [DOI] [PubMed] [Google Scholar]
- Pan D.; Wang L.; Chen C.; Hu B.; Zhou P. Isolation and characterization of a hyperbranched proteoglycan from Ganoderma lucidum for anti-diabetes. Carbohydr. Polym. 2015, 117, 106–114. 10.1016/j.carbpol.2014.09.051. [DOI] [PubMed] [Google Scholar]
- Pan D.; Wang L.; Chen C.; Teng B.; Wang C.; Xu Z.; Hu B.; Zhou P. Structure characterization of a novel neutral polysaccharide isolated from Ganoderma lucidum fruiting bodies. Food Chem. 2012, 135, 1097–1103. 10.1016/j.foodchem.2012.05.071. [DOI] [PubMed] [Google Scholar]
- Pan D.; Wang L.; Hu B.; Zhou P. Structural characterization and bioactivity evaluation of an acidic proteoglycan extract from Ganoderma lucidum fruiting bodies for PTP1B inhibition and anti-diabetes. Biopolymers 2014, 101, 613–623. 10.1002/bip.22426. [DOI] [PubMed] [Google Scholar]
- Yang J.; Yan R.; Roy A.; Xu D.; Poisson J.; Zhang Y. The I-TASSER Suite: protein structure and function prediction. Nat. Methods 2015, 12, 7–8. 10.1038/nmeth.3213. [DOI] [PMC free article] [PubMed] [Google Scholar]
- Roy A.; Kucukural A.; Zhang Y. I-TASSER: a unified platform for automated protein structure and function prediction. Nat. Protoc. 2010, 5, 725–738. 10.1038/nprot.2010.5. [DOI] [PMC free article] [PubMed] [Google Scholar]
- Yang J.; Zhang Y. I-TASSER server: new development for protein structure and function predictions. Nucleic Acids Res. 2015, 43, W174–W181. 10.1093/nar/gkv342. [DOI] [PMC free article] [PubMed] [Google Scholar]
- Freire E.; Mayorga O. L.; Straume M. Isothermal titration calorimetry. Anal. Chem. 1990, 62, 950A–959A. 10.1021/ac00217a002. [DOI] [Google Scholar]
- Ladbury J. E.; Chowdhry B. Z. Sensing the heat: the application of isothermal titration calorimetry to thermodynamic studies of biomolecular interactions. Chem. Biol. 1996, 3, 791–801. 10.1016/s1074-5521(96)90063-0. [DOI] [PubMed] [Google Scholar]
- Campoy A. V.; Freire E. ITC in the post-genomic era...? Priceless. Biophys. Chem. 2005, 115, 115–124. 10.1016/j.bpc.2004.12.015. [DOI] [PubMed] [Google Scholar]
- Velazquez-Campoy A.; Freire E. Isothermal titration calorimetry to determine association constants for high-affinity ligands. Nat. Protoc. 2006, 1, 186–191. 10.1038/nprot.2006.28. [DOI] [PubMed] [Google Scholar]
- Buch I.; Giorgino T.; De Fabritiis G. Complete reconstruction of an enzyme-inhibitor binding process by molecular dynamics simulations. Proc. Natl. Acad. Sci. U. S. A. 2011, 108, 10184–10189. 10.1073/pnas.1103547108. [DOI] [PMC free article] [PubMed] [Google Scholar]
- Sixto-López Y.; Bello M.; Correa-Basurto J. Insights into structural features of HDAC1 and its selectivity inhibition elucidated by Molecular dynamic simulation and Molecular Docking. Expet Rev. Clin. Immunol. 2019, 37, 584. 10.1080/07391102.2018.1441072. [DOI] [PubMed] [Google Scholar]
- Johnson T. O.; Ermolieff J.; Jirousek M. R. Protein tyrosine phosphatase 1B inhibitors for diabetes. Nat. Rev. Drug Discov. 2002, 1, 696–709. 10.1038/nrd895. [DOI] [PubMed] [Google Scholar]
- Peters G. H.; Iversen L. F.; Branner S.; Andersen H. S.; Mortensen S. B.; Olsen O. H.; Møller K. B.; Møller N. P. H. Residue 259 is a key determinant of substrate specificity of protein-tyrosine phosphatases 1B and alpha. J. Biol. Chem. 2000, 275, 18201–18209. 10.1074/jbc.m910273199. [DOI] [PubMed] [Google Scholar]
- Kajander T.; Kahn P. C.; Passila S. H.; Cohen D. C.; Lehtiö L.; Adolfsen W.; Warwicker J.; Schell U.; Goldman A. Buried charged surface in proteins. Structure 2000, 8, 1203–1214. 10.1016/s0969-2126(00)00520-7. [DOI] [PubMed] [Google Scholar]
- Bryant R. G. NMR relaxation studies of solute-solvent interactions. Annu. Rev. Phys. Chem. 1978, 29, 167–188. 10.1146/annurev.pc.29.100178.001123. [DOI] [Google Scholar]
- Lipari G.; Szabo A. Model-free approach to the interpretation of nuclear magnetic resonance relaxation in macromolecules. 1. Theory and range of validity. J. Am. Chem. Soc. 1982, 104, 4546–4559. 10.1021/ja00381a009. [DOI] [Google Scholar]
- Clore G. M.; Iwahara J. Theory, practice, and applications of paramagnetic relaxation enhancement for the characterization of transient low-population states of biological macromolecules and their complexes. Chem. Rev. 2009, 109, 4108–4139. 10.1021/cr900033p. [DOI] [PMC free article] [PubMed] [Google Scholar]
- Caillon L.; Duma L.; Lequin O.; Khemtemourian L. Cholesterol modulates the interaction of the islet amyloid polypeptide with membranes. Mol. Membr. Biol. 2014, 31, 239–249. 10.3109/09687688.2014.987182. [DOI] [PubMed] [Google Scholar]
- Niu Z.; Prade E.; Malideli E.; Hille K.; Jussupow A.; Mideksa Y. G.; Yan L. M.; Qian C.; Fleisch M.; Messias A. C.; Sarkar R.; Sattler M.; Lamb D. C.; Feige M. J.; Camilloni C.; Kapurniotu A.; Reif B. Structural Insight into IAPP-Derived Amyloid Inhibitors and Their Mechanism of Action. Angew. Chem., Int. Ed. Engl. 2020, 59, 5771. 10.1002/anie.201914559. [DOI] [PMC free article] [PubMed] [Google Scholar]
- Huang W.; Huang F.; Lei Z.; Luo H. LncRNA SNHG11 Promotes Proliferation, Migration, Apoptosis, and Autophagy by Regulating hsa-miR-184/AGO2 in HCC. OncoTargets Ther. 2020, 13, 413–421. 10.2147/ott.s237161. [DOI] [PMC free article] [PubMed] [Google Scholar]
- Wang N.; Zhang D. L.; Mao X. Q.; Zou F.; Jin H.; Ouyang J. P. Astragalus polysaccharides decreased the expression of PTP1B through relieving ER stress induced activation of ATF6 in a rat model of type 2 diabetes. Mol. Cell. Endocrinol. 2009, 307, 89–98. 10.1016/j.mce.2009.03.001. [DOI] [PubMed] [Google Scholar]
- Visvanathan R.; Jayathilake C.; Liyanage R. A simple microplate-based method for the determination of alpha-amylase activity using the glucose assay kit (GOD method). Food Chem. 2016, 211, 853–859. 10.1016/j.foodchem.2016.05.090. [DOI] [PubMed] [Google Scholar]
- Yuan C.; Lu L.; Gao X.; Wu Y.; Guo M.; Li Y.; Fu X.; Zhu M. Ternary oxovanadium(IV) complexes of ONO-donor Schiff base and polypyridyl derivatives as protein tyrosine phosphatase inhibitors: synthesis, characterization, and biological activities. J. Biol. Chem. 2009, 14, 841–851. 10.1007/s00775-009-0496-6. [DOI] [PubMed] [Google Scholar]
- Patil S. M.; Xu S.; Sheftic S. R.; Alexandrescu A. T. Dynamic alpha-helix structure of micelle-bound human amylin. J. Biol. Chem. 2009, 284, 11982–11991. 10.1074/jbc.m809085200. [DOI] [PMC free article] [PubMed] [Google Scholar]
- Pierce B. G.; Wiehe K.; Hwang H.; Kim B.-H.; Vreven T.; Weng Z. ZDOCK server: interactive docking prediction of protein-protein complexes and symmetric multimers. Bioinformatics 2014, 30, 1771–1773. 10.1093/bioinformatics/btu097. [DOI] [PMC free article] [PubMed] [Google Scholar]
- Trott O.; Olson A. J. AutoDock Vina: improving the speed and accuracy of docking with a new scoring function, efficient optimization, and multithreading. J. Comput. Chem. 2010, 31, 455–461. 10.1002/jcc.21334. [DOI] [PMC free article] [PubMed] [Google Scholar]
- Van Der Spoel D.; Lindahl E.; Hess B.; Groenhof G.; Mark A. E.; Berendsen H. J. C. GROMACS: fast, flexible, and free. J. Comput. Chem. 2005, 26, 1701–1718. 10.1002/jcc.20291. [DOI] [PubMed] [Google Scholar]
- Lindorff-Larsen K.; Piana S.; Palmo K.; Maragakis P.; Klepeis J. L.; Dror R. O.; Shaw D. E. Improved side-chain torsion potentials for the Amber ff99SB protein force field. Proteins 2010, 78, 1950–1958. 10.1002/prot.22711. [DOI] [PMC free article] [PubMed] [Google Scholar]
- Liang G.; Zhao J.; Yu X.; Zheng J. Comparative molecular dynamics study of human islet amyloid polypeptide (IAPP) and rat IAPP oligomers. Biochemistry 2013, 52, 1089–1100. 10.1021/bi301525e. [DOI] [PubMed] [Google Scholar]
- Wang J.; Cieplak P.; Kollman P. A. How well does a restrained electrostatic potential (RESP) model perform in calculating conformational energies of organic and biological molecules?. J. Comput. Chem. 2000, 21, 1049–1074. . [DOI] [Google Scholar]
- Paissoni C.; Spiliotopoulos D.; Musco G.; Spitaleri A. GMXPBSA 2.1: A GROMACS tool to perform MM/PBSA and computational alanine scanning. Comput. Phys. Commun. 2015, 186, 105–107. 10.1016/j.cpc.2014.09.010. [DOI] [Google Scholar]


