

Abstract
Standard dual-energy computed tomography (CT) uses two different x-ray energies to obtain energy-dependent tissue attenuation information to allow quantitative material decomposition. The combined use of dual-energy CT and positron emission tomography (PET) may provide a more comprehensive characterization of disease states in cancer and other diseases. However, the integration of dual-energy CT with PET is not trivial, either requiring costly hardware upgrades or increasing radiation exposure. This paper proposes a different dual-energy CT imaging method that is enabled by PET. Instead of using a second x-ray CT scan with a different energy, this method exploits time-of-flight PET image reconstruction via the maximum likelihood attenuation and activity (MLAA) algorithm to obtain a 511 keV gamma-ray attenuation image from PET emission data. The high-energy gamma-ray attenuation image is then combined with the low-energy x-ray CT of PET/CT to provide a pair of dual-energy CT images. A major challenge with the standard MLAA reconstruction is the high noise present in the reconstructed 511 keV attenuation map, which would not compromise the PET activity reconstruction too much but may significantly affect the performance of the gamma-ray attenuation image for material decomposition. To overcome the problem, we further propose a kernel MLAA algorithm to exploit the prior information from the available x-ray CT image. We conducted a computer simulation to test the concept and algorithm for the task of material decomposition. The simulation results demonstrate that this PET-enabled dual-energy CT method is promising for quantitative material decomposition. The proposed method can be readily implemented on time-of-flight PET/CT scanners to enable simultaneous PET and dual-energy CT imaging.
Keywords: time-of-flight PET, dual-energy CT, image reconstruction, kernel methods, material decomposition
1. Introduction
Dual-energy (DE) computed tomography (CT) has gained increasing popularity in recent years thanks to its capability of differentiating tissue materials (McCollough et al 2015). Different from traditional CT imaging that commonly uses single x-ray energy (≤140 keV), DECT employs two different x-ray energies, one at a lower level (e.g. 50 keV) and the other at a higher level (e.g. 80 keV), to scan the same object either sequentially by two scans or simultaneously by two x-ray sources. It obtains energy-dependent attenuation information of tissue properties and allows quantitative material decomposition (McCollough et al 2020).
Because DECT brings a dimension of information that is distinct from what positron emission tomography (PET) offers, a combined use of PET and DECT has a potential to improve existing PET/CT imaging for clinical applications. DECT can be used for improving attenuation correction for PET (Noh et al 2009, Xia et al 2014) or combined with PET to provide a more comprehensive characterization of diseases (De Cecco et al 2018, Wu et al 2020). Integration of DECT with PET, however, would not be trivial. Direct replacement of traditional single-energy CT with new DECT is costly because DECT has a different scanner configuration and its price is higher than that of single-energy CT. Utilization of existing single-energy CT scanners is possible but requires a protocol change and is associated with increased radiation exposure and scanning cost. Another option is sequential two-step PET/DECT imaging on separate scanners, i.e. a PET/CT scan followed by a DECT scan or vice versa. This method, however, has all the disadvantages of separate PET and CT imaging before the invention of integrated PET/CT scanners, including the difficulty of image fusion, extended imaging time, and increased radiation exposure (Townsend 2008).
We propose a different dual-energy CT imaging method that is enabled by the already-available PET data on PET/CT instead of using a second x-ray CT scan with a different energy. This PET-enabled dual-energy CT method does not require a change of scanner hardware of PET/CT or add additional radiation dose or scan time. It only requires a standard PET/CT scan on a time-of-flight (TOF) PET/CT scanner. The assumption is that a high-energy gamma-ray attenuation image can be reliably obtained from time-of-flight PET emission data. The PET-enabled ‘γ-ray computed tomography (GCT)’ image is then combined with the x-ray CT image (available in PET/CT) to produce a pair of dual-energy CT images.
The theoretical foundation of this idea is supported by the advances in statistical image reconstruction of time-of-flight PET emission scan data for joint estimation of radiotracer activity and attenuation (Defrise et al 2012, Rezaei et al 2012, Nuyts et al 2018). Theoretical analysis and practical studies have demonstrated that the gamma-ray attenuation image at 511 keV can be jointly estimated with the reconstruction of PET activity image from time-of-flight PET emission data, for example, using the maximum likelihood attenuation and activity (MLAA) reconstruction algorithm (Nuyts et al 1999, Rezaei et al 2012). Previous attention on this topic has been given to achieve transmission-less PET imaging by excluding the x-ray CT component (e.g. Defrise et al 2014, Rezaei et al 2014, Li et al 2015, Berker and Li 2016, Feng et al 2018, Cheng et al 2020). Existing studies were also primarily aimed to improve the aspect of attenuation correction for PET activity image reconstruction for PET/CT (e.g. Panin et al 2013, Presotto et al 2016, Bousse et al 2016, Rezaei et al 2018) or PET/MR (e.g. Mehranian and Zaidi 2015, Benoit et al 2016, Heuer et al 2017, Ahn et al 2018, Hwang et al 2018, Rezaei et al 2019). The GCT image itself did not receive much attention and no work explored it for dual-energy or multi-energy CT spectral imaging, which however is the focus of the proposed work.
One challenge with using the standard MLAA reconstruction to enable the proposed PET-enabled dual-energy CT method is that the estimated GCT image by MLAA is commonly noisy, see Panin et al (2013) for an example. While the noise would not significantly compromise the performance for PET activity image reconstruction if the usage is for PET attenuation correction, it may largely affect the quantitative accuracy of the GCT for multi-material decomposition.
To suppress the noise, we note that the GCT image shares the same anatomical structures as the x-ray CT image because both reflect the linear attenuation maps, though at different energies. Therefore, we propose to utilize the already available x-ray CT image as the a priori information to guide the reconstruction of GCT from the PET emission data. To incorporate image prior, previous image reconstruction methods commonly employ an explicit regularization form (e.g. Bowsher et al 1996, Mehranian and Zaidi 2015) which can be complex for practical implementation. Regularization-based methods also often require a convergent solution to achieve the optimal performance, which is computationally costly. In comparison, the kernel method (Wang and Qi 2015, Hutchcroft et al 2016, Novosad and Reader 2016, Bland et al 2018, Gong et al 2018, Deidda et al 2019, Wang 2019) encodes image prior information in the forward model of tomographic image reconstruction and requires no explicit regularization. It is easier to implement and can be more efficient and better improve PET image reconstruction than regularization-based methods (Wang and Qi 2015, Hutchcroft et al 2016). In this work, we adopt the kernel framework and develop a kernel MLAA algorithm to incorporate the x-ray CT image prior knowledge for the MLAA attenuation image reconstruction.
Part of this work was presented in the 2018 IEEE Nuclear Science Symposium and Medical Imaging Conference (Wang 2018). Compared to its conference version, this paper has been substantially extended by including the development and validation of the kernel MLAA algorithm to solve the noise challenge and a more comprehensive computer simulation study to demonstrate the feasibility of the proposed PET-enabled dual-energy CT method.
2. Proposed PET-enabled dual-energy CT method
2.1. The idea
As illustrated in figure 1, a standard PET/CT scan normally consists of a PET emission scan at 511 keV and a x-ray CT transmission scan commonly acquired at 80–140 kVp. X-ray CT in PET/CT is mainly used for PET attenuation correction with which the PET scan provides a functional image to describe the radiotracer distribution in the subject. Our proposed method exploits the potential of a standard PET emission scan for additional high-energy GCT imaging. Different from the x-ray CT which uses an external x-ray source to generate tomographic data, here the PET-enabled GCT exploits the internal ‘γ-rays’ generated by annihilation radiation of PET radiotracer decay in the object. The GCT image obtained from PET is then combined with the low-energy x-ray CT to form dual-energy CT imaging.
Figure 1.

The PET-enabled dual-energy CT imaging method exploits the annihilation radiation of PET radiotracer decays as an internal ‘γ-ray’ source to reconstruct a high-energy attenuation image from PET emission data, which is then combined with the low-energy x-ray CT image to form a dual-energy CT image pair.
There are potentially multiple methods for obtaining a GCT image from PET. In this paper, we exploit a joint attenuation-activity image reconstruction method, as described below.
2.2. Joint reconstruction of GCT image from PET emission data
PET projection measurement y can be well modeled as independent Poisson random variables with the following log-likelihood function:
| (1) |
with a constant neglected, where i denotes the index of PET detector pair and m denotes the index of time-of-flight (TOF) bin. Nd is the total number of detector pairs and Nt is the number of TOF bins. The expectation of the PET projection data is related to the PET radiotracer activity image λ and object attenuation image μ at 511 keV through
| (2) |
where Gm is the PET detection probability matrix for the mth TOF bin and r accounts for the expectation of random and scattered events. nm(μ) is the normalization factor for TOF bin m, of which the ith element is
| (3) |
where ci,m denotes the multiplicative factor excluding the attenuation correction factor, and A is the system matrix for transmission imaging.
For standard PET/CT imaging, the attenuation image μ is normally predetermined from a x-ray CT scan and the PET reconstruction problem only estimates the λ image (Qi and Leahy 2006). μ can be approximated from a x-ray CT scan using a bilinear scaling conversion from an x-ray energy (e.g. 140 kVp) to 511 keV (Kinahan et al 2003).
The maximum-likelihood attenuation and activity (MLAA) estimation method (Nuyts et al 1999, Rezaei et al 2012) seeks the estimates of both μ and λ simultaneously by maximizing the Poisson log-likelihood:
| (4) |
The MLAA formulation was first proposed for non-TOF data (Nuyts et al 1999) but the simultaneous estimation suffers from cross-talk artifacts despite some encouraging results (Nuyts et al 1999, Dicken 1999). The method was later demonstrated more effective for TOF data (Salomon et al 2011, Conti 2011). A seminal theoretical work later proved that TOF data determine μ up to a constant (Defrise et al 2012, Rezaei et al 2012). Since then, the MLAA method has received a wide range of interests (e.g. Panin et al 2013, Defrise et al 2014, Rezaei et al 2014, Mehranian and Zaidi 2015, Li et al 2015, Presotto et al 2016, Bousse et al 2016, Berker and Li 2016, Benoit et al 2016, Heuer et al 2017, Feng et al 2018, Rezaei et al 2018, Ahn et al 2018, Hwang et al 2018, Rezaei et al 2019, Cheng et al 2020).
It is worth noting that previous attention of MLAA reconstruction was focused on PET attenuation correction. In this paper, we exploit the MLAA reconstruction differently. We propose to combine the GCT image μ with the x-ray CT image to obtain a dual-energy CT image pair to enable multi-material decomposition.
2.3. Multi-material decomposition (MMD)
For each image pixel j, the high-energy GCT attenuation value μj and the low-energy x-ray CT attenuation value xj form a pair of dual-energy measurements uj. The tissue compositions are then described by a set of material bases, for example, air (A), soft tissue (S) or equivalently water, and bone (B) or calcium:
| (5) |
where the coefficients ρj,k with k = {A, S, B} are the fraction of each basis material in pixel j and subject to
| (6) |
The material basis matrix U consists of the linear attenuation coefficients of each basis material measured at the low and high energies. The estimates of ρj are obtained using the following least-square optimization for each image pixel:
| (7) |
3. Improved GCT reconstruction using kernel MLAA
3.1. Use of x-ray CT image prior
The GCT by standard MLAA reconstruction is commonly noisy. To suppress the noise, we propose to utilize available x-ray CT in PET/CT as an image prior. As illustrated in figure 2, the higher contrast and potentially much better image quality provided by a x-ray CT image can be beneficial to guide the reconstruction of a γ-ray CT image. In this work, we apply the kernel method (Wang and Qi 2015, Hutchcroft et al 2016, Novosad and Reader 2016, Bland et al 2018, Gong et al 2018, Deidda et al 2019, Wang 2019) which was originally developed for dynamic PET reconstruction (e.g. Wang and Qi 2015, Gong et al 2018, Wang 2019) and dual-modality imaging such as PET/MR (e.g. Hutchcroft et al 2016, Novosad and Reader 2016, Bland et al 2018). Here we extend the kernel method to exploit low-energy x-ray CT image prior for reconstruction of 511 keV GCT image from PET emission data.
Figure 2.

Patches {fj} extracted from a x-ray CT image x can be used to build the kernel representation of the intensity in pixel j of the γ-ray CT image μ.
3.2. Kernel representation of GCT image
With an x-ray CT image x, we can extract a ‘data point’ fj for each pixel j from the image, for example, using the image patch centered at j (figure 2). A transformed feature space can be defined by a non-linear mapping function ϕ, which transforms the low-dimensional space {fj} to a very-high dimensional space {ϕ(fj)}. In the high-dimensional feature space, the intensity of the GCT in pixel j can be described as a linear function, μj = wTϕ(fj), where w denotes the coefficient vector. Because w also sits in the feature space, i.e. w = ∑lαlϕ(fl), we then have the following equivalent kernel representation for μj:
| (8) |
where the kernel function κ(·,·) is defined as the inner product of the two feature vectors ϕ(fj) and ϕ(fl). The form of the kernel function can be directly defined without knowing the specific form of ϕ. For example, the radial Gaussian kernel is
| (9) |
which corresponds to a ϕ of infinite dimension. σ is a hyper-parameter.
The matrix-vector form of the kernel representation for the GCT image is
| (10) |
where K is the kernel matrix built on the x-ray image x with its (j, l)th element equal to κ(fj, fl). The unknown parameter vector α denotes the corresponding kernel coefficient image. Although with a large matrix size, K can be built to be sparse to make a practical implementation. More details about the kernel matrix construction is referred to Wang and Qi (2015).
3.3. Kernel MLAA
Inserting the kernel representation in equation (10) into the original MLAA formulation leads to a kernelized optimization problem as follows:
| (11) |
Once is obtained, the final estimate of the GCT image is obtained by
| (12) |
To solve the optimization problem, we use the same alternating optimization strategy as used in Rezaei et al (2012). Each iteration of the algorithm consists of two separate λ-step and α-step:
| (13) |
| (14) |
3.3.1. λ-estimation step
The λ-step is a maximum-likelihood PET reconstruction problem which can be easily solved using the standard expectation-maximum (EM) algorithm (Shepp and Vardi 1982):
| (15) |
where n denotes the inner iteration number and the superscript T denotes matrix or vector transpose. is the sensitivity image defined by
| (16) |
3.3.2. α-estimation step
The α-step is a kernel maximum-likelihood transmission reconstruction (MLTR) problem (Erdogan and Fessler 1999b) for time-of-flight PET data,
| (17) |
where hi,m(ℓ) is the negative likelihood function,
| (18) |
with .
The kernel MLTR problem can be solved using the optimization transfer principle in Erdogan and Fessler (1999b, 1999c) by constructing the following quadratic surrogate:
| (19) |
where is an intermediate GCT sinogram,
| (20) |
and is an intermediate weight sinogram,
| (21) |
In the above equations, with μn = Kαn. is the optimum curvature defining a quadratic surrogate function that majorizes the function hi,m(ℓ) (Erdogan and Fessler 1999b) at ,
| (22) |
where [·]+ = max(0,·) applies the non-negativity constraint. and are the the first and second derivatives of hi,m(ℓ), respectively (Erdogan and Fessler 1999b).
The surrogate function Q (α; αn) minorizes the original likelihood function L and meets
| (23) |
| (24) |
where ∇ denotes the gradient with respect to α.
By treating ‘AK’ as a single matrix, maximization of Q(α; αn) can be solved using the separable quadratic surrogate (SQS) algorithm (Erdogan and Fessler 1999c),
| (25) |
where gn is the gradient of Q(α; αn),
| (26) |
and ωn is an intermediate weight image,
| (27) |
with 1 denoting the all-one vector.
Following the optimization transfer principle (Erdogan and Fessler 1999b), the update given by equation (25) is guaranteed to monotonically increase the original Poisson log likelihood, i.e.
| (28) |
4. Validation using computer simulation
4.1. Computer simulation setup
We simulated the GE Discovery 690 PET/CT scanner in 2D. The TOF timing resolution of this PET scanner was about 550 ps. The simulation was conducted using the XCAT phantom. The true PET activity image and 511 keV attenuation image are shown in figures 3(a) and (b), respectively. The images were first forward projected to generate noise-free PET sinogram of eleven TOF bins. For each TOF bin m, a uniform background was included to simulate the random and scattered events rm with the value in each detector bin equal to 40% of the averaged value of the noise-free sinogram across all detector bins. Poisson noise was then generated using 5 million expected events, unless specified otherwise. The x-ray CT image at a low-energy 80 keV is shown in figure 3(c). The data were reconstructed into images of 180 × 180 with a pixel size of 3.9 × 3.9 mm2.
Figure 3.
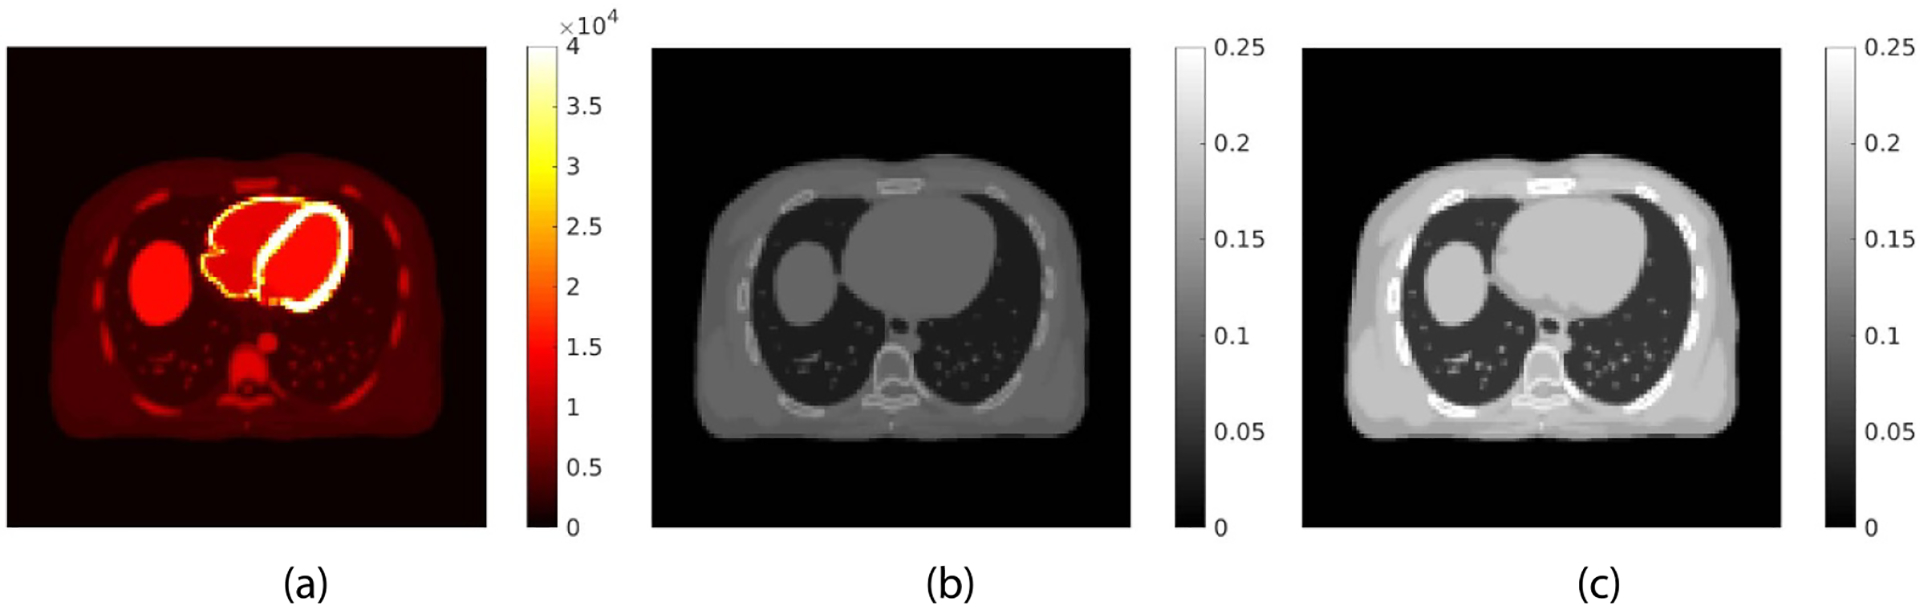
The digital phantom used in the PET/CT computer simulation. (a) PET activity image in Bq/cc; (b) PET attenuation image at 511 keV in cm−1; (c) x-ray CT image at 80 keV.
4.2. Reconstruction methods to compare
Three reconstruction algorithms were compared in this study: (1) the standard MLAA algorithm, (2) proposed kernel MLAA, and (3) post-reconstruction kernel smoothing using the same kernel matrix K. The third algorithm is also equivalent to nonlocal means denoising (Wang and Qi 2015). Using the 3 × 3 image patches extracted from the x-ray CT image x, the kernel matrix was built using 50 nearest neighbors in a way similar to Wang and Qi (2015). Each of the standard MLAA and kernel MLAA algorithms was run for 3000 iterations. Within each iteration, one inner iteration was used for the PET activity λ estimation step and five inner iterations were used for the attenuation μ estimation step.
For each reconstruction algorithm, two different initial image estimates were used for the GCT reconstruction. One is the uniform initial with (denoted as ‘UI’ in the results section) and the other is the 511 keV attenuation map converted from the x-ray CT image using a bilinear scaling (denoted as ‘CT’).
4.3. Evaluation metrics
As our main interest is in dual-energy CT imaging, we focused the evaluation on the CT side and did not specifically evaluate the algorithms for PET activity reconstruction.
The quality of GCT was first assessed using the image mean squared error (MSE) defined by
| (29) |
where is an image estimate of GCT obtained with one of the MLAA reconstruction methods and μtrue denotes the ground truth of GCT image.
For evaluating quantification, we also calculated the ensemble bias and standard deviation (SD) of the mean intensity in regions of interest (ROI) by
| (30) |
| (31) |
where ctrue is the noise-free regional intensity and denotes the mean of Nr realizations. Nr = 5 in this study. In addition to the comparison for GCT image quality, different reconstruction algorithms were further compared for dual-energy CT multi-material decomposition as formulated in section 2. Image MSE, ROI bias and SD were calculated for each of the material basis fraction images.
4.4. Comparison results for GCT image quality
Figure 4 shows the reconstructed GCT attenuation images at 511 keV from the noisy PET emission data using the standard MLAA and proposed kernel MLAA algorithms with 400 iterations. Both the results of using the uniform initial (UI) and CT initial are shown. It is not surprising that the CT initial provided better image quality because the initial estimate is closer to the ground truth. For both initials, the kernel MLAA achieved much better results with lower MSE than the standard MLAA reconstruction.
Figure 4.
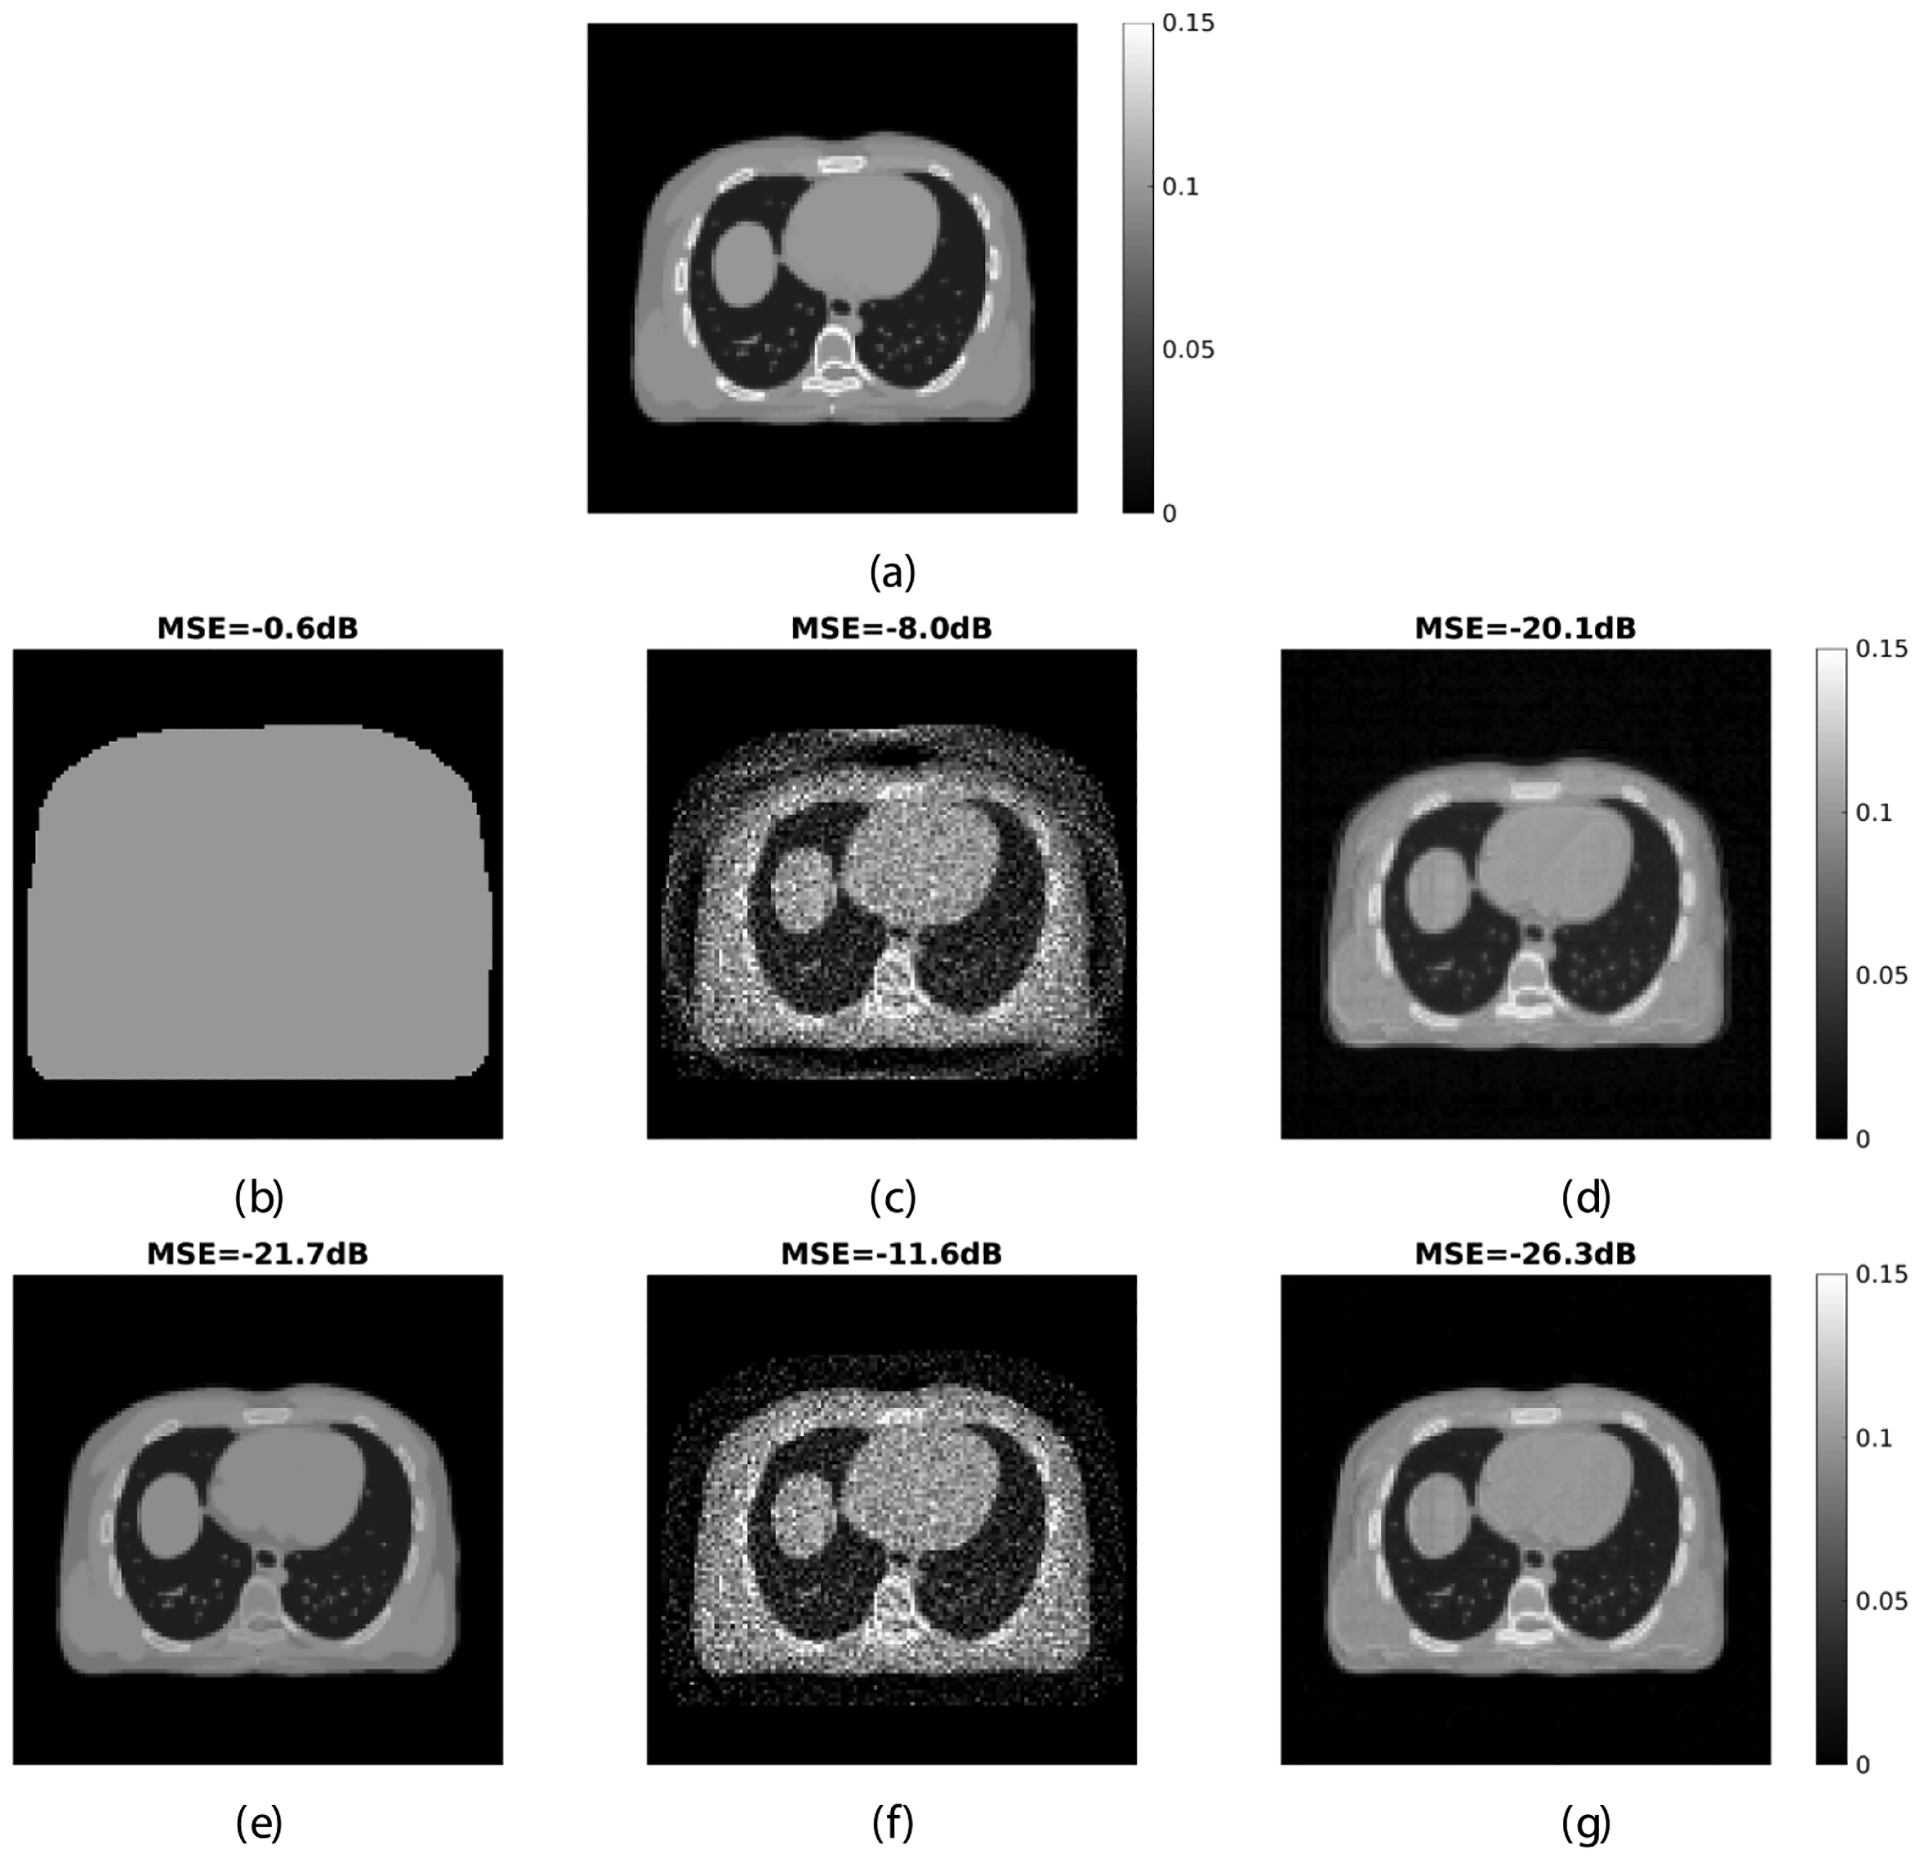
Reconstructed GCT images by different reconstruction algorithms and initial estimates. (a) Ground truth; (b)–(d) uniform initial (b) and the standard MLAA (c) and proposed kernel MLAA (d) reconstructions; (e)–(g) the CT converted initial estimate at 511 keV (e) and the corresponding standard MLAA (f) and proposed kernel MLAA (g) estimates; 400 iterations were used for the reconstructions.
Figure 5 shows the resulting MSE as a function of iteration number in different reconstruction algorithms. The post-reconstruction denoising with kernel smoothing (KS) is also included in the comparison. For all the three reconstruction algorithms, the image initials made a large difference at early iterations but not at late iterations where the image reconstructions start to converge despite the initial starting point. In all the three reconstruction approaches, the CT initial also allowed an earlier iteration stopping to get each own best MSE than the uniform initial. This is useful as less number of iteration leads to accelerated speed. While post-reconstruction denoising improved the MLAA result, the kernel MLAA achieved a larger improvement on image quality with lower MSE. Because the CT initial demonstrated better performance than the uniform initial, hereafter we mainly present further comparisons based on the CT initial.
Figure 5.
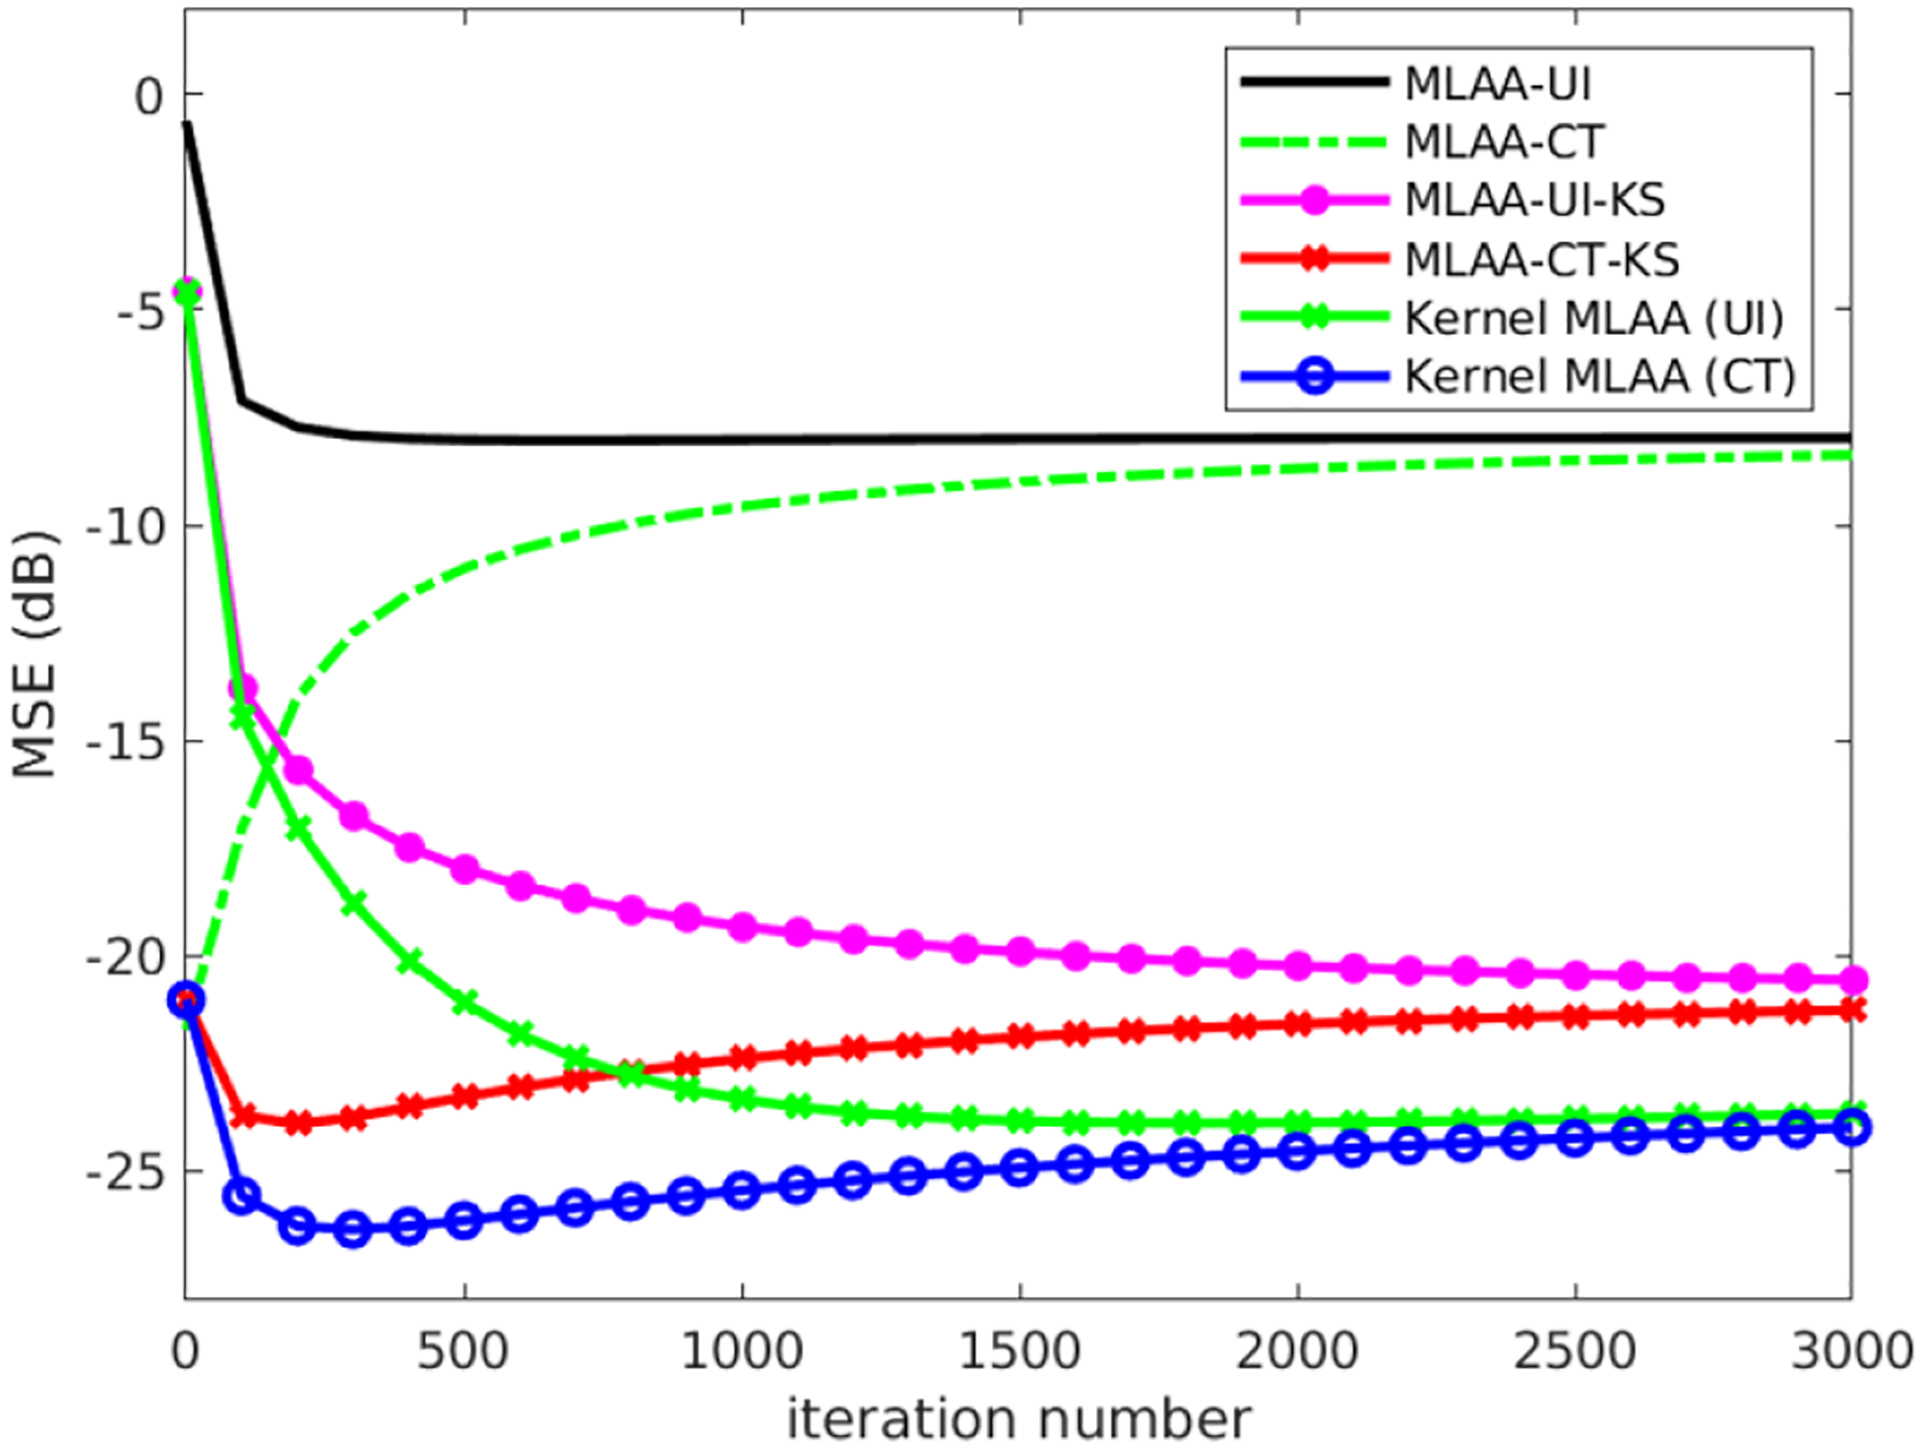
Plot of image MSE as a function of iteration for three different reconstruction algorithms (standard MLAA reconstruction, post-reconstruction denoising with kernel smoothing (KS), and kernel MLAA reconstruction) with two different image initials (uniform initial (UI) and x-ray CT-converted 511 keV attenuation map).
The effect of count level is shown in figure 6. In addition to the 5 million count level, two additional count levels (1 million and 10 million) were also included in the study. The number of iterations was fixed at 400 for each reconstruction. With increased count level, image quality by different algorithms were all increased. The kernel MLAA remains superior over the MLAA (with or without post-reconstruction smoothing) at different count levels.
Figure 6.
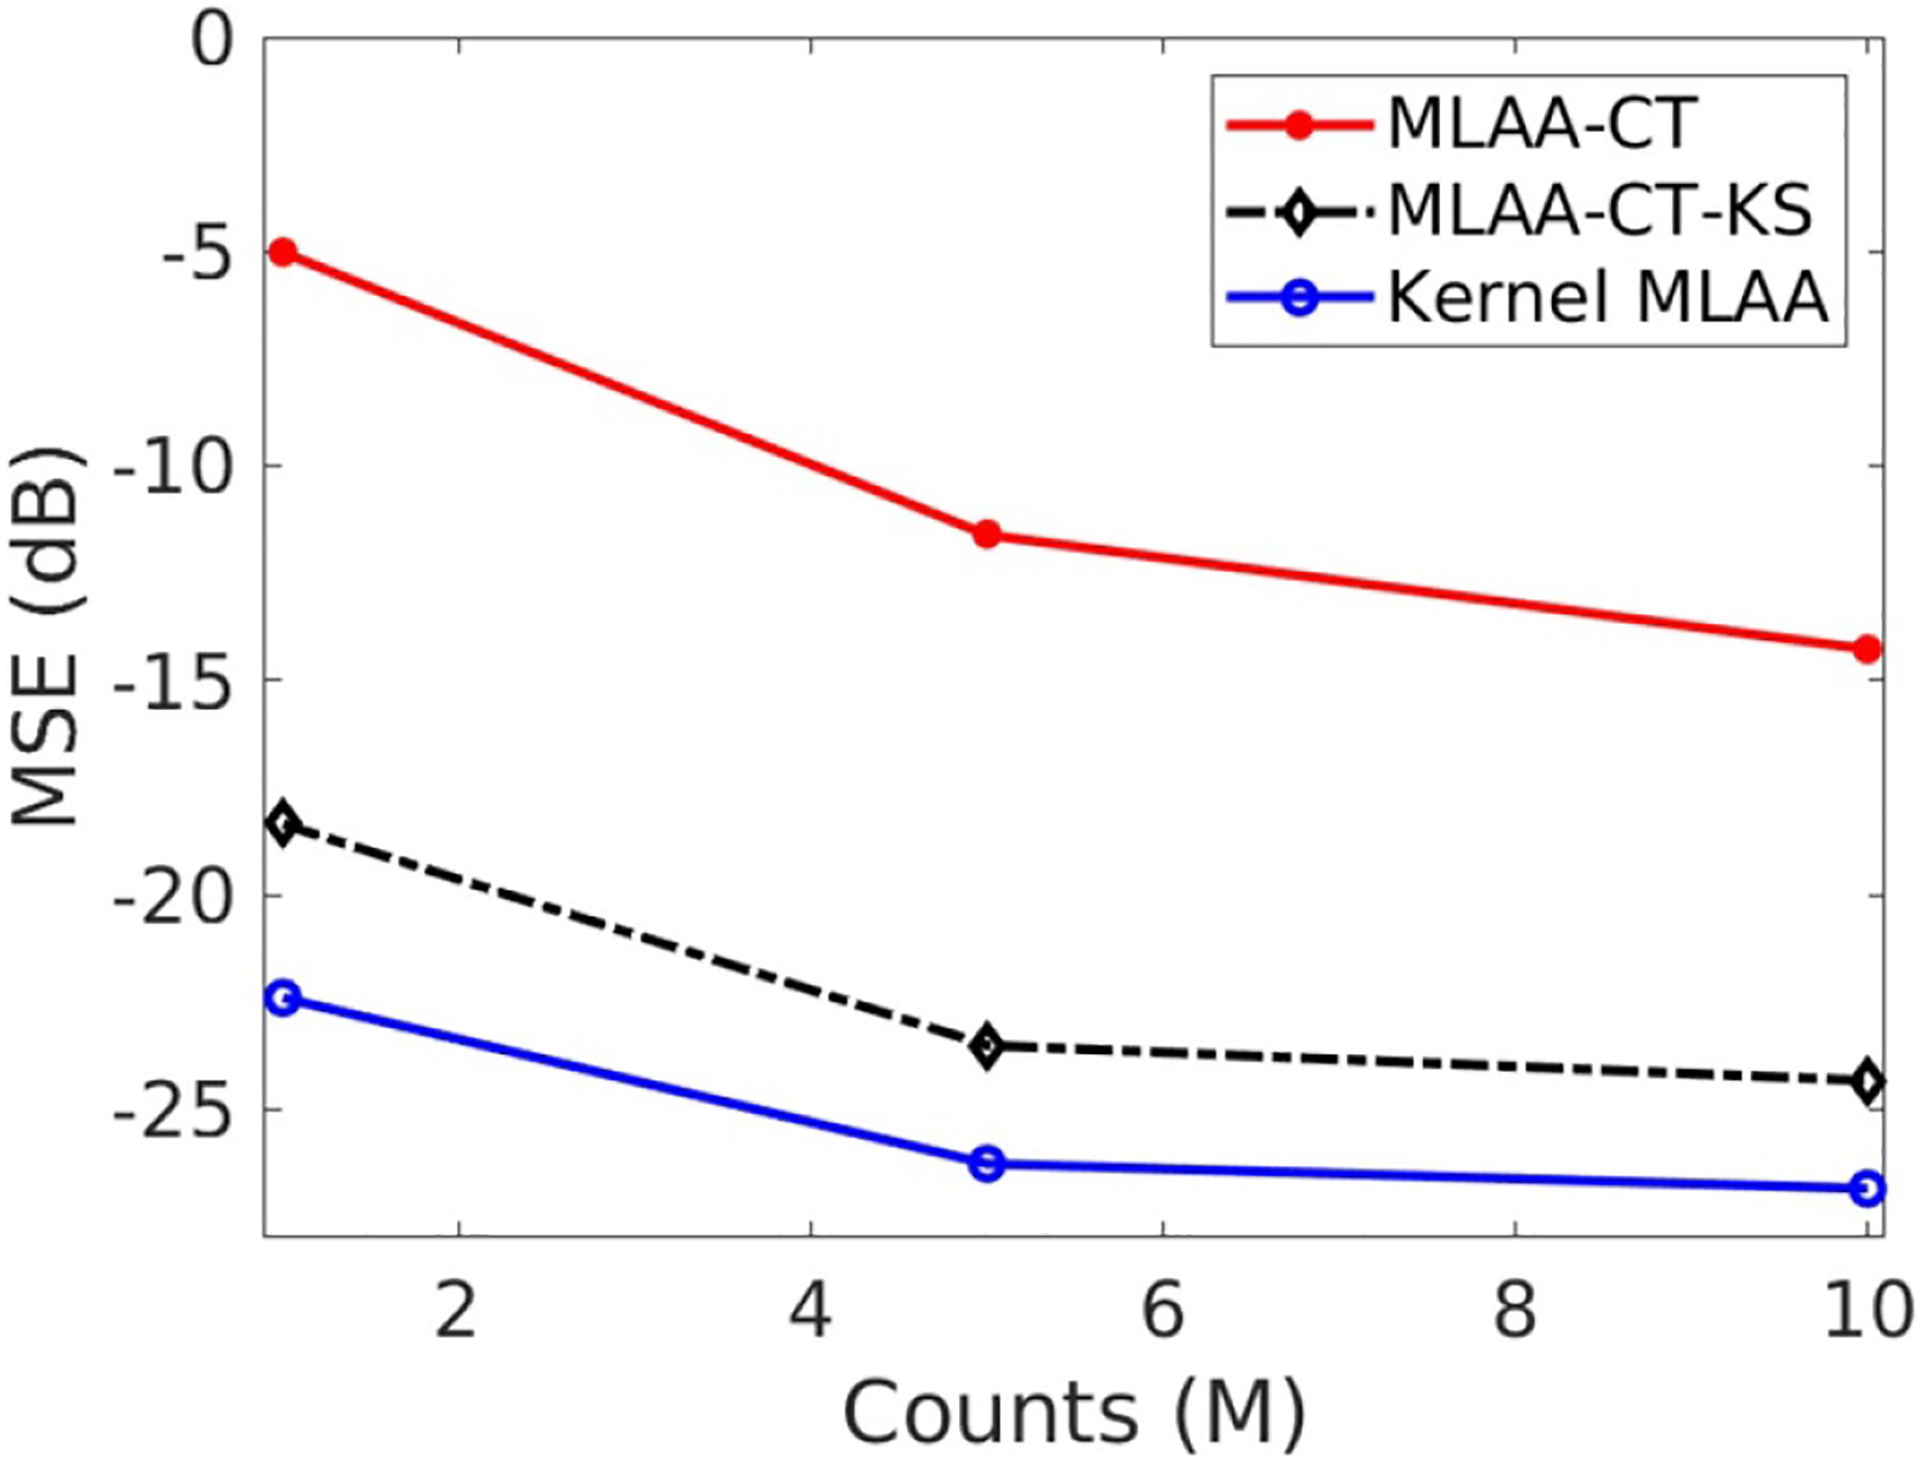
Effect of count level on image MSE for different reconstruction algorithms.
Figure 7 shows the results of ensemble bias versus SD for GCT ROI quantification in a liver region and a spine bone region. The count level was 5 million events. The iteration number varies from 0 to 3000 with a step of 100 iterations. As iteration number increases, the bias of ROI quantification is reduced while the SD is increased. After a certain number of iterations, the increasing noise may become dominant, which in turn induces higher bias. The post-reconstruction kernel smoothing approach outperformed the standard MLAA approach in a homogeneous region such as the liver but may oversmooth small targets such as the bone structures. The kernel MLAA achieved the best performance for both ROIs. At a fixed bias level, the kernel MLAA has lower SD than the other two approaches.
Figure 7.
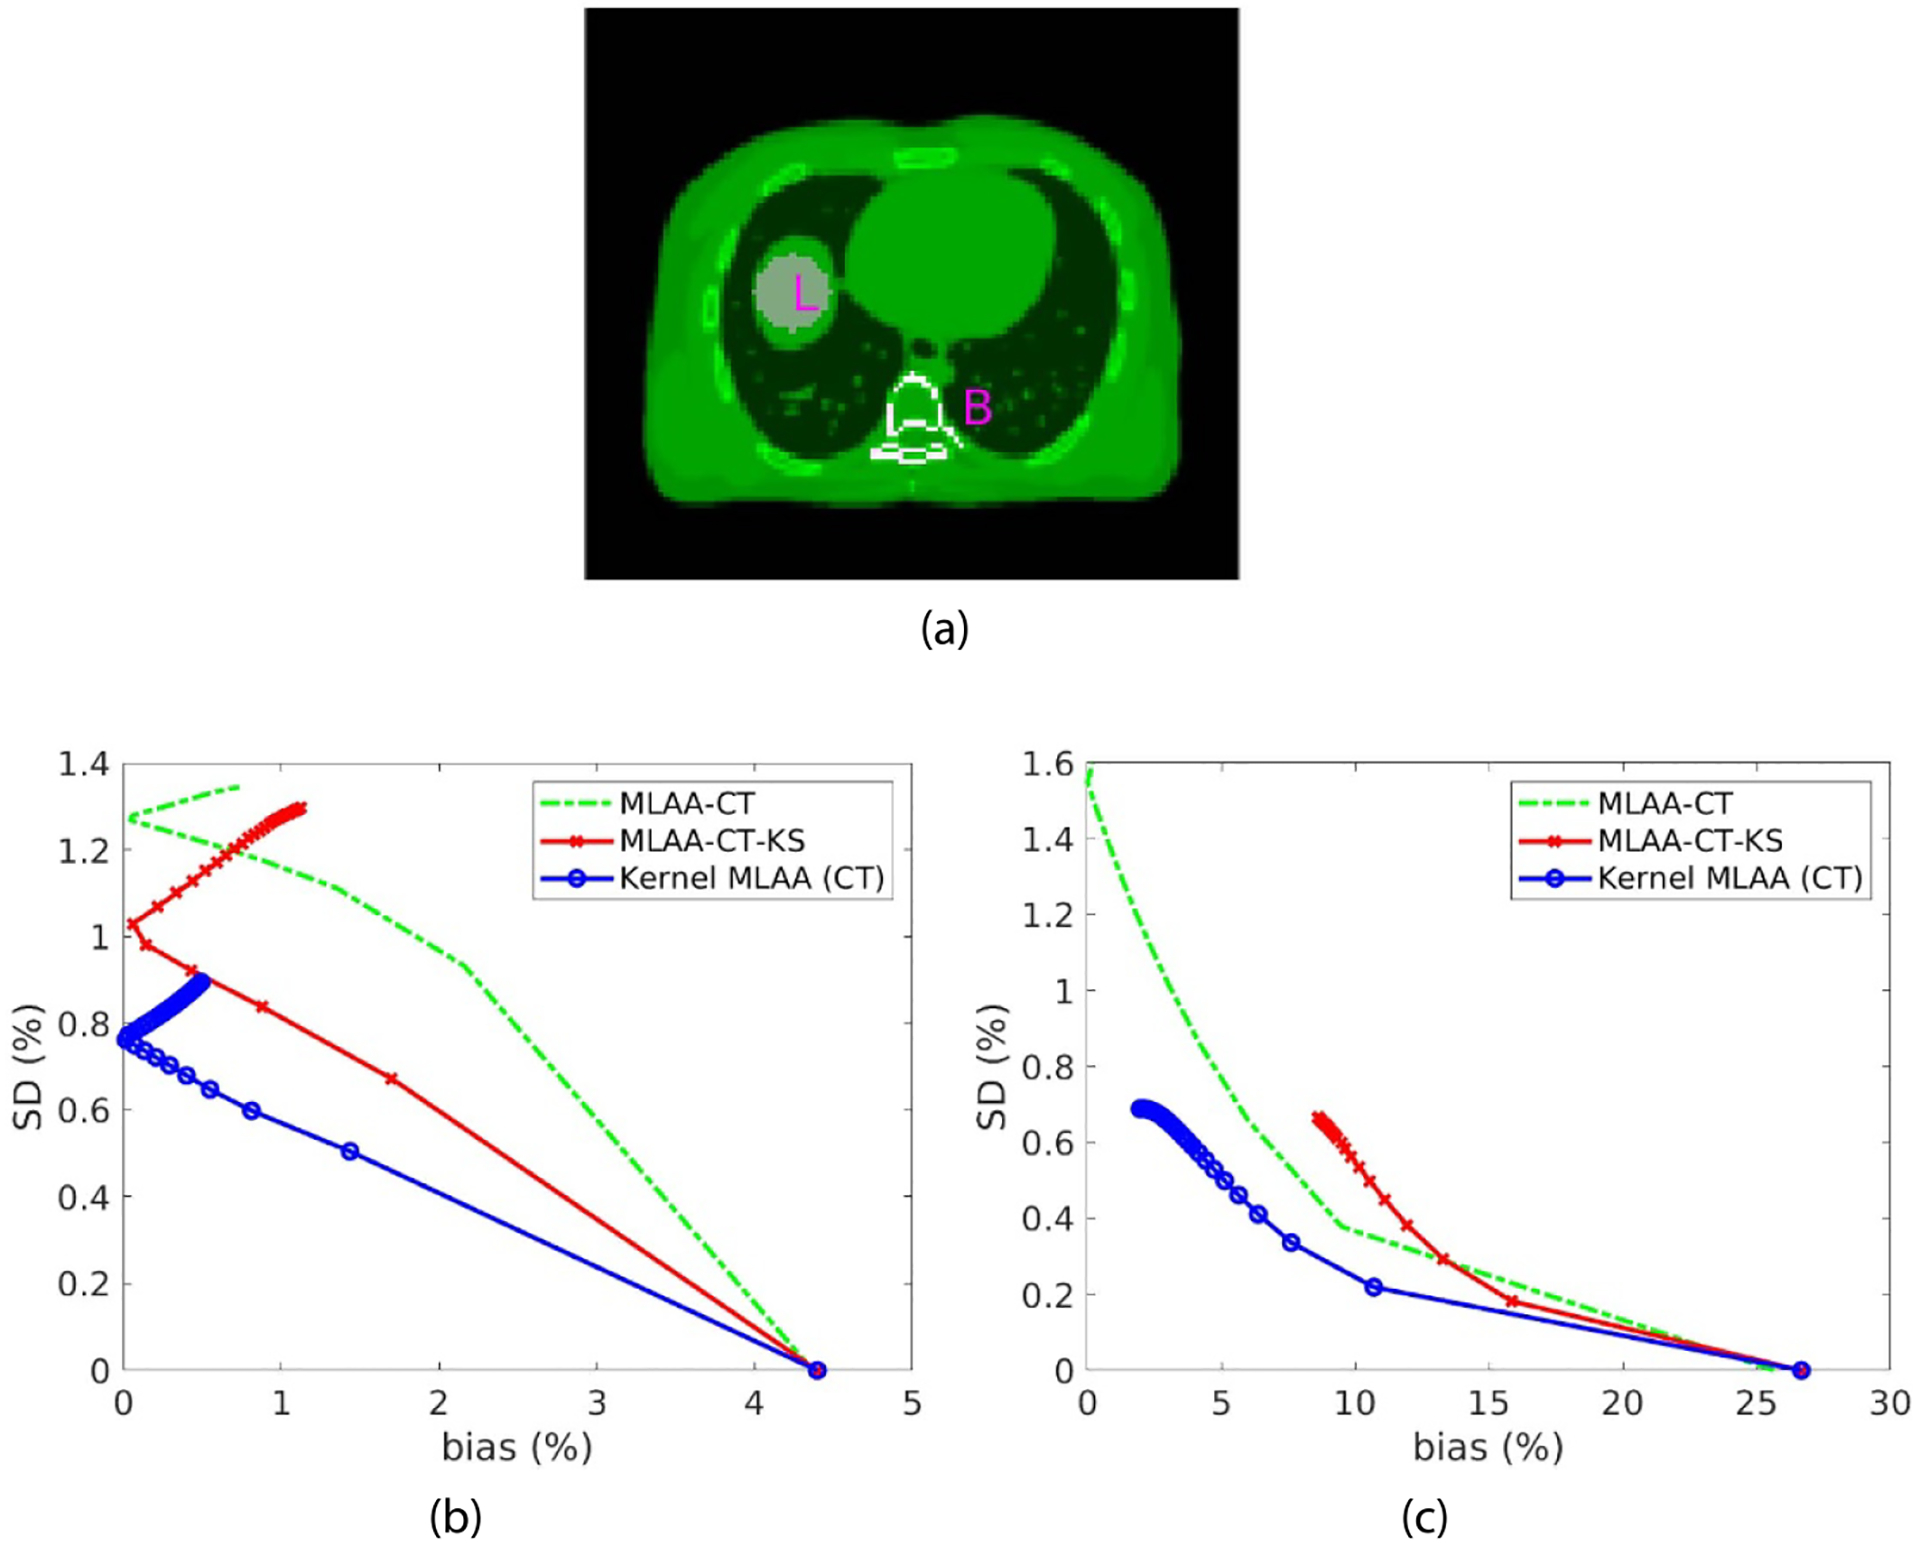
Plot of bias versus standard deviation trade-off for GCT ROI quantification. (a) Illustration of a liver ROI ‘L’ and a spine bone ROI ‘B’; (b) result of the liver quantification; (c) result of the bone quantification.
4.5. Comparison results for multi-material decomposition
The results of applying multi-material decomposition (MMD) to the combined x-ray CT and GCT data are given in figure 8. The MLAA and kernel MLAA reconstructions were run for 400 iterations. The ground truth of the three basis fractional images (air, soft tissue, bone) was generated using the noise-free pair of low-energy x-ray CT image and the 511 keV GCT image. The images by MLAA contain substantial noise but the regions of air and bone were still differentiated from the soft-tissue basis. Compared to MLAA, the kernel MLAA reconstruction led to a dramatic noise reduction in all the three basis images with decreased image MSE.
Figure 8.
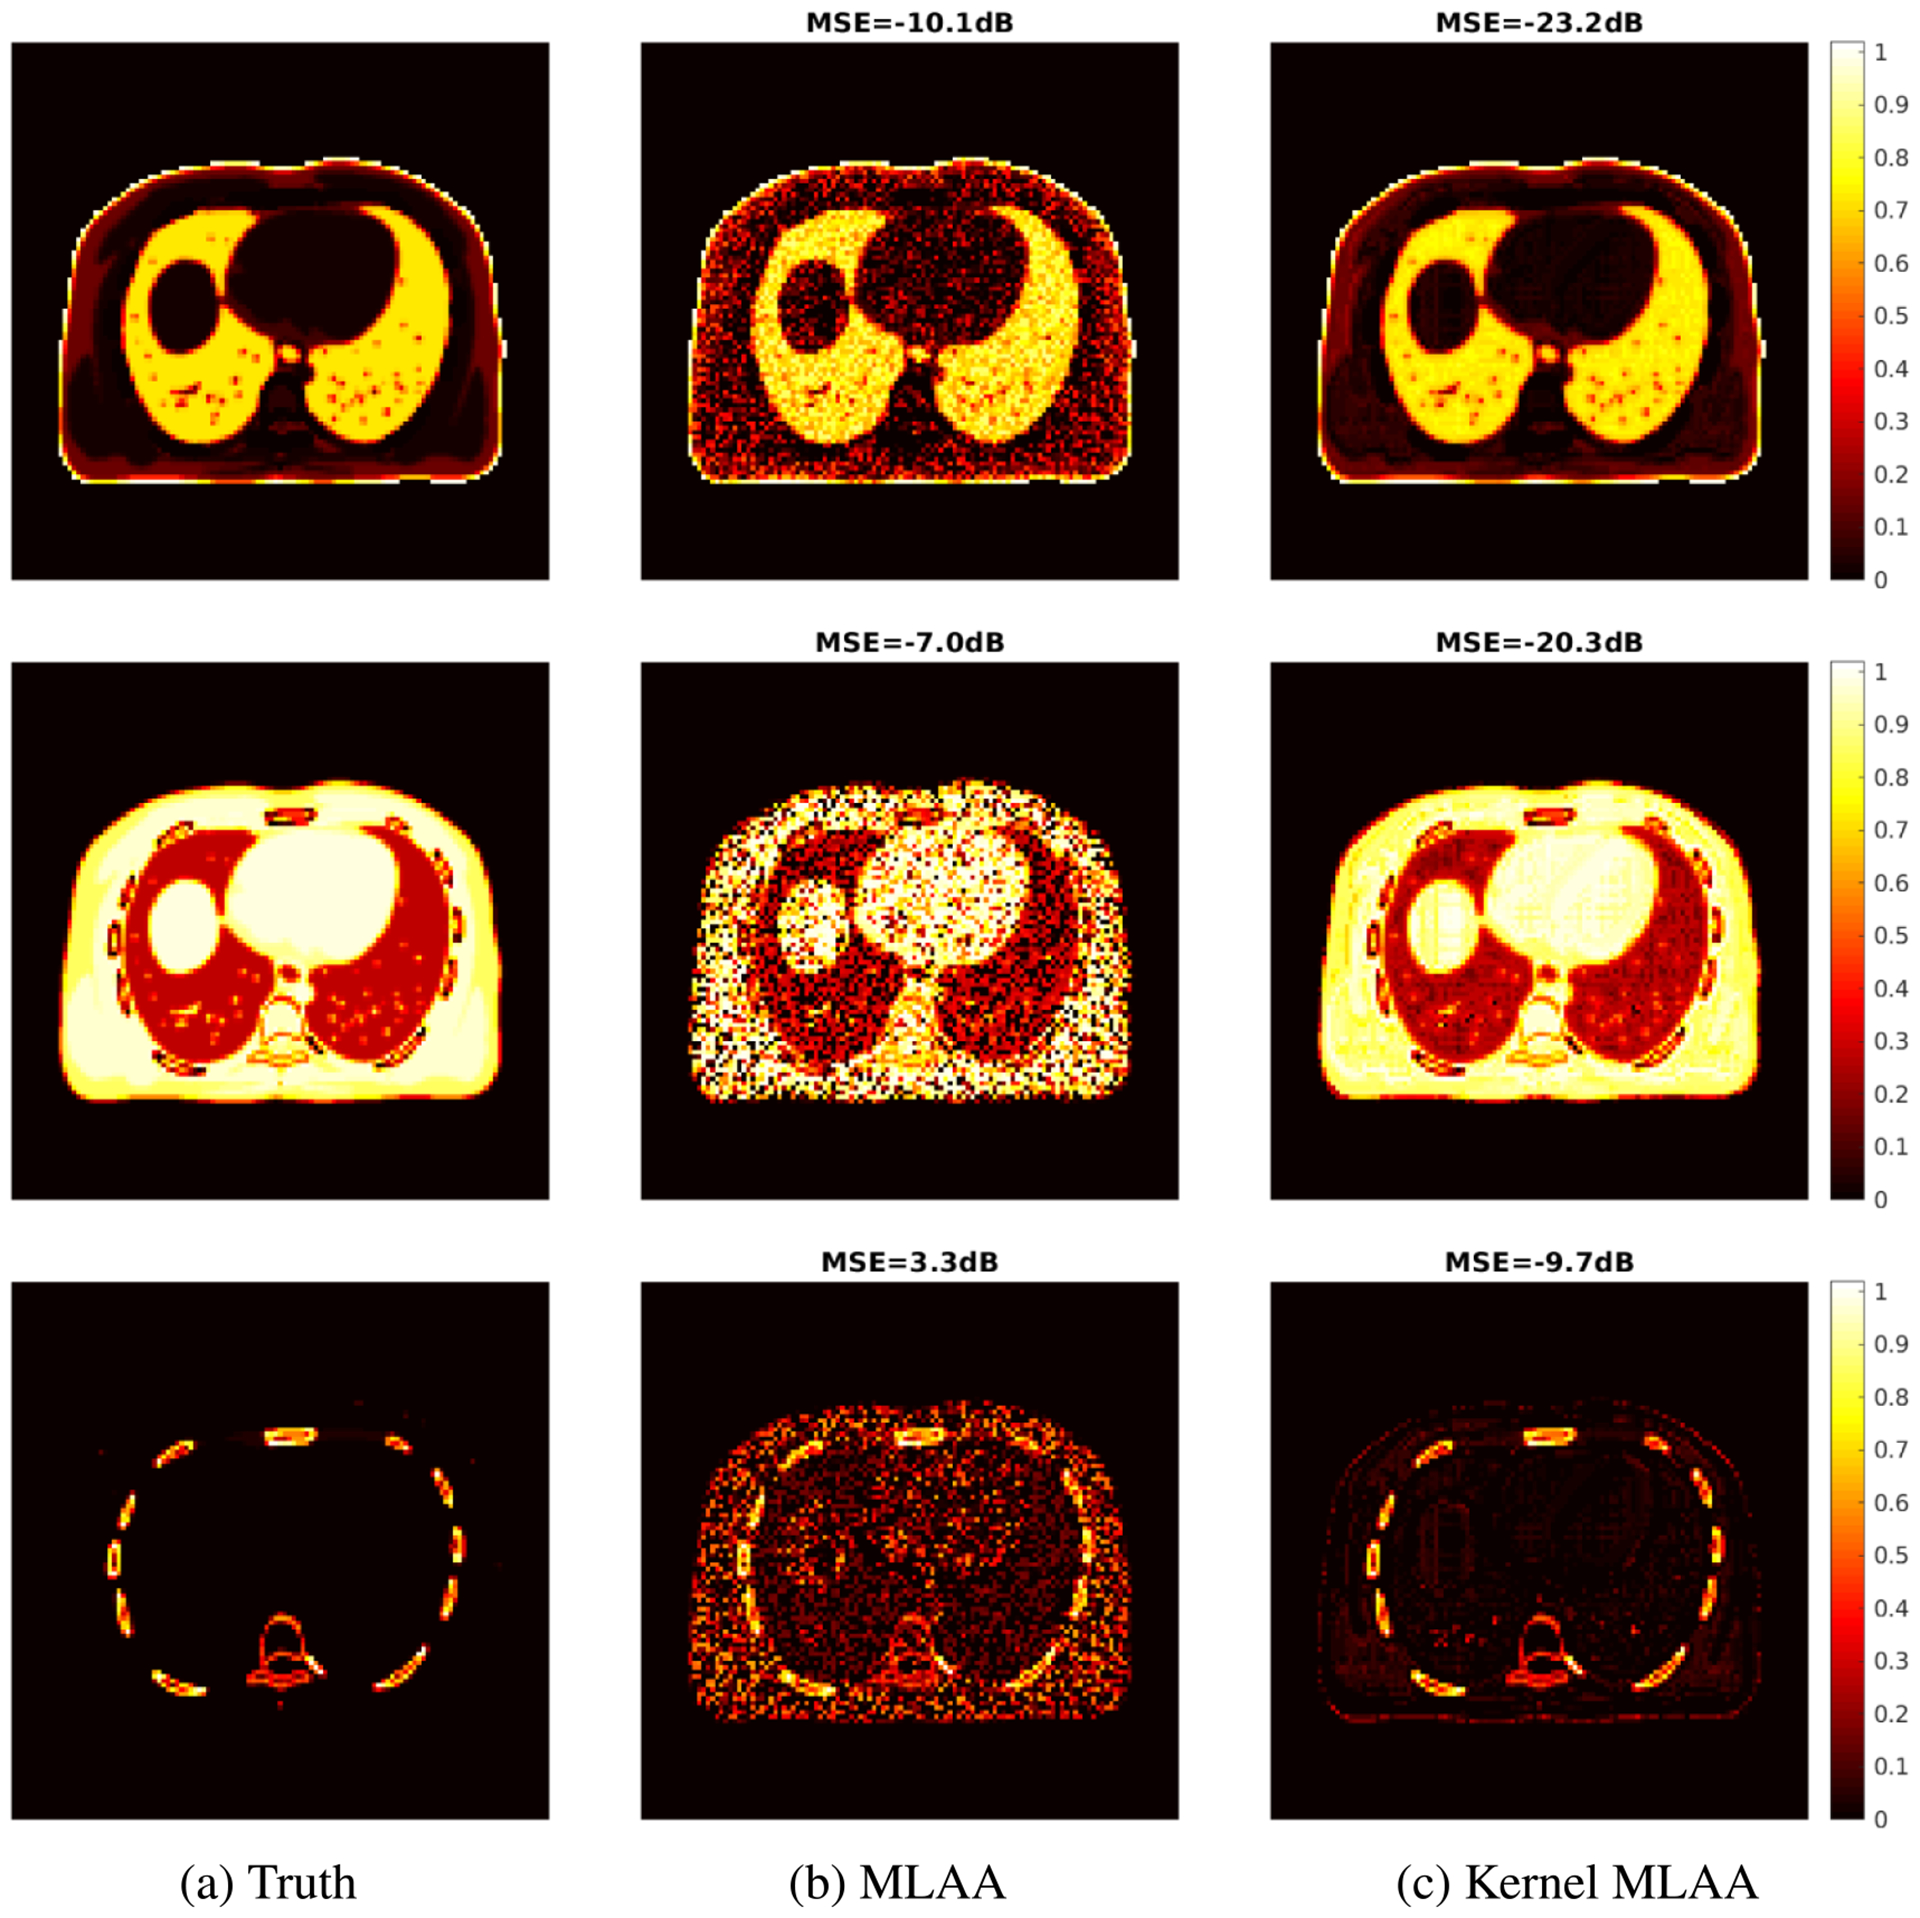
True and estimated fractional images of three basis materials—air (top row), soft tissue (middle row), and bone (bottom row)—by different reconstruction algorithms. (a) Ground truth; (b) standard MLAA; (c) proposed kernel MLAA.
The MSE of each basis fractional image is further plotted as a function of iteration number in figure 9 in which the post-reconstruction kernel smoothing approach was also included for comparison. The kernel MLAA approach demonstrated a significant MSE improvement over the conventional MLAA approach with or without post-reconstruction smoothing across all iterations.
Figure 9.
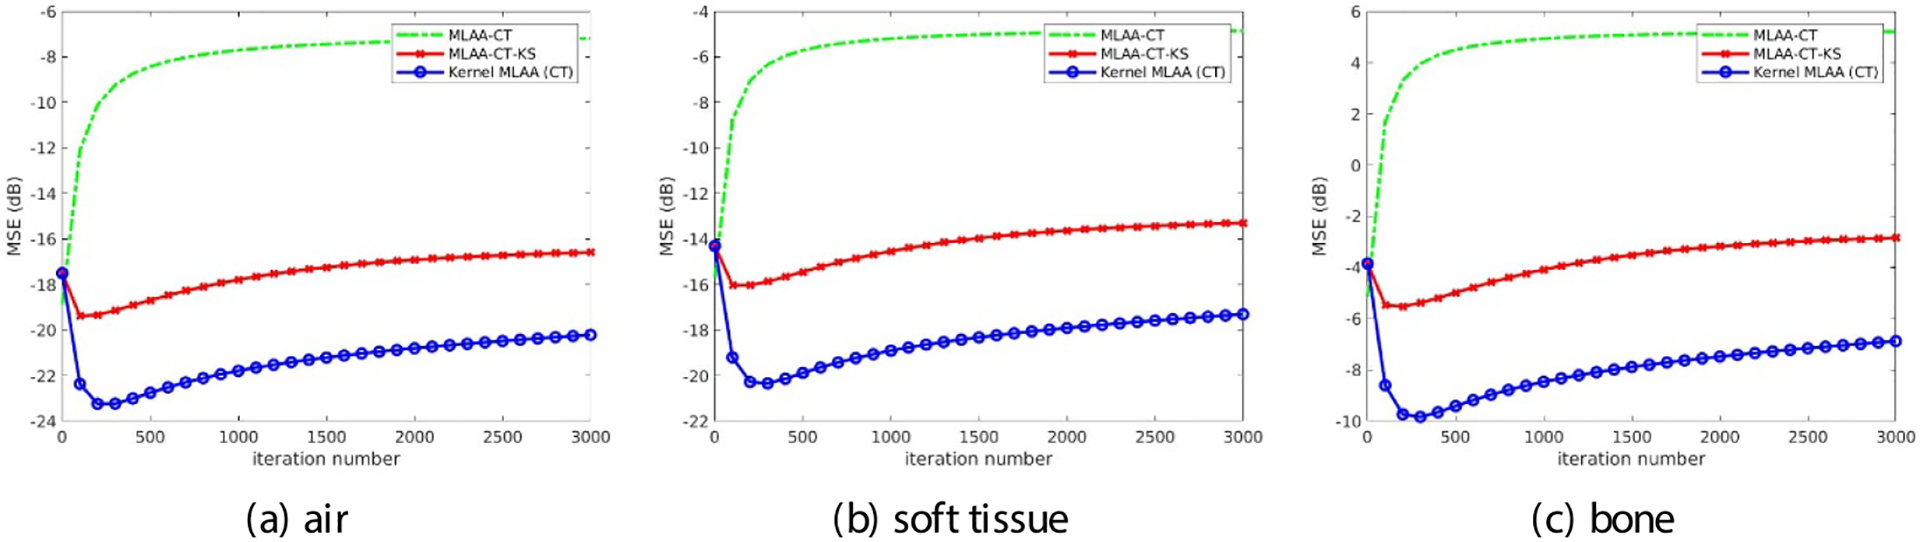
Plot of image MSE as a function of iteration number for each basis fractional image.
To demonstrate the performance of different reconstruction algorithms for ROI quantification on MMD images, figure 10 shows the bias versus SD trade-off plot for ROI quantification on the bone fractional image using the spine ROI as shown in figure 7(a). Due to over-smoothing, the post-reconstruction denoising approach had lower SD but higher bias, resulting in an even worse trade-off than the MLAA without denoising. In comparison, the kernel MLAA reconstruction achieved a consistently better trade-off than the other two approaches.
Figure 10.
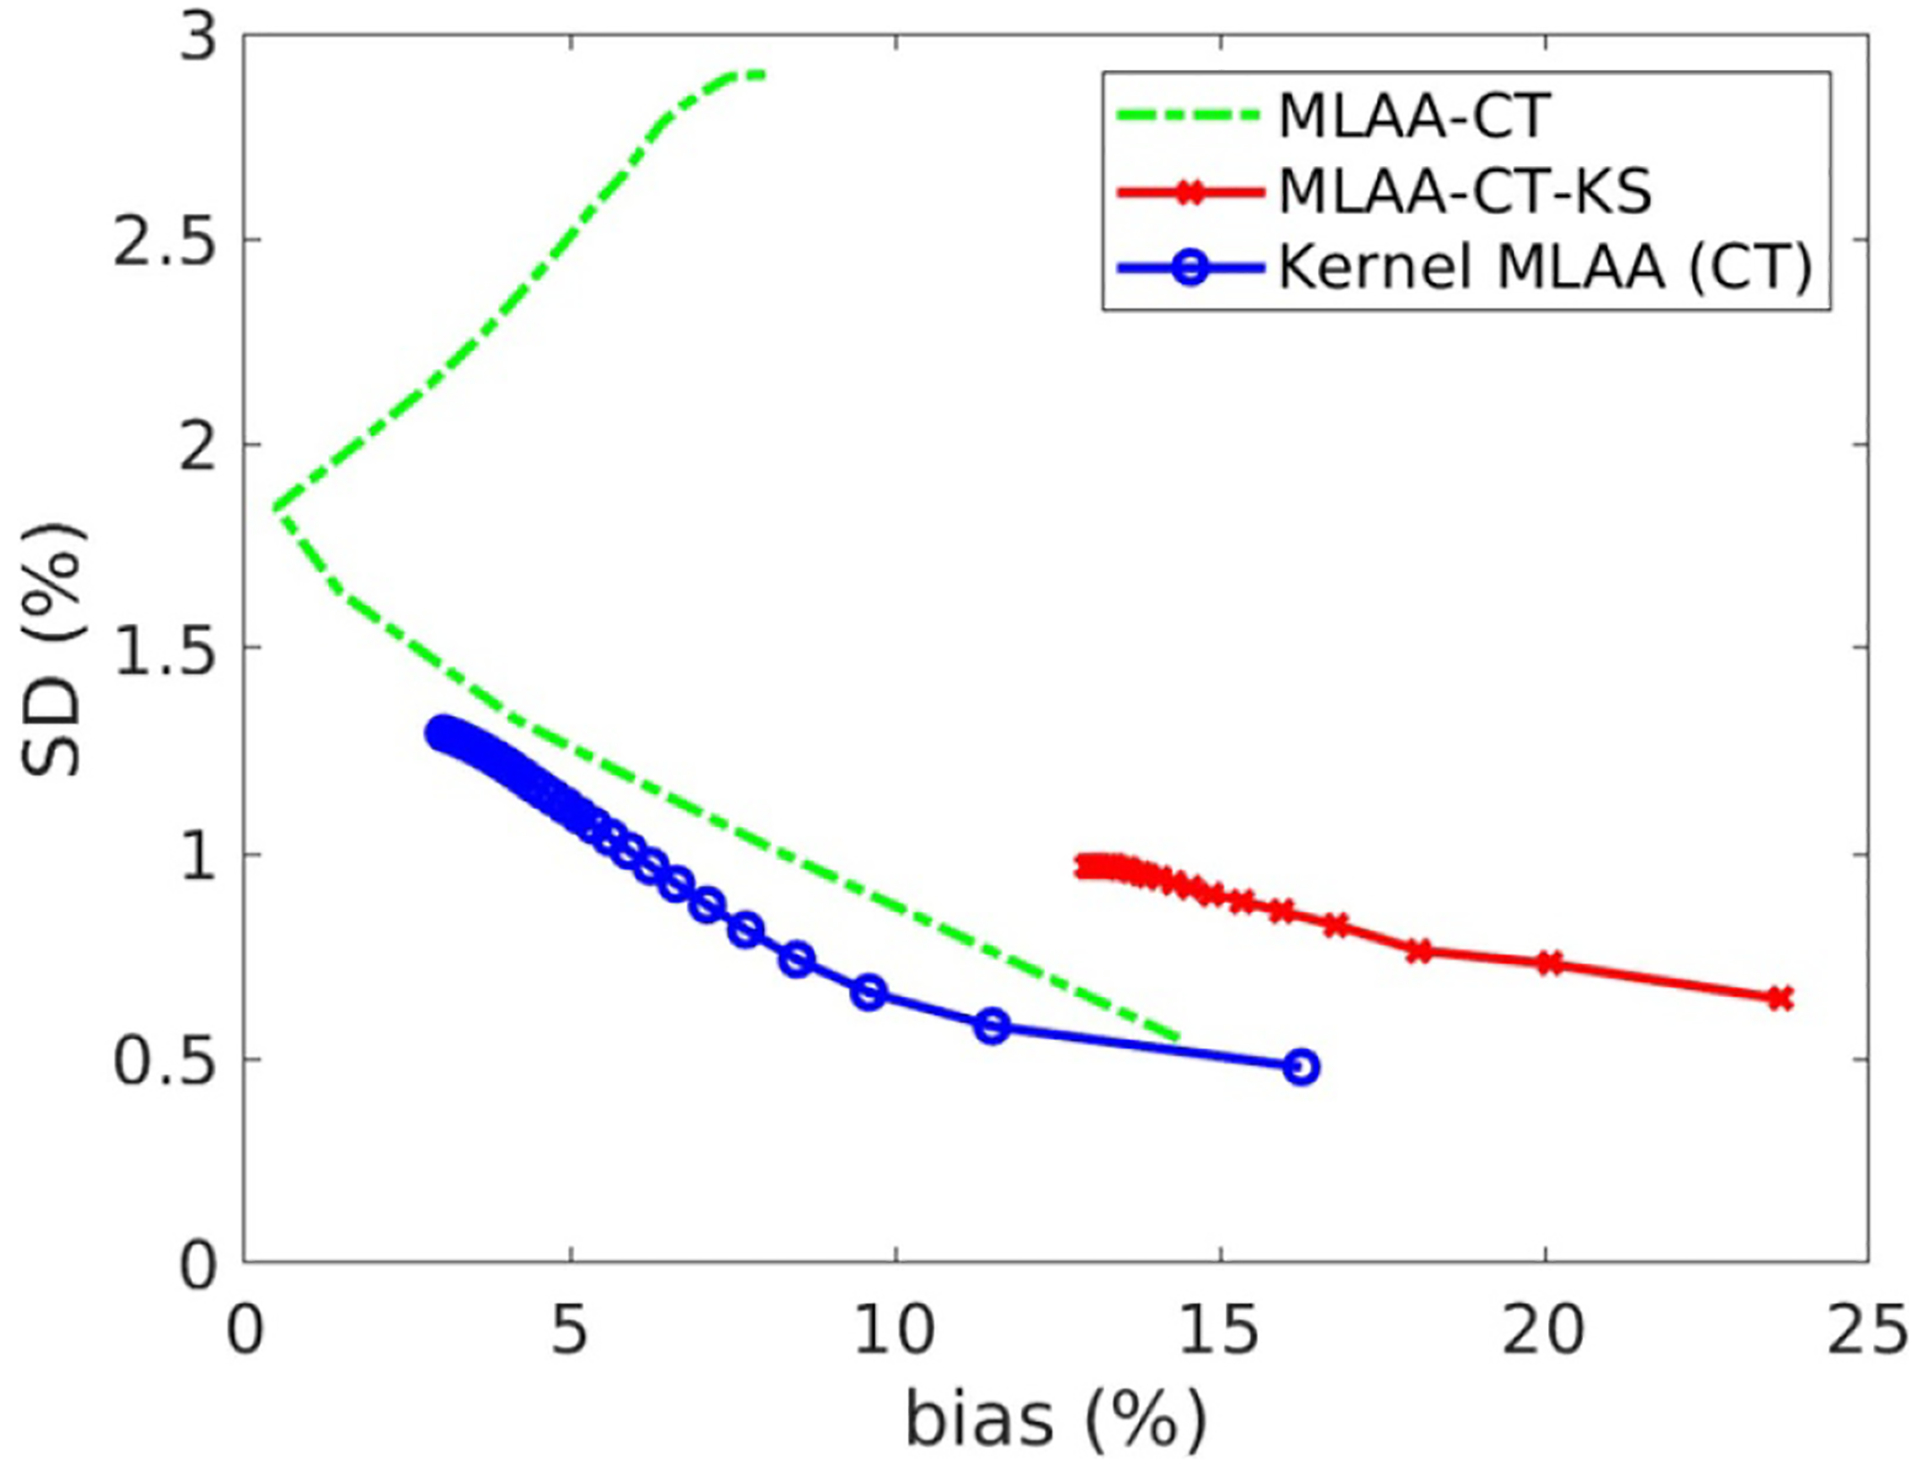
Plot of bias versus standard deviation trade-off for ROI quantification on the fractional image of bone basis material.
5. Discussions
In this paper, we demonstrated the feasibility of PET-enabled dual-energy CT imaging using computer simulation. While the standard MLAA reconstruction suffers from high noise, the kernel MLAA reconstruction can dramatically improve the GCT image quality and multi-material decomposition by utilizing the x-ray CT image prior for MLAA reconstruction. This shows a promising direction and also provides guidance to test the method in future physical phantom experiments and real patient data studies that will be conducted as our next steps. The method will be first tested for 18F-fluorodeoxyglucose (FDG) as it is the most widely used radiotracer in clinics. The method is in theory applicable to any radiotracer as long as the tracer distributes across the body. For some tracers which are highly targeted to a specific region after reaching equilibrium, dynamic PET data may be helpful for the GCT reconstruction but requires more investigations.
In the current study, we consider the x-ray CT is perfect, which however is less the case in practice. Depending on the application scenarios, x-ray CT of PET/CT may be of high noise and artifacts. Solutions include improved x-ray CT image reconstruction or deep-learning low-dose CT denoising (e.g. (Li and Wang 2020 and references therein)). One of our future work will investigate the effect of x-ray CT image quality on kernel MLAA and material decomposition and how modified methods may conquer the problems. It is also possible to combine x-ray CT projection data and PET emission data to pursue joint MLAA/CT reconstruction from simultaneous emission-transmission scans, in a way similar to (while still different from) earlier and new effort on a related problem (e.g. Erdogan and Fessler 1999a, Cheng et al 2020).
The GCT image reconstruction used a pixel size of 3.9 × 3.9 mm2 to match with the regular PET activity image pixel size on the PET scanner, which is not as good as a conventional CT resolution (e.g. with a pixel size of 1.0 × 1.0 mm2). Use of a smaller pixel size for GCT is possible but may increase image noise due to the increased number of unknown parameters in reconstruction. Thus, our initial applications of PET-enabled dual-energy CT will mainly focus on the PET resolution instead of the conventional CT resolution. which may still lead to a variety of applications in the context of PET/CT imaging. Note that the x-ray CT image prior was mainly explored in this proof-of-concept study for noise suppression. Its higher spatial resolution than PET has not been utilized yet for the GCT reconstruction. One possible future direction for further improvement is to pursue super resolution reconstruction of the GCT image using the a priori resolution information from x-ray CT, for instance, using deep learning super resolution methods (Park et al 2018, You et al 2020, Song et al 2020).
Another challenge down the road is that it is not uncommon that misalignment exists between a PET scan and an x-ray CT scan due to patient movement and physiological motion. This problem may affect both the kernel MLAA reconstruction and the match between GCT and x-ray CT for dual-energy imaging. One solution is to register the x-ray CT image to the GCT image estimated by standard MLAA with post-smoothing. The kernel MLAA and material decomposition are then implemented based on the registered x-ray CT image.
It is worth noting that timing resolution of PET scanners is continuously improved and ongoing efforts are pushing the limit (Surti 2015, Vandenberghe et al 2016, Lecoq 2017). The resolution has reached to 210 ps on state-of-the-art commercial scanners (van Sluis et al 2019), while it was 550 ps for the system we simulated in the current evaluation study. The improved timing resolution has the strong potential to tremendously benefit the GCT image reconstruction from PET emission data. It will be valuable to conduct a dedicated study of the impact of timing resolution on PET-enabled dual-energy CT imaging.
Despite the remaining challenges, the PET-enabled dual-energy CT method has many potentials. (1) It may allow dual-energy CT imaging on PET/CT with a lower radiation exposure due to one less x-ray CT scan. In the context of clinical whole-body 18F-fluodeoxyglucose (FDG) PET/CT, the effective dose of a low-dose CT scan for attenuation correction and anatomic localization is about 10 mSv while a standard 10 mCi FDG injection leads to 7 mSv. A second x-ray CT scan for dual-energy imaging may add a significant amount of radiation exposure. (2) It may also enable multi-energy spectral imaging in two different ways. The first way is to combine dual-energy x-ray CT with the PET-enabled GCT at 511 keV to create triple-energy CT imaging. The second way is to derive another high-energy GCT images from a time-of-flight PET scan in addition to the 511 keV attenuation image. This is possible because 176Lu in the LSO/LYSO crystals of PET detectors produces background radiation at 307 keV (and 202 keV), which can be used to obtain the corresponding attenuation maps as demonstrated by Rothfuss et al (2014). (3) In addition, the proposed PET-enabled dual-energy imaging method also has the potential to correct x-ray CT artifacts. X-ray CT is commonly poly-energetic and suffers from scattering (Endo et al 2016) and beam hardening effects especially in the presence of metallic implants (Van Gompel et al 2011). The essentially mono-energetic 511 keV GCT enabled by PET could potentially help reduce the beam hardening, scattering, and metal artifacts of x-ray CT. We will explore these opportunities in our future work.
6. Conclusion
We have developed a PET-enabled dual-energy CT imaging method and demonstrated its proof of concept using computer simulation. Distinct from conventional dual-energy CT imaging, the proposed method does not use two x-ray CT energies but combines low-energy x-ray CT and high-energy gamma-ray CT reconstructed from time-of-flight PET emission data. A kernel MLAA algorithm has also been developed to improve image quality and validated using simulated data. The results have shown the feasibility of the method for multi-material decomposition. As compared to a standard PET/CT scan, the proposed method can add a new dimension of information of material compositions without increasing the imaging time and cost. The method also has the potential to be extended for multi-energy spectral CT imaging.
Acknowledgments
This work is supported by National Institutes of Health (NIH) under Grant No. R21 EB027346. The author thanks Dr Jian Zhou for providing the time-of-flight forward and back projectors, Dr Simon R Cherry, Dr Jinyi Qi, Dr Ramsey D Badawi, and Dr Ben Spencer for helpful discussions.
References
- Ahn S, Cheng L and Shanbhag DD 2018. Joint estimation of activity and attenuation for PET using pragmatic MR-based prior: application to clinical TOF PET/MR whole-body data for FDG and non-FDG tracers Phys. Med. Biol 63 045006. [DOI] [PubMed] [Google Scholar]
- Benoit D, Ladefoged CN and Rezaei A 2016. Optimized MLAA for quantitative non-TOF PET/MR of the brain Phys. Med. Biol 61 8854. [DOI] [PubMed] [Google Scholar]
- Berker Y and Li YS 2016. Attenuation correction in emission tomography using the emission data–a review Med. Phys 43 807–32 [DOI] [PMC free article] [PubMed] [Google Scholar]
- Bland J, Mehranian A, Belzunce MA, Ellis S, McGinnity CJ, Hammers A and Reader AJ 2018. MR-guided kernel EM reconstruction for reduced dose PET imaging IEEE Trans. Radiat. Plasma Med. Sci 2 235–43 [DOI] [PMC free article] [PubMed] [Google Scholar]
- Bousse A, Bertolli O and Atkinson D 2016. Maximum-likelihood joint image reconstruction/motion estimation in attenuation-corrected respiratory gated PET/CT using a single attenuation map IEEE Trans. Med. Imaging 35 217–28 [DOI] [PubMed] [Google Scholar]
- Bowsher JE, Johnson VE, Turkington TG, Jaszczak RJ, Floyd CE and Coleman RE 1996. Bayesian reconstruction and use of anatomical a priori information for emission tomography IEEE Trans. Med. Imaging 15 673–86 [DOI] [PubMed] [Google Scholar]
- Cheng L, Ma T, Zhang X, Peng Q, Liu Y and Qi J 2020. Maximum likelihood activity and attenuation estimation using both emission and transmission data with application to utilization of Lu-176 background radiation in TOF PET Med. Phys 47 1067–82 [DOI] [PubMed] [Google Scholar]
- Conti M 2011. Why is TOF PET reconstruction a more robust method in the presence of inconsistent data? Phys. Med. Biol 56 155–68 [DOI] [PubMed] [Google Scholar]
- De Cecco CN, Burchett P and van Assen M 2018. Rationale and design of a prospective study on the first integrated PET/dual-energy CT system for staging and image-based radiation therapy planning of lung cancer Eur. Radiol. Exp 2 15 [Google Scholar]
- Defrise M, Rezaei A and Nuyts J 2012. Time-of-flight PET data determine the attenuation sinogram up to a constant Phys. Med. Biol 57 885–99 [DOI] [PubMed] [Google Scholar]
- Defrise M, Rezaei A and Nuyts J 2014. Transmission-less attenuation correction in time-of-flight PET: analysis of a discrete iterative algorithm Phys. Med. Biol 59 1073–95 [DOI] [PubMed] [Google Scholar]
- Deidda D, Karakatsanis NA and Robson PM 2019. Hybrid PET-MR list-mode kernelized expectation maximization reconstruction Inverse Problems 35 044001 [Google Scholar]
- Dicken V 1999. A new approach towards simultaneous activity and attenuation reconstruction in emission tomography Inverse Problems 15 931–60 [Google Scholar]
- Endo M, Mori S, Tsunoo T and Miyazaki H 2016. Magnitude and effects of x-ray scatter in a 256-slice CT scanner Med. Phys 59 3359–68 [DOI] [PubMed] [Google Scholar]
- Erdogan H and Fessler JA 1999. Joint estimation of attenuation and emission images from PET scans Conf. Proc. 1999 IEEE Nuclear Science Symp. and Medical Imaging (NSS&MIC) Seattle WA 24–30 October ( 10.1109/NSSMIC.1999.842904) [DOI] [Google Scholar]
- Erdogan H, Fessler JA 1999. Monotonic algorithms for transmission tomography IEEE Trans. Med. Imaging 18 801–14 [DOI] [PubMed] [Google Scholar]
- Erdogan H, Fessler JA 1999. Ordered subsets algorithms for transmission tomography Phys. Med. Biol 44 2835–51 [DOI] [PubMed] [Google Scholar]
- Feng T, Wang J and Li H 2018. Joint activity and attenuation estimation for PET with TOF data and single events Phys. Med. Biol 63 245017. [DOI] [PubMed] [Google Scholar]
- Gong K, Cheng-Liao J, Wang GB, Chen KT, Catana C and Qi J 2018. Direct Patlak reconstruction from dynamic PET data using kernel method with MRI information based on structural similarity IEEE Trans. Med. Imaging 37 955–65 [DOI] [PMC free article] [PubMed] [Google Scholar]
- Heuer T, Rank CM and Berker Y 2017. MLAA-based attenuation correction of flexible hardware components in hybrid PET/MR imaging Phys. Med. Biol 4 12. [DOI] [PMC free article] [PubMed] [Google Scholar]
- Hutchcroft W, Wang G, Chen K, Catana C and Qi J 2016. Anatomically-aided PET reconstruction using the kernel method Phys. Med. Biol 61 6668–83 [DOI] [PMC free article] [PubMed] [Google Scholar]
- Hwang D, Kim KY, Kang SK, Seo S, Paeng JC, Lee DS and Lee JS 2018. Improving the accuracy of simultaneously reconstructed activity and attenuation maps using deep learning J. Nucl. Med 59 1624–29 [DOI] [PubMed] [Google Scholar]
- Kinahan PE, Hasegawa BH and Beyer T 2003. X-ray-based attenuation correction for positron emission tomography/computed tomography scanners Semin. Nucl. Med 33 166–79 [DOI] [PubMed] [Google Scholar]
- Lecoq P 2017. Pushing the limits in time-of-flight PET imaging IEEE Trans. Radiat. Plasma Med. Sci 1 473–85 [Google Scholar]
- Li SQ, Wang GB 2020. Low-dose CT image denoising using parallel-clone networks arXiv: 2005.06724
- Li YS, Defrise M, Metzler SD and Matej S 2015. Transmission-less attenuation estimation from time-of-flight PET histo-images using consistency equations Phys. Med. Biol 60 6563–83 [DOI] [PMC free article] [PubMed] [Google Scholar]
- McCollough CH, Boedeker K and Cody D 2020. Principles and applications of multienergy CT: report of AAPM Task Group 291 Med. Phys 247 e881–912 [DOI] [PubMed] [Google Scholar]
- McCollough CH, Leng SA and Yu LF 2015. Dual- and multi-energy CT: principles, technical approaches and clinical applications Radiology. 276 637–53 [DOI] [PMC free article] [PubMed] [Google Scholar]
- Mehranian A and Zaidi H 2015. Joint estimation of activity and attenuation in whole-body TOF PET/MRI using constrained Gaussian mixture models IEEE Trans. Med. Imaging 34 1808–1821 [DOI] [PubMed] [Google Scholar]
- Noh J, Fessler JA and Kinahan PE 2009. Statistical sinogram restoration in dual-energy CT for PET attenuation correction IEEE Trans. Med. Imaging 28 1688–702 [DOI] [PMC free article] [PubMed] [Google Scholar]
- Novosad P and Reader AJ 2016. MR-guided dynamic PET reconstruction with the kernel method and spectral temporal basis functions Phys. Med. Biol 61 4624–45 [DOI] [PubMed] [Google Scholar]
- Nuyts J, Dupont P and Stroobants S 1999. Simultaneous maximum a posteriori reconstruction of attenuation and activity distributions from emission sinograms IEEE Trans. Med. Imaging 18 393–403 [DOI] [PubMed] [Google Scholar]
- Nuyts J, Rezaei A and Defrise M 2018. The validation problem of joint emission/transmission reconstruction from TOF-PET projections IEEE Trans. Radiation Plasma Med. Sci 2 273–8 [Google Scholar]
- Panin VY, Aykac M and Casey ME 2013. Simultaneous reconstruction of emission activity and attenuation coefficient distribution from TOF data, acquired with external transmission source Phys. Med. Biol 58 3649. [DOI] [PubMed] [Google Scholar]
- Park J, Hwang D, Kim KY, Kang SK, Kim YK and Lee JS 2018. Computed tomography super-resolution using deep convolutional neural network Phys. Med. Biol 63 145011. [DOI] [PubMed] [Google Scholar]
- Presotto L, Busnardo E and Perani D 2016. Simultaneous reconstruction of attenuation and activity in cardiac PET can remove CT misalignment artifacts J. Nuclear Cardiol 23 1086–97 [DOI] [PubMed] [Google Scholar]
- Qi J and Leahy RM 2006. Iterative reconstruction techniques in emission computed tomography Phys. Med. Biol 51 R541–78 [DOI] [PubMed] [Google Scholar]
- Rezaei A, Defrise M and Bal G 2012. Simultaneous reconstruction of activity and attenuation in time-of-flight PET IEEE Trans. Med. Imaging 31 2224–33 [DOI] [PubMed] [Google Scholar]
- Rezaei A, Defrise M and Nuyts J 2014. ML-reconstruction for TOF-PET with simultaneous estimation of the attenuation factors IEEE Trans. Med. Imaging 33 1563–72 [DOI] [PubMed] [Google Scholar]
- Rezaei A, Deroose CM, Vahle T, Boada F and Nuyts J 2018. Joint reconstruction of activity and attenuation in time-of-flight PET: a quantitative analysis J. Nucl. Med 59 1630–5 [DOI] [PMC free article] [PubMed] [Google Scholar]
- Rezaei A, Schramm G, Willekens SMA, Delso G, Van Laere K and Nuyts J 2019. A quantitative evaluation of joint activity and attenuation reconstruction in TOF PET/MR brain imaging J. Nucl. Med 60 1649–55 [DOI] [PMC free article] [PubMed] [Google Scholar]
- Rothfuss H, Panin V, Moor A and Young J 2014. LSO background radiation as a transmission source using time of flight Phys. Med. Biol 59 5483–500 [DOI] [PubMed] [Google Scholar]
- Salomon A, Goedicke A, Schweizer B, Aach T and Schulz V 2011. Simultaneous reconstruction of activity and attenuation for PET/MR IEEE Trans. Med. Imaging 30 804–13 [DOI] [PubMed] [Google Scholar]
- Shepp LS and Vardi Y 1982. Maximum likelihood reconstruction for emission tomography IEEE Trans. Med. Imaging 1 113–22 [DOI] [PubMed] [Google Scholar]
- Song T-A, Chowdhury SR, Yang F and Dutta J 2020. Super-resolution PET imaging using convolutional neural networks IEEE Trans. Comput. Imaging 6 518–28 [DOI] [PMC free article] [PubMed] [Google Scholar]
- Surti S 2015. Update on time-of-flight PET imaging J. Nucl. Med 56 98–105 [DOI] [PMC free article] [PubMed] [Google Scholar]
- Townsend DW 2008. Multimodality imaging of structure and function Phys. Med. Biol 53 R1–R39 [DOI] [PubMed] [Google Scholar]
- Van Gompel G, Van Slambrouck K and Defrise M 2011. Iterative correction of beam hardening artifacts in CT Med. Phys 38 S36–49 [DOI] [PubMed] [Google Scholar]
- van Sluis J, de Jong J and Schaar J 2019. Performance characteristics of the digital Biograph Vision PET/CT system J. Nucl. Med 60 1031–6 [DOI] [PubMed] [Google Scholar]
- Vandenberghe S, Mikhaylova E, D’Hoe E, Mollet P and Karp JS 2016. Recent developments in time-of-flight PET EJNMMI Phys 3 98–105 [DOI] [PMC free article] [PubMed] [Google Scholar]
- Wang G 2019. High temporal-resolution dynamic PET image reconstruction using a new spatiotemporal kernel method IEEE Trans. Med. Imaging 38 664–74 [DOI] [PMC free article] [PubMed] [Google Scholar]
- Wang GB 2018. PET-enabled dual-energy CT: a proof-of-concept simulation study Conf. Proc. 2018 IEEE Nuclear Science Symp. and Medical Imaging (NSS&MIC) (Sydney, Australia, November 13–17) ( 10.1109/NSSMIC.2018.8824351) [DOI] [Google Scholar]
- Wang G and Qi J 2015. PET image reconstruction using kernel method IEEE Trans. Med. Imaging 34 61–71 [DOI] [PMC free article] [PubMed] [Google Scholar]
- Wu H, Dong S and Li X 2020. Clinical utility of dual-energy CT used as an add-on to 18F FDG PET/CT in the preoperative staging of resectable NSCLC with suspected single osteolytic metastases Lung Cancer 140 80–6 [DOI] [PubMed] [Google Scholar]
- Xia T, Alessio AM and Kinahan PE 2014. Dual energy CT for attenuation correction with PET/CT Med. Phys 41 012501. [DOI] [PMC free article] [PubMed] [Google Scholar]
- You C, Li G, Zhang Y, Zhang X, Shan H and Li M 2020. CT Super-resolution GAN constrained by the identical, residual and cycle learning ensemble (GAN-CIRCLE) IEEE Trans. Med. Imaging 39 188–203 [DOI] [PMC free article] [PubMed] [Google Scholar]