

ABSTRACT
RNA sequencing of phage-infected bacterial cultures offers a snapshot of transcriptional events occurring during the infection process, providing insights into the phage transcriptional organization as well as the bacterial response. To better mimic real environmental contexts, we performed RNA-seq of Pseudomonas aeruginosa PAO1 cultures infected with phage LUZ19 in a mammalian cell culture medium to better simulate a phage therapy event and the data were compared to lysogeny broth medium. Regardless of the media, phage LUZ19 induces significant transcriptional changes in the bacterial host over time, particularly during early infection (t = 5 min) and gradually shuts down bacterial transcription. In a common response in both media, 56 P. aeruginosa PAO1 genes are differentially transcribed and clustered into several functional categories such as metabolism, translation and transcription. Our data allowed us to tease apart a medium-specific response during infection from the identified infection-associated responses. This reinforces the concept that phages overtake bacterial transcriptome in a strict manner to gain control of the bacterial machinery and reallocate resources for infection, in this case overcoming the nutritional limitations of the mammalian cell culture medium. From a phage therapy perspective, this study contributes towards a better understanding of phage–host interaction in human physiological conditions and demonstrates the versatility of phage LUZ19 to adapt to different environments.
KEYWORDS: Bacteriophage, gene expression, transcriptome, RNA-seq, P. aeruginosa
Introduction
Bacteriophages (or phages) are highly diverse viruses that specifically infect bacteria and are ubiquitous in nature. These viruses have been intensively studied and have highly contributed to the progress of various research fields [1]. Besides the major advances in phage research, such as high-throughput genome sequencing that contributed to better understand the enormous molecular diversity of phages, these viruses still represent the ‘dark matter’ of the biological world [2]. The principal knowledge gaps in phage biology are linked to the identification and comprehension of the interactions between phage and bacteria during the viral infection cycle, at a systems biology level [3,4]. Understanding these interactions can reveal how phage modulates bacterial metabolism and inhibits bacterial defence mechanisms to establish an effective infection [5]. Several omics approaches have contributed to the discovery of new phage–host interactions and mechanisms. Among these, transcriptomic analysis using RNA sequencing (RNA-seq) is emerging as a valuable tool to study phage and bacteria gene expression during specific steps of infection, enabling the discovery of new genes and their functions and the identification of regulatory RNAs [6]. The first studies have applied RNA-seq to unveil interactions between phage and bacteria pairs [6–15]. These works are focussed on the study of phage and bacterial transcriptomes in standard growth media at different stages of infection (usually early, middle and late infection). Despite providing a deeper knowledge of phage–host interactions, these studies do not provide insights into the molecular mechanisms of interaction that occur when bacteria are exposed to non-optimal growth conditions. Therefore, increasing the complexity of these assays by introducing conditions that better mimic the real environments where phage and bacteria interact might clarify if there are novel phage–host interactions to be discovered. This is particularly important in the context of phage therapy, where phages interact with bacteria in human physiological conditions, which are far from the ideal growth environments provided by standard optimal growth media.
Here we study the transcriptional profiles of Pseudomonas aeruginosa PAO1 cultures infected with phage LUZ19 under a standard optimal growth medium versus a mammalian cell culture medium. Phage LUZ19 is a well-characterized virulent Podovirus targeting P. aeruginosa [16,17] and a candidate phage for therapeutic purposes. Previous studies of LUZ19 transcriptome revealed a clear temporal expression pattern within the phage, as well as a major impact on transcription of host metabolic genes and type IV pilus expression regulation [16].
In this report, we investigate the effect of different media in both phage and bacteria transcriptomes at different stages of infection. Using RNA-seq, we aim to understand the gene expression patterns associated with the infection process in standard lysogeny broth (LB) medium versus mammalian cell culture medium. This work constitutes the first step towards a better understanding of phage–host interactions under conditions that better mimic the real P. aeruginosa infections in human patients.
Materials and methods
Bacterial strains, phage propagation and growth conditions
The reference strain P. aeruginosa PAO1 (DSM22644) from the German Collection of Microorganisms and Cell Cultures was used in all experiments and was grown at 37°C on LB or LB agar (LB with 1.2% (w/v) of agar). Specific experiments were performed using Dulbecco’s Modified Eagle’s Medium: Nutrient Mixture F-12 (DMEM: F12) supplemented with 2% (v/v) of Ultroser-G Serum Substitute Medium. This medium supports the growth of human airway epithelial cells and was chosen to mimic human bronchial physiological conditions, hereafter referred to as mammalian cell culturing medium (MCCM) [18]. Pseudomonas phage LUZ19 [17] was propagated on P. aeruginosa PAO1 cells by standard soft agar overlay, followed by PEG8000 precipitation and stored in phage buffer pH 7.5 (10 mM Tris-HCl, 10 mM MgSO4, 150 mM NaCl) at 4°C [19]. Phage titration was performed using the double‐agar layer [20].
One-step growth curves were established on either LB medium or MCCM. Briefly, cultures grown until OD = 0.3 were infected with phage at a multiplicity of infection (MOI) of 0.01 and incubated at 37°C with 120 rpm for 5 min. The mixture was centrifuged (7,000 × g, 4°C, 5 min) to remove free phages and then the pellet was resuspended in fresh medium. Phage titre was quantified at 5-min intervals over a period of 30 min. The PFU/cell was assessed through the ratio between the PFU/mL in each time point and the initial PFU/mL (t = 0 min).
Synchronized infection assays
P. aeruginosa PAO1 overnight cultures were diluted 1:100 in 25 mL of either fresh LB medium or MCCM and grown to the early exponential phase (OD600nm = 0.3, corresponding to ~2 × 10⁸ CFU/mL). At this point, the number of colony-forming units of the culture (CFU/mL) was counted by plating serial dilutions in LB plates [21] and a sample of 4.5 mL of culture was taken simultaneously (t = 0 min). This sample was immediately mixed with 1:10 vol of an ice-cold stop solution (1:10 buffered phenol, 9:10 absolute EtOH) and kept on ice to stabilize RNA. The remaining culture (~20 mL) was transferred to a pre-warmed Erlenmeyer flask and infected with phage LUZ19 at an MOI = 75 (to ensure synchronous infection of the culture) and incubated at 37°C and 120 rpm.
At t = 5 (early infection), t = 10 (middle infection) and t = 15 (late infection) min post-infection, 4.5 mL of culture was mixed with chilled stop solution and placed on ice. All collected samples were immediately frozen at −80°C to block RNA transcription and degradation until sample processing.
Biologically independent infection experiments, showing a CFU reduction of at least 95% within 5 min post-infection (only 5% bacterial culture survival to LUZ19 infection), were considered as synchronized infection. Triplicate samples from synchronized infections were used for total RNA extraction.
Total RNA extraction, quantification, quality assessment and rRNA depletion
Samples from synchronized assays were thawed on ice and centrifuged (3,345 ×g, 20 min, 4°C). Total RNA was extracted from cell pellets using the Purelink RNA Mini Kit (Invitrogen), according to the manufacturer’s instructions. Subsequently, each sample was treated with TURBO DNAse (Invitrogen) at 37°C to remove genomic DNA (gDNA) and then co-precipitated overnight at −20°C with 1:10 (v/v) NaOAc and 2.5 vol of absolute EtOH.
Precipitated RNA samples were centrifuged (16,000 × g, 4°C, 1 h) and pellets were washed twice with 70% (v/v) EtOH. The air-dried RNA pellets were dissolved in 60 µl of DNAse and RNAse-free water (Invitrogen). Total RNA concentration and purity were measured on a Nanodrop 2000 Spectrophotometer (Thermo Scientific, MA, USA) and a Qubit 4 Fluorometer (ThermoFisher Scientific). In addition, the absence of gDNA contamination was confirmed by PCR using specific primers for both phage LUZ19 (Forward: 5ʹ-ccgacaagatcgtccgcatgc-3ʹ, Reverse: 5ʹ-ggctgaagctacgcttggcc-3ʹ) and its host (Forward: 5ʹ-cggtcggaatctctacgcacc-3ʹ, Reverse: 5ʹ-cgacgccaacaacgccacg-3ʹ).
To assess RNA integrity, samples were analysed on a Bioanalyzer (Agilent, Santa Clara, California, US) with an RNA 6000 Nano Kit (Agilent) according to manufacturer’s instructions. Samples with good RNA integrity (RNA integrity number (RIN) >8) were treated with RiboMinus™ Transcriptome Isolation Kit (bacteria) (Invitrogen) to deplete ribosomal RNA (rRNA), according to the manufacturer’s instructions.
cDNA libraries preparation and sequencing
Depleted rRNA samples were precipitated and washed as mentioned previously and resuspended in 18–19 µL of Fragment Prime Finish mix from TruSeq Stranded mRNA Library Prep (Illumina). Successful rRNA depletion was verified on a Bioanalyzer and the final concentrations were determined using the Qubit 4 Fluorometer (Invitrogen).
rRNA-depleted samples were processed immediately, according to TruSeq Stranded mRNA Library Prep recommendations. In the end, cDNA libraries were evaluated on a Bioanalyzer (Agilent) to confirm average fragments between the range of 200 and 300 bp and final concentrations were measured on a Qubit. The libraries’ normalization and pooling were performed according to MiniSeq System Denature and Dilute Libraries Guide: protocol A from Illumina. For each run, a library of three samples with equimolar amounts was combined with PhiX control (spike-in of 0.5–2%) and paired-end sequenced (2 × 75 bp) on an in-house Illumina Miniseq sequencer.
Data analysis
The quality of cDNA reads was analysed using FastQC (version 0.11.2) [22]. Paired-end reads were aligned to the LUZ19 and P. aeruginosa PAO1 reference genomes (NC_010326.1 and NC_002516.2) using Bowtie 2 [23]. Next, the aligned reads were assigned to gene features using featureCounts [24]. Reads that mapped to rRNA (60–80%) were removed in silico (final number of reads in Table S3). Subsequently, counts were first normalized by gene length and then by the number of non-ribosomal reads in each sample to obtain RPKM values. Sample variance was analysed using Principal Component Analysis (PCA) in R and outliers were excluded from the transcriptional analysis. Therefore, samples from assay MCCM_3 were discarded while samples from two independent assays in MCCM and samples from three independent assays for LB medium were considered for further analysis. Heat map of P. aeruginosa PAO1 genes was also built (Figure S3). Differential gene expression analysis was performed using a negative binomial distribution test from DESeq Bioconductor package in R [25]. ANOVA test was performed to identify the most significantly up- or downregulated genes. The p-values were adjusted using the ‘BH’ method [26], which is the standard method built into the DEseq package, and are referred to as ‘padj’. Raw data and processed data are available under the accession GSE162278.
Results and discussion
Phage transcripts gradually take over the total transcriptome in both LB medium and MCCM
Unveiling phage–host interactions depends on the knowledge acquired during the infection process in a one-step infection cycle, as previously optimized [16]. To get a global overview of phage infection at the transcriptional level, we tracked the non-rRNA transcripts as a function of time during the infection, both for P. aeruginosa PAO1 grown in LB medium and MCCM, as illustrated in Fig. 1. Before infection (t = 0 min), all transcripts logically map to the host genome. Five minutes post-infection, this percentage varies between 60% and 85%. However, at the middle (t = 10 min) and late (t = 15 min) time points, the total number of host reads is reduced to 20–25% and 3–8%, respectively. At this late stage of infection, reads that map to the phage genome dominate the sample in both LB and MCCM cultures. This indicates that the host machinery is required to a high degree for phage reproduction as observed previously [27] and it appears that this pattern is independent of the used media.
Figure 1.
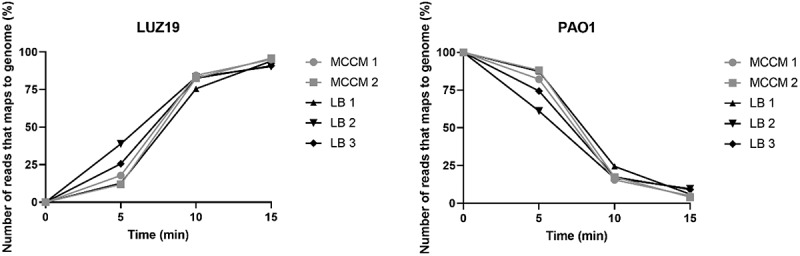
Percentage of reads that maps to the genomes of phage LUZ19 and P. aeruginosa PAO1 for individual replicate samples during synchronized infections in LB medium or MCCM
Comparing the phage transcriptional maps for time points 5, 10 and 15 min in both media, expression patterns of the individual time points appear to correlate well to each other (Fig. 2). Furthermore, these transcriptional maps correlate well with previous data and imply a logical progression from early (host adaptation) to middle (DNA replication) and late (structural and lysis proteins) expression for this phage [27]. However, it should be noted that a slight delay in phage transcription was observed for the MCCM-grown, infected cultures. Perhaps cell growth in MCCM results in reduced bacterial fitness, slowing down the phage infection cycle. Indeed, the bacterial starvation and metabolic state have been already shown to impact phage infection parameters [28]. Nevertheless, this minor discrepancy does not impact the results and interpretations outlined in the next sections; in fact, one-step growth curves demonstrated that the infection occurs equally in both media in terms of the latent period (Figure S1), but there was a visible change in the burst size when it was used different media. This difference can be explained by the influence of bacterial growth rate in the phage burst size, which was previously reported by Nabergoj and collaborators that demonstrated that the burst size of T4 phage increases linearly with the increase of E. coli k-12 growth rate [29]. Zooming in on the expression levels of individual phage genes allows to identify differentially expressed genes (p-value<0.05) at early, middle and late stages of infection (comparing with uninfected cultures) for both growth media conditions. Overall, phage gene expression levels do not differ between the LB- and MCCM-grown bacterial cultures.
Figure 2.
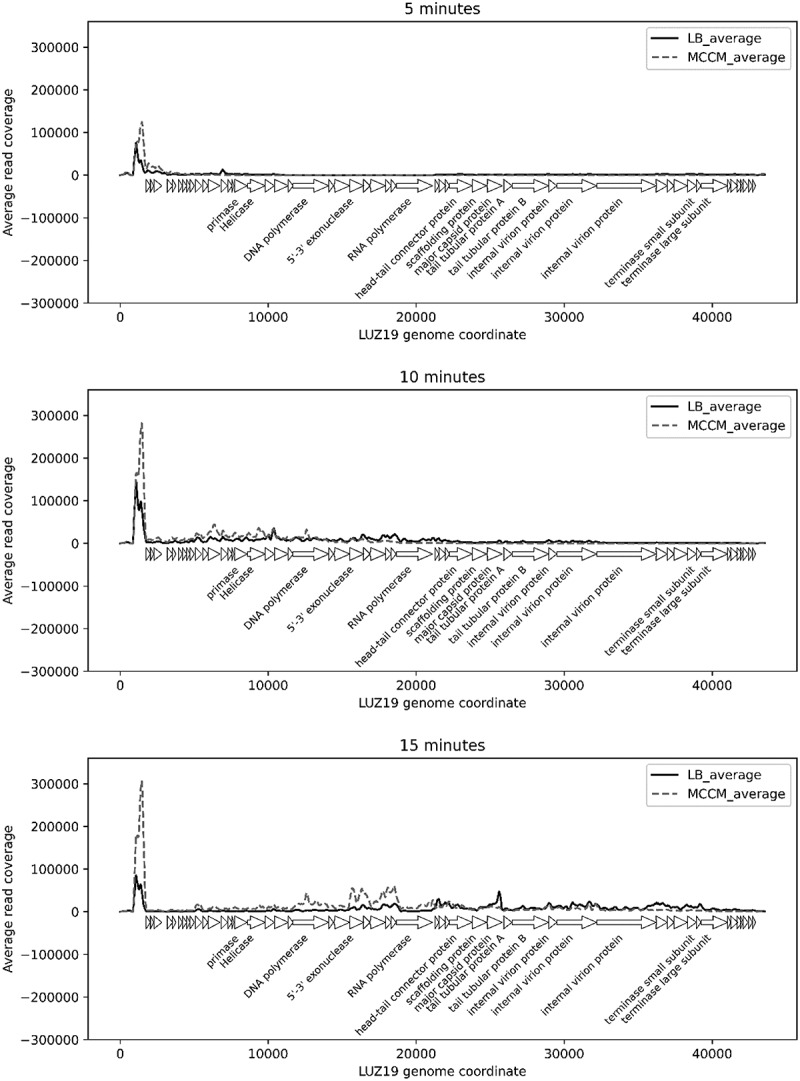
Distribution of cDNA reads over phage genome at early (t = 5 min), middle (t = 10 min) and late (t = 15 min) infection when LB medium or MCCM were used
P. aeruginosa PAO1 transcription is markedly impacted by the growth media
To better understand the influence of growth media on phage infection, the medium impact on the bacterial transcriptome (without phage infection) was analysed as a first step.
The indication that the medium has a strong influence on host behaviour was further confirmed by comparing the transcriptome of uninfected PAO1 cultures (t = 0 min) grown in MCCM versus LB. Differentially expressed genes were considered to have a Log2Fold ≥2 (upregulated genes) or ≤−2 (downregulated genes), and a padj≤0.05. A total of 383 and 239 differentially expressed genes were found to be up- and downregulated in MCCM comparing to LB medium, respectively. This indicates that environmental conditions, as expected, have a significant impact on bacterial behaviour, as mentioned in a study by Wagner and collaborators, which highlighted that the expression levels of quorum-sensing genes are influenced by growth medium [30]. From a general perspective, the majority of the differentially expressed genes have no assigned category or unknown function (category S), based in Clusters of Orthologous Groups (COGs) categories. However, there is also a high number of genes differentially expressed that belong to categories related to metabolism (Fig. 3). In addition, major differences associated with transcription [category K] and cell wall/membrane/envelope biogenesis [category M] functions are also influenced by the medium used.
Figure 3.
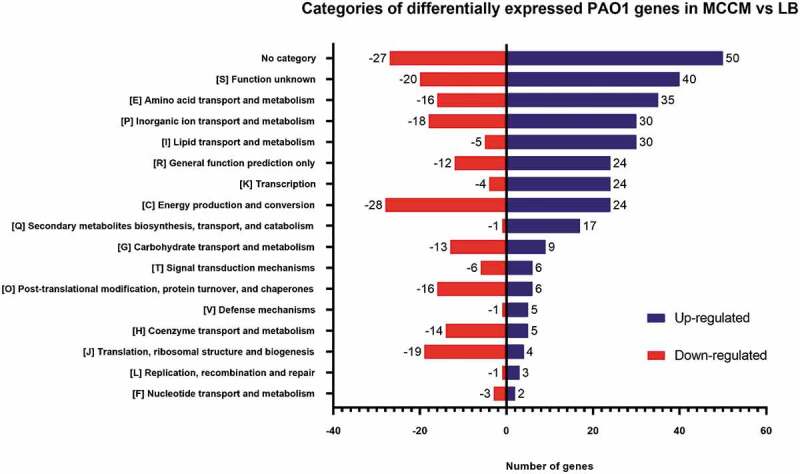
Number of up- and downregulated genes per COG category from non-infected bacterial cultures. DE are relative to MCCM versus LB
Interestingly, among the upregulated genes in MCCM vs. LB, 74 are related to iron acquisition, transport, storage and virulence factors such as phenazines and pyoverdine (Table S1). Many of these genes are regulated by the iron/haem/siderophores availability levels, induced under starvation conditions. The fact that these genes are upregulated in MCCM compared to LB medium indicates that bacteria need to acquire these substrates when growing in MCCM. In contrast, in LB medium these genes are downregulated, which indicates the absence of iron starvation. The iron starvation condition assumed to occur in MCCM is consistent with in vivo host conditions, where iron availability is low due to the presence of iron-binding proteins [31], and with the fact that mechanisms of iron uptake are related to P. aeruginosa virulence and pathogenicity in lung infections [32].
In addition, a total of 69 genes (Table S2) involved in secretion system (types I, II, III and IV), two-component system, biofilm formation, quorum sensing, multidrug resistance and virulence factors are also upregulated in MCCM relative to LB medium.
The large diversity of genes that are differentially transcribed in MCCM compared to LB medium proves that the composition of the media drastically influences the P. aeruginosa pathogenicity and virulence in addition to the bacterial metabolism. However, within the focus of this research, these differentially expressed genes serve as a control, enabling us to tease out the phage infection–induced transcriptional response between both cultures.
Elucidating the bacterial response to phage infection
A PCA allowed the identification of the parameters that most influence the variation of transcriptome profiles of P. aeruginosa PAO1 infected by LUZ19 in LB medium and MCCM. The obtained PCA (Fig. 4) suggests that the difference between the samples is explained by two major dimensions: the first-dimension variance is attributable to the different stages of phage infection (66.6%), whereas the variance in the second dimension is caused by the medium (14.2%). In the first dimension of the PCA, the transcriptomes from 5 min post-infection are very different from those acquired at 10 and 15 min. Quite logically, this corresponds to the fact that the major bacterial responses to phage infection occur during the early infection period, as observed previously [5]. Therefore, this early phase is critical to reveal potential bacterial defence mechanisms as well as processes triggered by phage for its infection cycle, as explored in the next sections.
Figure 4.
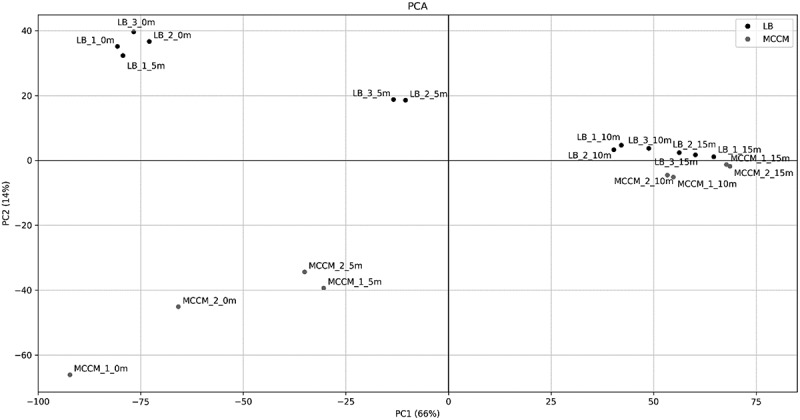
PCA of transcriptome obtained from samples acquired during different time points of synchronized assays when LB medium or MCCM was used
A second important conclusion that can be drawn from this analysis is the remarkable correlation and transcriptional convergence observed for the middle and late samples for both growth media. This indicates that during the course of infection, the impact of the growth medium is nullified, as the transcriptional differences between samples are impacted by the high expression of phage genes and by bacterial genes targeted by phage. During middle and late infection, bacterial responses that are associated with medium conditions decrease relative to responses triggered by phage infection.
In the following section, we will highlight the principal changes in terms of energy production, two-component regulatory systems and replication, transcription and translation processes.
Phage infection strongly impacts bacteria transcriptome regardless of the growth conditions
Since the major differences between the samples acquired from phage-infected bacteria in different media occur at 5 min post-infection, the bacterial differential gene expression was evaluated in detail at this time point, relative to uninfected cultures. At this time point, all differentially expressed PAO1 genes relative to uninfected cultures, in both media, were selected. Among them, 56 genes (Figure S2) are commonly differentially expressed in both media (Tables 1 and 2), indicating that this is a specific response to phage infection, regardless of the medium. Therefore, the functions of these 56 genes are analysed in detail in the next sections.
Table 1.
Common differentially expressed P. aeruginosaPAO1 genes at 5 min post-infection in both LB medium and MCCM
| Gene | Annotation | COG category | Functional Category | LB t = 5 min |
MCCM t = 5 min |
LB t = 10 min |
MCCM t = 10 min |
LB t = 15 min |
MCCM t = 15 min |
||||||
|---|---|---|---|---|---|---|---|---|---|---|---|---|---|---|---|
| Log2Fold | padj | Log2Fold | padj | Log2Fold | padj | Log2Fold | padj | Log2Fold | padj | Log2Fold | padj | ||||
| PA0265 | davD | [C] Energy production and conversion | Metabolism | 0.6 | 4.90E-02 | 1.1 | 6.00E-03 | 0.67 | 0.02 | 1.29 | 3.95E-03 | 0.79 | 0.12 | 0.26 | 0.79 |
| PA0840 | Probable NADH:flavin oxidoreductase | [C] Energy production and conversion | 2.5 | 1.38E-14 | 1.8 | 1.00E-03 | 0.64 | 0.35 | 1.34 | 0.18 | −0.02 | 0.99 | 0.51 | 0.80 | |
| PA1127 | Probable oxidoreductase | [C] Energy production and conversion | −1 | 1.00E-03 | −1.6 | 1.00E-03 | −1.41 | 2.12E-05 | −2.11 | 1.88E-04 | −1.63 | 4.88E-04 | −2.06 | 2.44E-03 | |
| PA2624 | idh | [C] Energy production and conversion | 0.6 | 4.50E-02 | 1.6 | 3.40E-05 | 1.08 | 1.29E-03 | 1.29 | 5.00E-03 | 0.49 | 0.39 | 0.62 | 0.34 | |
| PA4811 | fdnH | [C] Energy production and conversion | 1.8 | 3.23E-12 | 1.5 | 2.00E-03 | 0.88 | 1.06E-02 | −0.53 | 0.82 | −0.09 | 0.95 | 0.23 | 0.93 | |
| PA0266 | davT | [E] Amino acid transport and metabolism | 0.6 | 4.20E-02 | 1.2 | 3.00E-03 | 1.28 | 1.64E-05 | 2.02 | 7.14E-08 | 1.32 | 3.25E-04 | 1.22 | 9.76E-03 | |
| PA0296 | spuI | [E] Amino acid transport and metabolism | 0.8 | 4.00E-03 | 1.2 | 1.00E-03 | 0.44 | 0.25 | 0.37 | 0.68 | 0.49 | 0.51 | −0.73 | 0.36 | |
| PA0298 | spuB | [E] Amino acid transport and metabolism | 0.9 | 1.00E-03 | 1.2 | 1.00E-03 | 1.00 | 0.02 | 0.48 | 0.51 | 0.35 | 0.68 | −1.31 | 0.01 | |
| PA0299 | spuC | [E] Amino acid transport and metabolism | 1 | 2.21E-05 | 1.3 | 3.00E-03 | 1.76 | 6.55E-06 | 1.00 | 0.07 | 0.95 | 0.01 | −0.66 | 0.44 | |
| PA0302 | spuF | [E] Amino acid transport and metabolism | 0.7 | 4.20E-02 | 1.1 | 6.00E-03 | 0.35 | 0.59 | 0.57 | 0.37 | 0.11 | 0.94 | −0.70 | 0.32 | |
| PA0783 | Sodium proline transport | [E] Amino acid transport and metabolism | 0.7 | 3.10E-02 | 1.3 | 2.00E-03 | 0.76 | 0.08 | 1.96 | 3.02E-05 | 0.66 | 0.26 | 0.81 | 0.30 | |
| PA0789 | Probable amino acid permease | [E] Amino acid transport and metabolism | 1.1 | 4.19E-04 | 1.4 | 1.20E-02 | 1.33 | 3.70E-03 | 0.38 | 0.80 | 0.34 | 0.71 | −0.49 | 0.76 | |
| PA0870 | phhC | [E] Amino acid transport and metabolism | 1.2 | 3.35E-05 | 1.2 | 1.00E-03 | 0.73 | 4.97E-02 | 0.03 | 0.98 | 0.03 | 0.99 | −0.75 | 0.21 | |
| PA1071 | braF | [E] Amino acid transport and metabolism | 1 | 1.80E-02 | 0.9 | 4.10E-02 | 1.41 | 1.00E-04 | −0.67 | 0.53 | 0.94 | 0.37 | −1.27 | 0.05 | |
| PA1072 | braE | [E] Amino acid transport and metabolism | 1.1 | 5.00E-03 | 1.2 | 3.00E-03 | 1.14 | 4.03E-03 | −0.23 | 0.88 | 0.79 | 0.35 | −1.07 | 0.42 | |
| PA1073 | braD | [E] Amino acid transport and metabolism | 1.2 | 8.00E-03 | 1.1 | 1.00E-02 | 1.11 | 0.07 | −1.11 | 0.24 | 1.33 | 0.18 | −0.31 | 0.86 | |
| PA1417 | Probable decarboxylase | [E] Amino acid transport and metabolism | 1.7 | 3.00E-03 | 2.3 | 4.50E-02 | 2.40 | 1.32E-05 | 1.17 | 0.68 | 2.29 | 4.70E-03 | −3.54 | 0.40 | |
| PA5172 | arcB | [E] Amino acid transport and metabolism | 4.8 | 3.43E-13 | 1.2 | 5.00E-03 | 3.62 | 8.13E-19 | 1.27 | 0.02 | 1.32 | 0.07 | 0.80 | 0.38 | |
| PA2500 | Probable major facilitator superfamily (MFS) transporter | [G] Carbohydrate transport and metabolism | −2 | 9.19E-07 | −2.2 | 2.50E-02 | −2.29 | 1.37E-04 | −2.08 | 0.34 | −2.52 | 0.00 | −0.83 | 0.81 | |
| PA4464 | ptsN | [G] Carbohydrate transport and metabolism | −1.2 | 5.00E-03 | −1.1 | 1.70E-02 | −1.41 | 3.44E-03 | −0.92 | 0.32 | −1.27 | 0.17 | −1.54 | 0.06 | |
| PA5167 | dctP | [G] Carbohydrate transport and metabolism | 1.9 | 5.86E-10 | 1.5 | 1.32E-06 | 2.79 | 3.87E-16 | 0.11 | 0.94 | 1.37 | 0.01 | −0.93 | 0.18 | |
| PA5168 | dctQ | [G] Carbohydrate transport and metabolism | 1.7 | 1.71E-06 | 1.9 | 1.10E-06 | 2.07 | 2.62E-07 | 1.27 | 0.05 | 1.04 | 0.32 | 0.08 | 0.98 | |
| PA5169 | dctM | [G] Carbohydrate transport and metabolism | 1.4 | 3.15E-04 | 2.1 | 2.34E-09 | 2.34 | 2.20E-07 | 1.68 | 3.04E-03 | 0.99 | 0.32 | 0.38 | 0.81 | |
| PA4054 | ribB | [H] Coenzyme transport and metabolism | 1.1 | 4.67E-04 | 1.1 | 4.10E-02 | 1.06 | 1.13E-03 | 1.22 | 0.02 | −0.18 | 0.88 | 0.66 | 0.50 | |
| PA4055 | ribC | [H] Coenzyme transport and metabolism | 1.3 | 2.27E-05 | 1 | 2.80E-02 | 0.97 | 4.76E-03 | 1.03 | 0.12 | 0.17 | 0.90 | 0.19 | 0.91 | |
| PA2013 | liuC | [I] Lipid transport and metabolism | 2.2 | 4.00E-03 | 1.1 | 1.00E-02 | 1.84 | 0.05 | 0.07 | 0.97 | 0.56 | 0.90 | −0.34 | 0.82 | |
| PA2550 | Probable acyl-CoA dehydrogenase | [I] Lipid transport and metabolism | 2 | 8.10E-09 | 1.9 | 9.18E-06 | 0.62 | 0.44 | 0.30 | 0.88 | 0.38 | 0.87 | −0.15 | 0.96 | |
| PA2976 | Ribonuclease E | [J] Translation, ribosomal structure and biogenesis | Information storage and processing | 1 | 1.00E-03 | 2 | 5.04E-09 | 0.19 | 0.67 | 1.13 | 0.02 | −0.15 | 0.89 | 0.45 | 0.56 |
| PA4740 | pnp | [J] Translation, ribosomal structure and biogenesis | 0.8 | 2.90E-02 | 1.4 | 1.22E-04 | 0.53 | 0.17 | 1.88 | 0.00 | 0.07 | 0.95 | 1.10 | 0.01 | |
| PA4936 | Probable rRNA methylase (23 S) | [J] Translation, ribosomal structure and biogenesis | 0.9 | 7.00E-03 | 1 | 2.10E-02 | −0.24 | 0.66 | 0.85 | 0.15 | −0.73 | 0.46 | −0.62 | 0.49 | |
| PA1097 | fleQ | [K] Transcription | −1.1 | 5.50E-06 | −1.2 | 1.00E-03 | −1.00 | 4.67E-04 | −1.06 | 0.02 | −0.81 | 0.09 | −1.39 | 1.66E-03 | |
| PA4462 | rpoN | [K] Transcription | −0.8 | 2.10E-02 | −1.8 | 3.10E-04 | −0.95 | 3.52E-03 | −1.54 | 0.02 | −1.07 | 0.01 | −1.77 | 3.81E-03 | |
| PA4581 | rtcR | [K] Transcription | −0.8 | 2.10E-02 | −1.6 | 4.00E-03 | −0.55 | 0.30 | −1.31 | 0.22 | −0.03 | 0.99 | −1.36 | 0.33 | |
| PA4745 | nusA | [K] Transcription | 0.9 | 1.20E-02 | 2.2 | 1.68E-10 | 0.65 | 0.04 | 1.61 | 1.88E-04 | 0.49 | 0.45 | 1.68 | 5.65E-05 | |
| PA5255 | algQ | [K] Transcription | −0.7 | 1.70E-02 | −1.7 | 8.25E-08 | −1.14 | 1.41E-03 | −1.97 | 4.41E-07 | −1.36 | 0.00 | −2.10 | 6.25E-07 | |
| PA3159 | wbpA | [M] Cell wall/membrane/envelope biogenesis | Cellular processes and signalling | 0.8 | 8.00E-03 | 1 | 4.60E-02 | 0.27 | 0.62 | 0.06 | 0.97 | −0.26 | 0.73 | −0.31 | 0.78 |
| PA0623 | Probable bacteriophage tail tube protein | [S] Function unknown | Poorly characterized | 0.9 | 1.40E-02 | 0.9 | 4.80E-02 | 2.55 | 2.28E-12 | 2.50 | 7.20E-10 | 2.03 | 5.84E-07 | 2.58 | 4.46E-09 |
| PA3234 | Probable sodium:solute symporter | [S] Function unknown | 1.3 | 2.00E-03 | 0.9 | 2.50E-02 | 1.60 | 0.01 | −0.41 | 0.66 | 0.35 | 0.85 | −0.58 | 0.58 | |
| PA4611 | Hypothetical protein | [S] Function unknown | −2.5 | 3.40E-02 | −1.7 | 3.97E-04 | −1.96 | 0.14 | −1.17 | 0.10 | −3.40 | 0.02 | −1.28 | 0.12 | |
| PA4746 | Hypothetical protein | [S] Function unknown | 0.8 | 2.80E-02 | 2.5 | 5.81E-06 | 1.17 | 5.76E-04 | 2.16 | 8.62E-04 | 0.39 | 0.57 | 2.15 | 1.06E-03 | |
| PA3496 | Hypothetical protein | [S] Function unknown | −0.9 | 6.00E-03 | −2.2 | 2.59E-06 | −0.75 | 0.09 | −0.48 | 0.77 | 0.16 | 0.88 | 0.09 | 0.97 | |
| PA3233 | Hypothetical protein | [T] Signal transduction mechanisms | Cellular processes and signalling | 1.3 | 1.40E-02 | 1.5 | 2.00E-03 | 1.82 | 2.60E-05 | −1.29 | 0.09 | 0.48 | 0.78 | −1.17 | 0.23 |
Table 2.
Differentially expressed P. aeruginosa PAO1 genes at 5 min post-infection that have medium-specific expression
| Gene | Annotation | COG category | Functional Category | LB t = 5 min |
MCCM t = 5 min |
LB t = 10 min |
MCCM t = 10 min |
LB t = 15 min |
MCCM t = 15 min |
||||||
|---|---|---|---|---|---|---|---|---|---|---|---|---|---|---|---|
| Log2Fold | padj | Log2Fold | padj | Log2Fold | padj | Log2Fold | padj | Log2Fold | padj | Log2Fold | padj | ||||
| PA3584 | glpD | [C] Energy production and conversion | Metabolism | −1.3 | 1.00E-03 | 2.5 | 1.32E-06 | −1.03 | 2.28E-02 | 1.51 | 9.88E-02 | −0.27 | 8.06E-01 | 0.41 | 8.81E-01 |
| PA2204 | Probable binding protein component of ABC transporter | [E] Amino acid transport and metabolism | −2 | 9.32E-05 | 2.9 | 3.70E-15 | −1.06 | 9.15E-02 | 1.49 | 6.39E-02 | −0.37 | 8.06E-01 | 0.78 | 6.26E-01 | |
| PA5304 | dadA | [E] Amino acid transport and metabolism | −0.9 | 2.20E-02 | 2.8 | 7.28E-10 | 0.10 | 8.54E-01 | 3.82 | 4.45E-20 | 0.67 | 2.29E-01 | 2.69 | 1.21E-08 | |
| PA5429 | aspA | [E] Amino acid transport and metabolism | −1.2 | 4.68E-06 | 1.9 | 5.00E-03 | −0.67 | 2.88E-02 | 3.02 | 2.91E-06 | −0.53 | 3.63E-01 | 2.75 | 5.32E-05 | |
| PA0975 | Hypothetical protein | [H] Coenzyme transport and metabolism | −0.8 | 4.00E-03 | 1.1 | 1.60E-02 | −0.43 | 2.36E-01 | 0.23 | 8.77E-01 | −0.16 | 9.08E-01 | 0.52 | 6.60E-01 | |
| PA5118 | thiI | [H] Coenzyme transport and metabolism | −0.9 | 1.00E-03 | 1.1 | 3.30E-02 | −1.05 | 5.70E-05 | 1.32 | 3.06E-02 | −0.88 | 5.46E-02 | 1.28 | 4.40E-02 | |
| PA2557 | Probable AMP-binding enzyme | [I] Lipid transport and metabolism | 1.2 | 3.50E-02 | −1 | 1.40E-02 | 1.48 | 7.41E-03 | −2.14 | 1.67E-04 | 1.27 | 2.83E-01 | −3.29 | 4.52E-08 | |
| PA2071 | Elongation factor G | [J] Translation, ribosomal structure and biogenesis | Information storage and processing | 1.1 | 1.00E-03 | −1.2 | 3.00E-03 | 0.74 | 1.25E-01 | −1.15 | 4.50E-02 | 0.41 | 7.65E-01 | −1.61 | 3.12E-02 |
| PA0483 | Probable acetyltransferase | [K] Transcription | 1.1 | 4.10E-02 | −1.6 | 2.00E-03 | 0.37 | 6.07E-01 | −2.20 | 2.25E-03 | 0.36 | 8.39E-01 | −3.65 | 2.14E-03 | |
| PA0528 | Transcriptional repressor | [K] Transcription | −1.2 | 6.00E-03 | 1.8 | 4.70E-02 | −1.08 | 1.98E-02 | 1.48 | 4.27E-01 | −0.74 | 4.47E-01 | −0.45 | 9.50E-01 | |
| PA5374 | betI | [K] Transcription | −1.3 | 1.00E-03 | 4.5 | 2.09E-16 | −1.63 | 5.78E-05 | 4.55 | 8.04E-16 | −1.34 | 2.25E-02 | 4.35 | 3.08E-07 | |
| PA3642 | Ribonuclease HII, rnhB | [L] Replication, recombination and repair | −0.8 | 3.20E-02 | 1 | 2.70E-02 | −1.64 | 1.64E-05 | 0.45 | 6.90E-01 | −1.30 | 1.09E-02 | 0.14 | 9.48E-01 | |
| PA5302 | dadX | [M] Cell wall/membrane/envelope biogenesis | Cellular processes and signalling | −1 | 9.00E-03 | 2.9 | 4.67E-07 | −0.18 | 7.59E-01 | 3.65 | 6.07E-16 | 0.51 | 5.36E-01 | 2.88 | 3.62E-08 |
| PA1181 | Hypothetical protein, sensor protein | [T] Signal transduction mechanisms | Cellular processes and signalling | −0.9 | 2.00E-03 | 1.1 | 9.00E-03 | −0.71 | 5.00E-02 | 1.21 | 2.72E-02 | 0.02 | 9.89E-01 | 0.62 | 5.73E-01 |
Energy production is strongly promoted at early infection period
The majority of genes referred above are involved in metabolic pathways as summarized and contextualized in Fig. 5. More specifically, these genes are associated with energy production within the TCA cycle or transport of its intermediates including C4-dicarboxylates transport, Riboflavin biosynthesis, FAD synthesis, amino acids transport and metabolism and electron chain transport, among others. In this study, genes that encode C4-dicarboxylate transporter components (dctMQP genes) are upregulated in both media compared to uninfected cultures, indicating a need for these substrates during phage infection. Indeed, C4-dicarboxylates are known to be the P. aeruginosa preferential carbon and energy source [33,34]. This suggests that during early infection, the transport of these substrates is crucial to obtain high levels of energy. This hijacking of molecular resources is consistent with the coliphage T4 infection process and it is associated with the energy requirement for phage particle formation [35]. The changes in metabolism observed in LUZ19-infected P. aeruginosa cultures at an early stage are driven by phage at the very beginning of infection to assure the progression of the infection.
Figure 5.
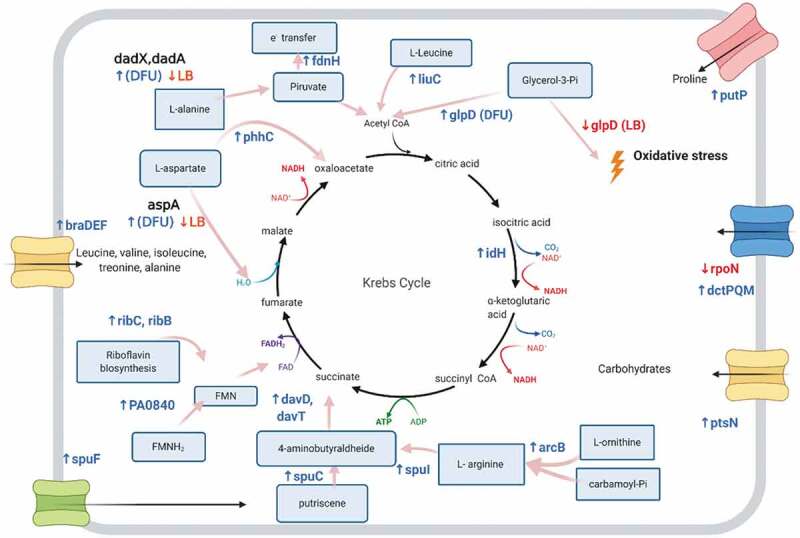
Up- and downregulated P. aeruginosa PAO1 genes observed in both LB medium and MCCM at early infection stage. The genes highlighted here are known to be involved in metabolic pathways that are connected with energy production through TCA cycle or transport of intermediates. Upregulated genes are in blue and downregulated genes are in red. Only genes in bold and the glpD gene do not have the same response for different media: these are upregulated in MCCM and downregulated in LB
In addition to the upregulation of genes involved in the transport and metabolism of carbon sources, the production of riboflavin and its derivates FAD and FMN is also upregulated at an early infection stage in both media. Riboflavin and its biologically active forms are widely used as cofactors by bacterial enzymes during redox reactions [36], but when its biosynthesis is inhibited, it leads to nutrient deficiency and oxidative stress [37]. The differentially expressed genes associated with vitamins and cofactors biosynthesis suggest that phages require their presence during infection.
An additional clue towards energy metabolism is provided by the upregulation of fdnH gene. This gene encodes the formate dehydrogenase-N β-subunit and is involved in the conduction of electrons from formate to nitrate. Nitrate respiration often occurs under anaerobic conditions. Also, in the presence of nitrate, the expression of formate dehydrogenase-N is induced [35]. In our data set, the expression of the β-subunit of this protein is upregulated in early infection, compared with uninfected cultures regardless of the media. This indicates that under phage infection, the expression of formate dehydrogenase-N might be required since this enzyme is responsible for proton motive force generation that ultimately results in energy production.
Other metabolic pathways that are triggered after phage infection involve the conversion of putrescine to produce succinate, a TCA intermediate, and ultimately energy. However, besides the upregulation of the genes involved in this pathway (spuC, davD and davT), gene spuF is also upregulated. This gene product is a component of the putrescine and spermidine transporter [38]. This hints at a structural relevance for spermidine transport, beyond the purpose of energy acquisition. Indeed, it was previously suggested that spermidine compacts and stabilizes viral DNA in the capsid [39,40] and is essential for N4-like Pseudomonas phage infection cycle [37]. This is a good example of multipurpose genes that are probably activated by phage infection to participate, in this specific case, in two mechanisms such as energy generation and phage DNA stabilization.
Impact of phage infection on the host’s two-component regulatory systems
Among the 56 PAO1 genes targeted at 5 min post-infection, many are involved in two-component regulatory systems (wspA– chemotaxis family, C4-dicarboxylates transport and RpoN– Ntrc family, FdnH – NarL family, braDE – OmpR family, arcB – OmpR family), and have similar expression profiles in both media. The two-component regulatory systems consist of mechanisms that enable P. aeruginosa PAO1 to sense and respond to environmental stimuli and potentially to phage infection. It is worth noting that the observed genes are all upregulated, with the exception of the transcriptional regulator RpoN. RpoN is reported to positively regulate dctPQM genes [34], although, in our data, expression of this transcriptional regulator is not consistent with dctPQM genes expression. Apart from the wspA gene, which encodes a probable chemotaxis transducer, the majority of these genes are involved in metabolism (braDE: transport of amino acids, arcB: L-arginine metabolism, dctPQM genes: transport of c4-dicarboxylates, fdnH: nitrate respiration, rpoN: transcriptional repressor dctPQM genes).
As part of two-component systems, each of the above-mentioned genes is involved in the bacterial recognition of certain signals, according to two-component system KEGG pathways. For example, nitrate presence is a signal to promote nitrogen metabolism, in a pathway in which fdnH is involved. C4-dicarboxylates abundance stimulates the expression of their own transporters, such as dctPQM gene products. Quinone electron carriers are a signal that leads to inhibition of anaerobic respiration, and arcB gene is involved in this signal transduction. braDE genes are part of the signal mechanism that promotes bacitracin efflux when it is abundant. The extracellular polysaccharide production is a result of surface cell contact signal that involves the expression of genes such as wspA. RpoN participates in several signal-response mechanisms that result in a myriad of activities: the induction of amino acids uptake and metabolism; attaching and effacing lesions; pilA expression; regulation of biofilm formation, motility and virulence; flagellar assembly.
In the future, it would be of interest to understand whether the upregulation of two-component regulatory system genes is a bacterial answer to phage infection or if these genes are induced by phage for successful infection. Presumably, the higher expression levels of genes involved in two-component regulatory systems represent a bacterial response to phage infection, as suggested in a previous work, in which the upregulation of pqsABCDE operon was proposed to function as a signal to shut down bacterial metabolism of non-infected cells [7]. While expression of pqs operon was higher during late infection in LB, this difference was not significant compared to uninfected cultures. In contrast, the operon was significantly downregulated in MCCM, highlighting the importance of growth conditions during infection assays that also contribute to changes in gene expression.
Impact of phage infection on replication-, transcription- and translation-associated genes
Expression levels of bacterial genes involved in DNA replication, transcription (transcriptional regulators, RNA repair systems, rRNA methylation) and translation (mRNA degradation and processing) represent the second category of genes influenced by phage infection. These include elongation factor G, ribonuclease E, fleQ, pnp, rRNA methylase, rpoN, rtcR, nusA and algQ genes. These genes are differentially transcribed after phage infection in different media, leading to the same response (except elongation factor G and ribonuclease HII), yet a little more attenuated in MCCM.
Specifically, pnp gene (polyribonucleotide nucleotidyltransferase) and ribonuclease E are both involved in mRNA degradation [41,42]. These are upregulated in LB medium and MCCM, which indicates that, at early infection, mRNA turnover is tightly controlled by the phage.
Regarding the translation process, a putative 23S rRNA methylase is differentially expressed at early infection. This gene is likely involved in the methylation of ribosomal subunits, which is associated with modulation of rRNA maturation, stabilization of rRNA structures and alteration of translation rates [43], but can also be associated with antibiotic resistance acquisition. Tight regulation of RNA turnover early in infection is also confirmed by the differential expression of RNA repair system regulators rpoN (RNA polymerase sigma-54 factor) and rtcR (transcriptional regulator of rctAB genes), which are downregulated independent of the growth medium. RtcR is known to work through RpoN to positively activate the expression of rctAB operon that encodes for two constituents of tRNA repair system [44]. The downregulation of these two regulators indicates that the RNA repair system is repressed, which would be distinct from the P. aeruginosa strain PAK infected by phage PAK_P3, where the expression of rtcAB was significantly upregulated [5]. As mentioned in the previous section, the rpoN transcriptional regulator expression was not consistent with dctPQM genes, although as a transcriptional regulator in rctAB operon system its expression is consistent. This indicates that a broad transcriptional regulator, such as RpoN, functions in distinct ways in bacterial responses and other mechanisms are probably associated to ensure expression regulation.
During early infection, the gene that encodes for the transcription termination/antitermination protein (nusA) is upregulated relative to the uninfected host. The higher expression of this gene indicates the necessity of strict regulation of transcriptional mechanisms during phage infection. The upregulation of this gene might be part of an underlying mechanism that phage deploys to tightly control host machinery. It would be interesting to investigate this further in the future.
Besides the differentially expressed genes being involved in the control of translation and transcription, other two transcriptional regulators are significantly targeted at this phase: transcriptional regulator fleQ and betI. FleQ, together with FleR, is involved in a regulatory cascade that controls motility and adhesion in P. aeruginosa [45]. In our data, FleQ is downregulated and since its expression is crucial for the control of motility and adhesion, the lower expression of it can lead to a non-control of this important bacterial aspect, which might impact bacterial infection establishment. The global transcriptional P. aeruginosa regulator and repressor of lasR and rhl, the algQ gene, is also downregulated at early infection, suggesting that bacterial control is no longer available, leading to failure in the regulation of quorum-sensing systems [46]. With our data, it was not possible to determine if the shutdown of bacterial functions such as quorum sensing, motility and adhesion would be beneficial for phage infection, being a probable mechanism of phage to manipulate its host.
Growth medium influences gene expression levels at early infection
Our initial experiments show that the growth medium has only a minor influence on the phage transcriptome but greatly affects bacterial transcripts. In this section, we will highlight the specific host responses during early infection that are driven by the growth medium. Table 2 presents PAO1 genes that were significantly yet differentially expressed at early infection between both media.
A first example is glpD, which encodes a glycerol-3-phosphate dehydrogenase (G3P), which acts as a key player in energy metabolism (involved in glycerol metabolism). In our data, at the early infection points, this gene is upregulated in MCCM and downregulated in LB medium, indicating a higher necessity of the expression of this gene in MCCM. It is known that the complete abolishment of this gene leads to alterations in amino acids metabolism and the production of TCA intermediates, ending in a general stress response [47]. The tight control of the expression of this gene seems to be imperative for proper metabolism functionalization. As such, it appears to be an essential gene to target to achieve ideal infection conditions.
Another bacterial gene that was upregulated in MCCM yet downregulated in LB medium after phage infection is thiI. This protein is involved in the biosynthesis of thiazol (precursor of thiamine–vitamin 1). In bacteria, thiamine is an important cofactor with a fundamental role in energy metabolism [47]. The upregulation of thiazol biosynthesis during phage infection in MCCM indicates that there is a low concentration of this precursor in this medium, and it might be highly required to generate vitamin 1 in the infection context (compared to uninfected bacteria in the same media).
A clearly differentiated response between LB and MCCM during phage infection was also observed for dadX and dadA. Their gene products are involved in the alanine metabolism and are upregulated in MCCM and downregulated in LB. The presence of L-alanine prevenient from intrinsic metabolism is reported to be the main inducer of dadAX genes [48]. Possibly, the MCCM represents an energy starvation condition for PAO1, contrary to LB, which would activate these genes to produce nitrate and in pyruvate fermentation. Indeed, it was previously reported that nitrate can serve as an alternative of electron acceptor under anaerobic conditions in PAO1 and that pyruvate fermentation plays an important role as a general endogenous survival metabolism in response to energy starvation [49]. As such, the use of MCCM might better mimic anaerobic conditions, typical of biofilm and cystic fibrosis infection conditions, as reflected by the shift in amino acids metabolism.
Beyond leading to a different transcription of metabolic genes during phage infection, the growth medium also influenced genes with functions related to transcription and translation. Namely, the gene that encodes ribonuclease HII (degrades RNA from RNA–DNA hybrids) [50] is targeted after phage infection, downregulated in LB medium but upregulated in MCCM. Similarly, elongation factor G (fusA2) that is responsible for the catalyzation of GTP-dependent ribosomal translocation step during translation elongation, an important step during translation [51], is upregulated in MCCM but the same is not observed for LB media.
Another interesting observation is the differential transcription of the transcriptional regulator betI. This gene is upregulated in MCCM and downregulated in LB medium. When transcribed, betI represses betT, involved in choline transport, and represses betAB gene expression, which in turn are involved in choline oxidation to generate glycine betaine [52]. Glycine betaine is reported to function as an osmo-protector, promoting P. aeruginosa virulence and survival in mouse lung [52]. Inhibition of choline–betaine pathway is highly toxic to P. aeruginosa but upon phage infection in MCCM, the upregulation of betI gene leads to the repression of betAB genes, which was also observed in PaP1-infected P. aeruginosa [53].
We were able to show differences in bacterial gene expression patterns following phage infection in LB compared to MCCM, and it is tempting to speculate that these changes are triggered by the phage, although a response of the bacterium in this medium in the presence of phage remains equally plausible. Regardless, these data suggest optimal conditions for phage propagation are attained, in view of the expression profile convergence later in infection.
Conclusions
RNA-seq of LUZ19-infected P. aeruginosa PAO1 cultures demonstrates that major transcriptional changes occur at the early infection stage, during the bacterial takeover. This early expression stage is marked by specific changes in expression levels, targeting energy metabolism, translation and transcription. A medium-specific response to phage infection was also observed, targeting a handful of regulatory genes that share a common response in terms of adapting to the limitations imposed by MCCM compared to LB medium. It is interesting that this response visualized at early infection does not influence LUZ19 infection that proceeds largely uninterrupted and efficiently, despite these limitations.
In this work, it is tempting to speculate that this small yet densely coded phage has the genomic versatility to readily adapt the host machinery towards its needs. This would cast a different light on the types of analyses needed to understand some of the ‘viral dark matter’ genes and their role under non-standard growth conditions.
From a phage therapy perspective, a first step towards assessing the efficiency and impact of this phage in the mammalian cell growth medium was taken, paving the way to uncover the phage infection process in conditions comprising the three partners involved: phage–bacteria–human cell. Within this context, the versatility shown by LUZ19 appears promising, as this phage is well adapted to the different environmental conditions imposed.
Supplementary Material
Funding Statement
This study was supported by the Portuguese Foundation for Science and Technology (FCT) under the scope of the project PTDC/BBB-BSS/6471/2014 (POCI-01-0145-FEDER-016643) and the strategic funding of UIDB/04469/2020 unit. AB is supported by FCT through the grant SFRH/BD/133193/2017. This research was supported by funding from the European Research Council under the European Union’s Horizon 2020 research and innovation programme (Grant agreement No. 819800) awarded to RL.
Disclosure of Potential Conflicts of Interest
No potential conflict of interest was reported by the authors.
Supplementary material
Supplemental data for this article can be accessed here.
References
- [1].Salmond GPCC, Fineran PC.. A century of the phage: past, present and future. Nat Rev Microbiol. 2015;13:777–786. [DOI] [PubMed] [Google Scholar]
- [2].Hatfull GF. Dark matter of the biosphere: the amazing world of bacteriophage diversity. J Virol. 2015;89:8107–8110. [DOI] [PMC free article] [PubMed] [Google Scholar]
- [3].Zhao X, Chen C, Shen W, et al. Global transcriptomic analysis of interactions between Pseudomonas aeruginosa and bacteriophage PaP3. Sci Rep. 2016;6:1–12. [DOI] [PMC free article] [PubMed] [Google Scholar]
- [4].De Smet J, Hendrix H, Blasdel BG, et al. Pseudomonas predators: understanding and exploiting phage–host interactions. Nat Rev Microbiol. 2017;15:517–530. [DOI] [PubMed] [Google Scholar]
- [5].Chevallereau A, Blasdel BG, De Smet J, et al. Next-generation “-omics” approaches reveal a massive alteration of host RNA metabolism during bacteriophage infection of Pseudomonas aeruginosa. PLOS Genet. 2016;12:e1006134. [DOI] [PMC free article] [PubMed] [Google Scholar]
- [6].Sacher JC, Flint A, Butcher J, et al. Transcriptomic analysis of the Campylobacter jejuni response to T4-like phage NCTC 12673 infection. Viruses. 2018;10:332. [DOI] [PMC free article] [PubMed] [Google Scholar]
- [7].Blasdel BG, Ceyssens P-J, Chevallereau A, et al. Comparative transcriptomics reveals a conserved Bacterial Adaptive Phage Response (BAPR) to viral predation. bioRxiv. 2018;248849. [Google Scholar]
- [8].Yang Z, Yin S, Li G, et al. Global transcriptomic analysis of the interactions between phage ɸAbp1 and extensively drug-resistant Acinetobacter baumannii. Am Soc Microbiol. 2019;4:1–12. [DOI] [PMC free article] [PubMed] [Google Scholar]
- [9].Mojardín L, Salas M. Global transcriptional analysis of virus-host interactions between phage ϕ29 and bacillus subtilis. J Virol. 2016;90:9293–9304. [DOI] [PMC free article] [PubMed] [Google Scholar]
- [10].Zhao X, Chen C, Jiang X, et al. Transcriptomic and metabolomic analysis revealed multifaceted effects of phage protein Gp70.1 on Pseudomonas aeruginosa. Front Microbiol. 2016;7:1–14. [DOI] [PMC free article] [PubMed] [Google Scholar]
- [11].Leskinen K, Blasdel BG, Lavigne R, et al. RNA-sequencing reveals the progression of Phage-Host interactions between φR1-37 and Yersinia enterocolitica. Viruses. 2016;8:111. [DOI] [PMC free article] [PubMed] [Google Scholar]
- [12].Morimoto D, Kimura S, Sako Y, et al. Transcriptome analysis of a bloom-forming cyanobacterium Microcystis aeruginosa during Ma-LMM01 phage infection. Front Microbiol. 2018;9:1–13. [DOI] [PMC free article] [PubMed] [Google Scholar]
- [13].Blasdel BG, Chevallereau A, Monot M, et al. Comparative transcriptomics analyses reveal the conservation of an ancestral infectious strategy in two bacteriophage genera. Isme J. 2017;11:1988–1996. [DOI] [PMC free article] [PubMed] [Google Scholar]
- [14].Ceyssens P-J, Minakhin L, Van den Bossche A, et al. Development of giant bacteriophage ΦKZ is independent of the host transcription apparatus. J Virol. 2014;88:10501–10510. [DOI] [PMC free article] [PubMed] [Google Scholar]
- [15].Lin X, Ding H, Zeng Q. Transcriptomic response during phage infection of a marine cyanobacterium under phosphorus-limited conditions. Environ Microbiol. 2016;18:450–460. [DOI] [PubMed] [Google Scholar]
- [16].Lavigne R, Lecoutere E, Wagemans J, et al. A multifaceted study of Pseudomonas aeruginosa shutdown by virulent podovirus LUZ19. MBio. 2013;4:e00061–13. [DOI] [PMC free article] [PubMed] [Google Scholar]
- [17].Lammens E, Ceyssens PJ, Voet M, et al. Representational Difference Analysis (RDA) of bacteriophage genomes. J Microbiol Methods. 2009;77:207–213. [DOI] [PubMed] [Google Scholar]
- [18].Zabner J, Karp P, Seiler M, et al. Development of cystic fibrosis and noncystic fibrosis airway cell lines. Am J Physiol Cell Mol Physiol. 2003;284:L844–L854. [DOI] [PubMed] [Google Scholar]
- [19].Ceyssens PJ, Mesyanzhinov V, Sykilinda N, et al. The genome and structural proteome of YuA, a new Pseudomonas aeruginosa phage resembling M6. J Bacteriol. 2008;190:1429–1435. [DOI] [PMC free article] [PubMed] [Google Scholar]
- [20].Azeredo J, Sillankorva S, Pires DP. Pseudomonas bacteriophage isolation and production. In: Filloux A, Ramos J-L, editors. Pseudomonas methods and protocols: methods in molecular biology. New York: Humana Press; 2014. p. 23–32. [DOI] [PubMed] [Google Scholar]
- [21].Blaize JF, Suter E, Corbo CP. Serial dilutions and plating: microbial enumeration. JoVE. 2020. [Google Scholar]
- [22].Andrews S. FastQC A quality control tool for high throughput sequence data. Babraham Bioinforma. 2010. http://www.bioinformatics.babraham.ac.uk/projects/fastqc. [Google Scholar]
- [23].Langmead B, Trapnell C, Pop M, et al. Ultrafast and memory-efficient alignment of short DNA sequences to the human genome. Genome Biol. 2009;10:R25. [DOI] [PMC free article] [PubMed] [Google Scholar]
- [24].Liao Y, Smyth GK, Shi W. FeatureCounts: an efficient general purpose program for assigning sequence reads to genomic features. Bioinformatics. 2014;30:923–930. [DOI] [PubMed] [Google Scholar]
- [25].Love MI, Huber W, Anders S. Moderated estimation of fold change and dispersion for RNA-seq data with DESeq2. Genome Biol. 2014;15:1–21. [DOI] [PMC free article] [PubMed] [Google Scholar]
- [26].Benjamini Y, Hochberg Y. Controlling the false discovery rate: a practical and powerful approach to multiple testing. J R Stat Soc Ser B. 1995;57(1)289–300. [Google Scholar]
- [27].Lavigne R, Lecoutere E, Wagemans J, et al. A multifaceted study of Pseudomonas aeruginosa shutdown by virulent podovirus LUZ19. MBio. 2013;4:1–13. [DOI] [PMC free article] [PubMed] [Google Scholar]
- [28].Chibani-chennoufi S, Bruttin A, Dillmann M, et al. Phage-host interaction: an ecological perspective. J Bacteriol. 2004;186:3677–3686. [DOI] [PMC free article] [PubMed] [Google Scholar]
- [29].Nabergoj D, Modic P, Podgornik A. Effect of bacterial growth rate on bacteriophage population growth rate. Microbiologyopen. 2018;7:1–10. [DOI] [PMC free article] [PubMed] [Google Scholar]
- [30].Wagner VE, Bushnell D, Passador L, et al. Microarray analysis of Pseudomonas aeruginosa quorum-sensing regulons: effects of growth phase and environment. J Bacteriol. 2003;185:2080–2095. [DOI] [PMC free article] [PubMed] [Google Scholar]
- [31].Nairz M, Schroll A, Sonnweber T, et al. The struggle for iron - a metal at the host-pathogen interface. Cell Microbiol. 2010;12:1691–1702. [DOI] [PubMed] [Google Scholar]
- [32].Minandri F, Imperi F, Frangipani E, et al. Role of iron uptake systems in Pseudomonas aeruginosa virulence and airway infection. Infect Immun. 2016;84:2324–2335. [DOI] [PMC free article] [PubMed] [Google Scholar]
- [33].Li G, Lu CD. Molecular characterization and regulation of operons for asparagine and aspartate uptake and utilization in Pseudomonas aeruginosa. Microbiol (United Kingdom). 2018;164:205–216. [DOI] [PubMed] [Google Scholar]
- [34].Valentini M, Storelli N, Lapouge K. Identification of C4-dicarboxylate transport systems in Pseudomonas aeruginosa PAO1. J Bacteriol. 2011;193:4307–4316. [DOI] [PMC free article] [PubMed] [Google Scholar]
- [35].Mahmoudabadi G, Milo R, Phillips R. Energetic cost of building a virus. Proc Natl Acad Sci USA. 2017;114:E4324–E4333. [DOI] [PMC free article] [PubMed] [Google Scholar]
- [36].Sepúlveda Cisternas I, Salazar JC, García-Angulo VA. Overview on the bacterial iron-riboflavin metabolic axis. Front Microbiol. 2018;9:1–7. [DOI] [PMC free article] [PubMed] [Google Scholar]
- [37].Wagemans J, Blasdel BG, Van den Bossche A, et al. Functional elucidation of antibacterial phage ORFans targeting Pseudomonas aeruginosa. Cell Microbiol. 2014;16:1822–1835. [DOI] [PubMed] [Google Scholar]
- [38].Lu CD, Itoh Y, Nakada Y, et al. Functional analysis and regulation of the divergent spuABCDEFGH-spuI operons for polyamine uptake and utilization in Pseudomonas aeruginosa PAO1. J Bacteriol. 2002;184:3765–3773. [DOI] [PMC free article] [PubMed] [Google Scholar]
- [39].Yu T-Y, Schaefer J. REDOR NMR characterization of DNA packaging in bacteriophage T4. J Mol Biol. 2008. Aug 05;382:1031–1042. [DOI] [PMC free article] [PubMed] [Google Scholar]
- [40].Ames BN, Dubin DT, Rosenthal SM. Presence of polyamines in certain bacterial viruses. Science. 1958;127:814 LP– 816. [DOI] [PubMed] [Google Scholar]
- [41].Saravanamuthu SS, Chozhavendan R, Geffers R, et al. Evidence for polyadenylated mRNA in Pseudomonas aeruginosa. J Bacteriol. 2004;186:7015–7018. [DOI] [PMC free article] [PubMed] [Google Scholar]
- [42].Cormack RS, Genereaux JL, Mackie GA. RNase E activity is conferred by a single polypeptide: overexpression, purification, and properties of the ams/rne/hmp1 gene product. Proc Natl Acad Sci USA. 1993;90:9006–9010. [DOI] [PMC free article] [PubMed] [Google Scholar]
- [43].Doi Y, Arakawa Y. 16S ribosomal RNA methylation: emerging resistance mechanism against aminoglycosides. Clin Infect Dis. 2007;45:88–94. [DOI] [PubMed] [Google Scholar]
- [44].Genschik P, Drabikowski K, Filipowicz W. Characterization of the Escherichia coli RNA 3ʹ-terminal phosphate cyclase and its σ54-regulated operon. J Biol Chem. 1998;273:25516–25526. [DOI] [PubMed] [Google Scholar]
- [45].Arora SK, Ritchings BW, Almira EC, et al. A transcriptional activator, FleQ, regulates mucin adhesion and flagellar gene expression in Pseudomonas aeruginosa in a cascade manner. J Bacteriol. 1997;179:5574–5581. [DOI] [PMC free article] [PubMed] [Google Scholar]
- [46].Ledgham F, Soscia C, Chakrabarty A, et al. Global regulation in Pseudomonas aeruginosa: the regulatory protein AlgR2 (AlgQ) acts as a modulator of quorum sensing. Res Microbiol. 2003;154:207–213. [DOI] [PubMed] [Google Scholar]
- [47].Shuman J, Giles TX, Carroll L, et al. Transcriptome analysis of a Pseudomonas aeruginosa sn-glycerol-3-phosphate dehydrogenase mutant reveals a disruption in bioenergetics. Microbiol (United Kingdom). 2018;164:551–562. [DOI] [PubMed] [Google Scholar]
- [48].He W, Li C, Lu CD. Regulation and characterization of the dadRAX locus for D-amino acid catabolism in Pseudomonas aeruginosa PAO1. J Bacteriol. 2011;193:2107–2115. [DOI] [PMC free article] [PubMed] [Google Scholar]
- [49].Goodwine J, Gil J, Doiron A, et al. Pyruvate-depleting conditions induce biofilm dispersion and enhance the efficacy of antibiotics in killing biofilms in vitro and in vivo. Sci Rep. 2019;9:1–16. [DOI] [PMC free article] [PubMed] [Google Scholar]
- [50].Rodionova IA, Zhang Z, Aboulwafa M, et al. UDP-glucose dehydrogenase Ugd in E. coli is activated by Gm and RffD, is inhibited by CheY and regulates swarming. bioRxiv. 2020. [Google Scholar]
- [51].Palmer SO, Rangel EY, Hu Y, et al. Two homologous EF-G proteins from Pseudomonas aeruginosa exhibit distinct functions. PLoS One. 2013;8:1–12. [DOI] [PMC free article] [PubMed] [Google Scholar]
- [52].Wargo MJ. Homeostasis and catabolism of choline and glycine betaine: lessons from Pseudomonas aeruginosa. Appl Environ Microbiol. 2013;79:2112–2120. [DOI] [PMC free article] [PubMed] [Google Scholar]
- [53].Zhao X, Shen M, Jiang X, et al. Transcriptomic and metabolomics profiling of phage-host interactions between phage PaP1 and Pseudomonas aeruginosa. Front Microbiol. 2017;8:1–10. [DOI] [PMC free article] [PubMed] [Google Scholar]
Associated Data
This section collects any data citations, data availability statements, or supplementary materials included in this article.