ABSTRACT
Riboswitches are RNA-based regulatory elements that utilize ligand-induced structural changes in the 5ʹ-untranslated region of mRNA to regulate the expression of associated genes. The majority of synthetic riboswitches have been selected and tested in cell-based systems. Cell-free protein expression systems (CFPS) have several advantages for the development and testing of synthetic riboswitches, including eliminating interactions with complex cellular networks, and the decoupling of transcription and translation processes. To gain a better understanding of the riboswitch regulatory mechanism, to allow for more efficient riboswitch optimization and use for biosensing applications, we studied the performance of a theophylline-responsive synthetic riboswitch coupled with the superfolder green fluorescent protein (sfGFP) reporter gene in E. coli cellular extract and PURE cell-free systems. To monitor the mRNA dynamics, a malachite green aptamer sequence was added to the 3ʹ-untranslated region of sfGFP mRNA. Performance of the theophylline riboswitch was compared with a constitutively expressed sfGFP (control). Transcription dynamics of the riboswitch mRNA was very similar to the transcription of the control mRNA for all theophylline concentrations tested in both E. coli extract and PURE CFPS. However, sfGFP expression in the riboswitch construct was one order of magnitude lower, even at the highest concentration of theophylline. A mathematical model of riboswitch activation governed by the kinetic trapping mechanism was developed. Two factors – a reduced fraction of mRNA in the ‘ON’ state and a considerably lower translation initiation rate in the riboswitch – contribute to the much lower level of protein expression in the theophylline riboswitch compared to the control construct.
KEYWORDS: Riboswitch, cell-free protein expression systems, dose response, riboswitch activation, kinetic modelling
Introduction
Biological systems have diverse ways to control gene expression. Riboswitches are regulatory elements located in the non-coding region of mRNAs that change the folded structure of the mRNA upon the binding of an effector molecule and, as a consequence, alter the expression of the downstream gene [1]. Besides the naturally evolved riboswitches that are triggered by cellular metabolites, several synthetic riboswitches have been developed that can sense and respond to non-endogenous small molecules such as theophylline [2], tetracycline [3] or 2,4-dinitrotoluene [4]. Due to their specificity and selectivity, synthetic riboswitches are attractive tools for sensing applications [5–7].
Synthetic riboswitches can be engineered to regulate the expression of a reporter gene in response to any non-natural molecule that is capable of being bound by RNA. However, once a riboswitch is developed, it may still require further optimization in order to be transitioned into applications. A better understanding of the riboswitch regulatory mechanism would facilitate the optimization of its performance and enable the development of improved riboswitch-based biosensors. We used cell-free protein expression systems (CFPS) to study the performance of the theophylline synthetic riboswitch. The CFPS are transcription/translation systems that provide a functional environment similar to the cellular systems for design and characterization of genetic circuits. They not only eliminate the unpredictable interactions of designed circuits with the host processes but also allow to control and monitor processes that are difficult or impossible to monitor in cell-based systems [8]. The CFPS allow simultaneous monitoring of transcription and translation processes and can serve as good models for riboswitch function in vivo. It was previously shown that in a cell-free system, the theophylline riboswitch functions similarly to how it regulates gene expression in E. coli cells [9]. Considering this, we sought to further investigate the synthetic riboswitch regulatory mechanism, using two types of CFPS: in house prepared E. coli S30 extract [10] and a commercial system of purified recombinant components (PURE system from New England Biolabs).
Several approaches have been employed to measure the real-time transcription and translation kinetics in cell-free systems including molecular beacons [11], side-by-side oligonucleotide probes [12], Spinach aptamer [13,14] and malachite green aptamer (MGapt) [8]. In the present study, we used theMGapt to monitor the level of mRNA and the superfolder green fluorescent protein (sfGFP) [15] to monitor protein synthesis. The fluorescent dye of the Spinach aptamer – DFHBI – was derived from the GFP chromophore and, therefore, its emission spectra overlap with the spectra of green fluorescent proteins, which, up to date, have the best performance in terms of brightness and photostability among other fluorescent proteins [16].
The experimental research for riboswitch design and optimization in the CFPS was accompanied by computational modelling and simulations. Several models for gene expression in cell-free systems have been proposed. These models offer different degrees of complexity, ranging from a minimalist model with just 6 components and 5 reactions [11] to a maximalist model consisting of 241 components and 968 reactions [17]. These models differ in the degree of details (or model granularity) and have their advantages and disadvantages. The minimalist model is a simple model, most processes in this model can be observed and measured experimentally, and it can be easy transferred to different cell-free systems. On the other hand, the maximalist model describes processes in CFPS with great detail. However, it requires measurement or knowledge of the concentrations of all molecules in the system, as well as the estimation of a large number of unknown kinetic parameters. Furthermore, it is difficult to transfer such a complex model to a different CFPS. Our mathematical model of gene expression is similar to the model that was proposed to describe the dynamics of gene expression in PURE system [11] and represent the three most important processes: transcription, translation and riboswitch activation. The kinetics of all these three processes can be measured experimentally: transcription – by measuring the level of mRNA molecules; translation – by measuring the fluorescence of the reporter protein; and riboswitch activation – by measuring fluorescence in the presence of the ligand at different concentrations. Such a combination of experimental measurements and mathematical modelling allowed us to characterize the mechanism of activation of the theophylline riboswitch and to identify key factors that influence its performance.
Results and discussions
Experimental measurements
Two constructs were developed and studied in both E. coli S30 extract and PURE cell-free systems. In the first, control construct, the DNA sequence encoding the sfGFP was linked in the 3ʹ-untranslated region (UTR) with an RNA aptamer MGapt that recognizes the chromophore malachite green with a high level of affinity [18]. The emission spectrum of malachite green fluorescence does not overlap with that of sfGFP allowing simultaneous monitoring of transcription and translation processes in cell-free systems (Fig. 1A). In the second construct, the expression of sfGFP was regulated by the theophylline riboswitch [19] that controls the translation of the reporter gene in response to binding of a small molecule theophylline (Fig. 1B). With these constructs, the kinetics of mRNA synthesis and sfGFP production in cell-free systems were monitored using varying concentrations of DNA templates and different concentrations of the analyte theophylline.
Figure 1.
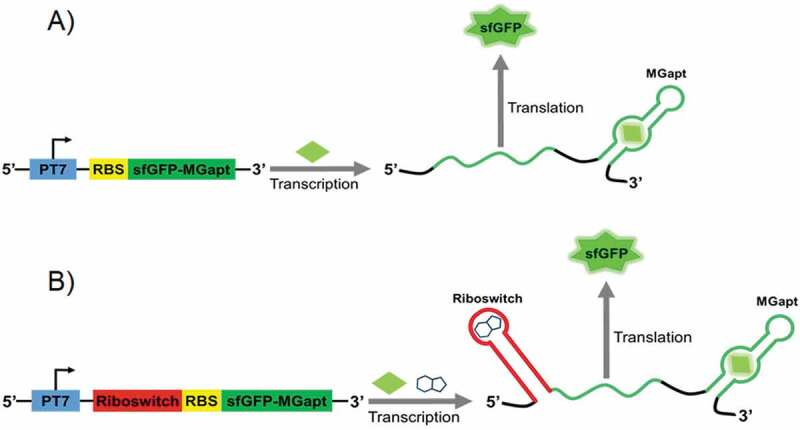
The reporter constructs encode green fluorescent protein (sfGFP) along with malachite green RNA aptamer (MGapt) in the 3ʹ-UTR. The riboswitch performance (B) was compared with the expression of the control construct (A) in S30 extract and PURE cell-free systems
Fig. 2 shows the kinetics of mRNA synthesis and sfGFP production of the control construct in PURE and S30 extract cell-free systems at different concentrations of DNA plasmids. Six concentrations of DNA templates in the range of 0.044 nM to 1.76 nM were used. An increase in the concentration of synthesized mRNA with increasing of the DNA concentration was observed in both systems. The mRNA was degraded over time in the S30 extract, while in PURE system, the level of mRNA increased over time and reached a steady state after 10 h of expression (Fig. 2A). The S30 extract contains a variety of cellular enzymes including nucleases that cleave mRNAs and decrease their lifetime. It should be noted that we observed a shoulder on the mRNA synthesis curve in the PURE system after 200–300 min of gene expression (Fig. 2A). The appearance of a shoulder on mRNA curves was not recorded in previous studies that described the dynamics of mRNA synthesis in PURE systems [11–14]. Considering this, we assumed that the appearance of the shoulder is not associated with the actual dynamics of mRNA synthesis, but could be related to the malachite green binding to the aptamer under these specific conditions. Other PURE system protocols that utilize a fluorescent dye-binding aptamer to monitor mRNA production add DNaseI after around 60–100 min of gene expression to degrade DNA and to stop the transcription process [14]. However, we did not use DNaseI, and monitored the level of transcribed mRNA for the whole time course of gene expression. Although the DNA template concentration changed from 0.044 nM to 1.76 nM, the level of sfGFP expression did not change significantly with DNA template concentration higher than 0.22 nM in S30 extract and higher than 0.44 nM in the PURE system. This could indicate that protein production was saturated at these DNA template concentrations. As suggested earlier, this saturation occurs when the translation machinery is entirely depleted [8,20]. For instance, at a sufficiently large concentration of synthesized mRNA, all the ribosomes are performing translation. Furthermore, in the PURE system at DNA concentrations greater than 0.22 nM, the level of sfGFP synthesis is decreasing, while the transcription of mRNA is still increasing. A similar effect was also observed in E. coli extract and was attributed to resource competition for transcription that has been taken at the expense of protein production [8]. Therefore, adding more DNA template to the reaction would not produce more protein.
Figure 2.
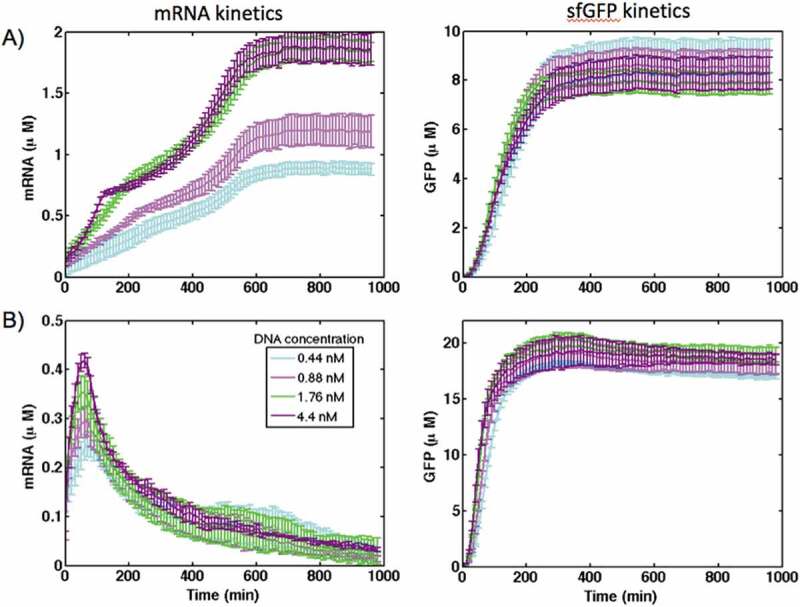
The kinetics of gene expression for the control construct in (A) PURE and (B) S30 extract cell-free systems at different concentration of DNA plasmids. The transcription was reported by synthesis of MGapt and translation was monitored with sfGFP production
The comparison of the kinetics of mRNA synthesis and sfGFP production in the control construct and under the regulation of theophylline riboswitch in cell-free systems is presented in Fig. 3. The mRNA kinetics for riboswitch at different theophylline concentrations was similar to that of the control construct for both cell-free systems, and was not affected by the concentration of theophylline. This confirms that the theophylline riboswitch operates at the translational level. However, although the level of synthesized sfGFP under riboswitch control increased with increasing theophylline concentration, it is one order of magnitude lower compared with the control construct in both cell-free systems (Fig. 3). This suggests the presence of additional factors that affect the protein expression from the riboswitch-controlled construct.
Figure 3.
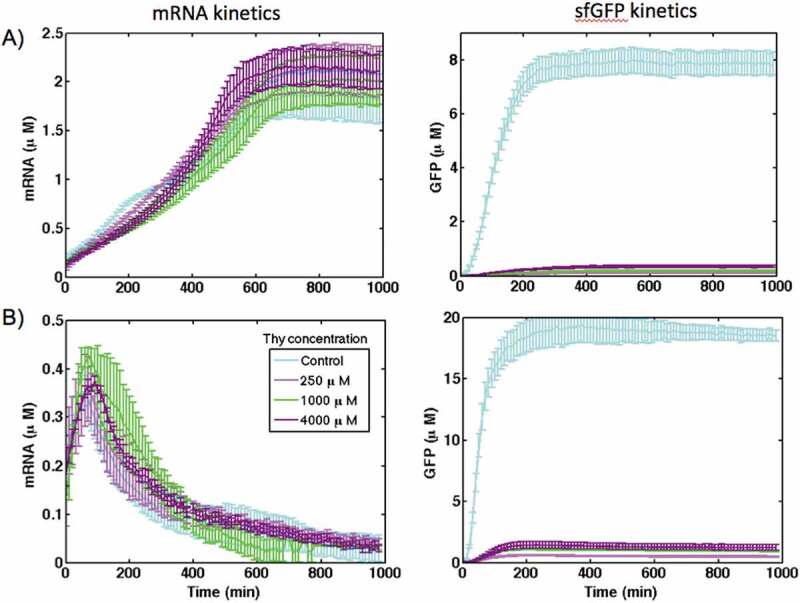
The kinetics of mRNA synthesis and sfGFP production for the theophylline riboswitch in comparison with the control construct in (A) PURE and (B) S30 extract cell-free systems at different concentration of theophylline. DNA template concentration is 1.76 nM
The measurement of mRNA kinetics using the MGapt was verified by using quantitative real-time PCR (Fig. 4). Both methods demonstrate similar transcriptional kinetics for the riboswitch in the ‘OFF’ and ‘ON’ states at selected time points in the PURE system and S30 extract.
Figure 4.
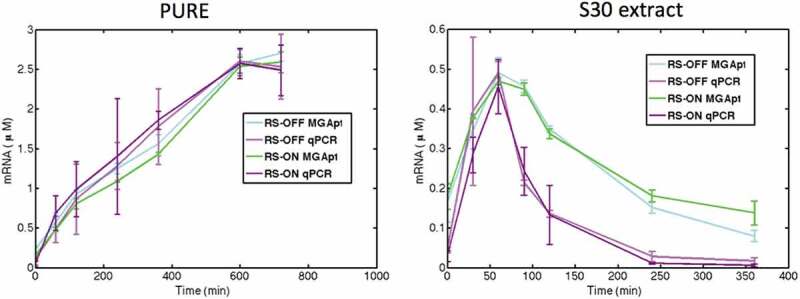
Comparison of mRNA level quantification for riboswitch in the ‘OFF’ and ‘ON’ states at selected time points in PURE and S30 extract using malachite green aptamer and qRT-PCR techniques
Mathematical modelling
To clarify the mechanism of riboswitch activation and to identify factors that influence its performance, the experimental results were accompanied by computational modelling and simulations. As a first step, a generic mathematical model of gene expression that can be applied to both PURE and S30 extract cell-free systems was developed. The transcription of DNA and synthesis of mRNA are described by a single equation:
,
where the TsR variable combines all the transcriptional resources [11]. In a similar way, the translation of mRNA and protein synthesis are also described by a single equation:
,
where TlR is the combined translational resources. In total, the mathematical model of gene expression for the control construct contained 6 species, 6 reactions and 12 kinetic parameters (for details, see ‘Materials and Methods’ section). Experimental results for the control constructs were used to establish a baseline and to estimate the transcription and translation rates, as well as other generic kinetic parameters for PURE and S30 extract CFPS. As a next step, that mathematical model was extended to describe the riboswitch activation in cell-free systems.
There are two potential mechanisms of riboswitch activation: the thermodynamic equilibrium model and kinetic trapping model [9]. In the equilibrium model, without the ligand present, all synthesized mRNA molecules adopt the ‘OFF’ state conformation and there is no translation. When a ligand is added, already synthesized mRNAs change their conformation into an ‘ON’ state and translate into proteins. This process can be described by the following mathematical equation:
.
In the thermodynamic equilibrium model, the presence of the ligand changes the equilibrium between the ‘OFF’ and ‘ON’ states of the riboswitch.
In the kinetic trapping model, synthesized mRNA also adopts the ‘OFF’ state conformation without the ligand. However, for mRNA to adopt the ‘ON’ state conformation, the ligand needs to be present during the transcription. It is trapped by the riboswitch and mRNA is synthesized in the ‘ON’ state conformation. Mathematically, the kinetic trapping model can be presented as
.
To identify the activation mechanism of the theophylline riboswitch, 2 mM theophylline was added at different time points in separate experiments during the expression of the riboswitch construct in the PURE system (Figure S3). In all cases, the kinetics of mRNA synthesis was similar to that of the riboswitch in the ‘OFF’ state (no theophylline was added). However, the level of sfGFP expression was dependent on the time of theophylline addition. Addition of theophylline 30 min and 60 min after the start of the reaction resulted in a twofold and fivefold decrease in the level of synthesized sfGFP compared to the reaction when theophylline was added at the beginning (0 min). When theophylline was added at 90 min, the level of sfGFP was the same as for the riboswitch in the ‘OFF’ state. Although the level of mRNA increased linearly before reaching a steady state at around 600 min, the translation was terminated at around 400 min (Figure S3). There are several reasons for the early termination of translation in cell-free systems such as resource competition [21] and ribosome inhibition by the by-products of transcription [22]. For example, Stögbauer et al. [11] added fresh ribosomes to PURE system after 3 h of expression and observed a 180% increase in the protein synthesis. To eliminate the effects of transcription, riboswitch activation was monitored in both CFPS using an in vitro synthesized and purified riboswitch mRNA transcript as a template for translation reactions. Fig. 5 shows the kinetics of sfGFP synthesis for two concentrations of riboswitch mRNA transcript, 1.0 μM and 2.0 μM, in the absence (riboswitch is in the ‘OFF’ state) and presence of 2 mM theophylline. As a negative control, 2 mM theophylline was added to cell-free reactions without mRNA templates. For both mRNA concentrations in both CFPS, only the background signal was observed without any riboswitch activation. In contrast, a control mRNA lacking a riboswitch resulted in expression of sfGFP in both CFPS, demonstrating the functionality of in vitro produced mRNA (Figure S4). It should be noted that concentrations of produced sfGFP using mRNA transcripts (~2 µM in PURE system and ~12 µM in S30 extract) were lower compared with those when the protein was expressed from plasmid DNA (~8 µM in PURE system and ~18 µM in S30 extract). Similar differences were previously observed when DNA plasmids or mRNA transcripts were used as templates for protein synthesis in cell-free systems [23].
Figure 5.
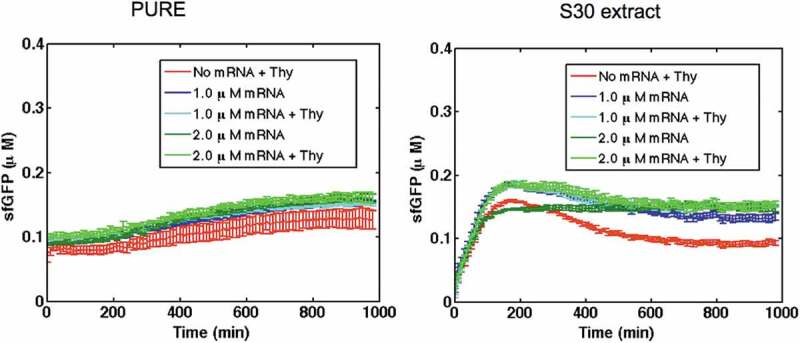
Expression of theophylline riboswitch mRNA transcripts in PURE system and S30 extract in the absence and presence of 2 mM theophylline. No riboswitch activation was observed. As a negative control, 2 mM theophylline was added to CFPS without the mRNA transcript
These results indicated that theophylline riboswitch activation is governed by the kinetic trapping mechanism. The theophylline molecules need to be present during the transcription of DNA in order for riboswitch to adopt an ‘ON’ state conformation. Similar results were also observed during the analysis of theophylline riboswitch activation in E. coli extract [9]. Therefore, the kinetic trapping model was used to model the riboswitch activation. The transcription of DNA without theophylline results in the synthesis of mRNA in the ‘OFF’ state while in the presence of theophylline both mRNA_off and mRNA_on are synthesized.
The mRNAs in both ‘OFF’ and ‘ON’ state are translated into proteins but with different translation rates. Translation of mRNAs in the ‘OFF’ state resulted in background fluorescence even without theophylline. Monitoring of mRNA synthesis with the MGapt construct measures the total concentration of mRNA but it cannot discriminate riboswitches in ‘OFF’ and ‘ON’ states. Mathematical modelling allowed us to separate the fraction of mRNAs in ‘OFF’ and ‘ON’ states.
Comparison of mRNA and sfGFP levels in the control and riboswitch constructs in PURE system (Fig. 3A) and S30 extract (Fig. 3B) shows that in both systems mRNA kinetics is the same at different theophylline concentrations and similar to the control construct without the riboswitch. This means that the transcription rate of the riboswitch is the same as the control construct. Therefore, the kinetic parameters of DNA transcription obtained for the control construct were used to model riboswitch activation. Conversely, sfGFP levels in the riboswitch, even at the highest concentration of theophylline, are 10 to 15 times lower than in the control construct indicating that translation rates in the control construct and the riboswitch are different. Therefore, kinetic parameters for translation of mRNA for the riboswitch were estimated using experimental measurements.
Modelling results (Fig. 6) show that even at the highest concentration of theophylline, only a part of mRNA molecules (around ~67% in PURE system and ~80% in S30 extracts) are in the ‘ON’ state. We also calculated the dose response for the theophylline riboswitch in both cell-free systems and compared obtained results with the experimental measurements (Fig. 7).
Figure 6.
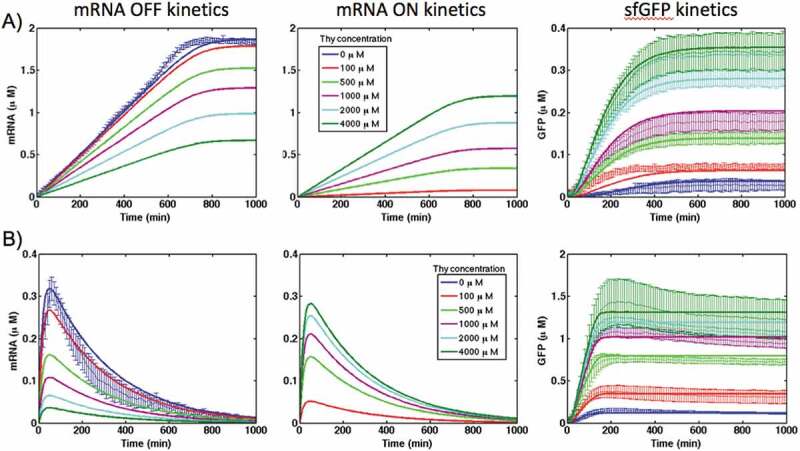
Kinetics of mRNA in ‘OFF’ and ‘ON’ states and sfGFP expression of theophylline riboswitch at different concentration of theophylline in PURE (A) and S30 extract (B) cell-free systems. Solid lines are modelling results and lines with error bars represent the experimental data
Figure 7.
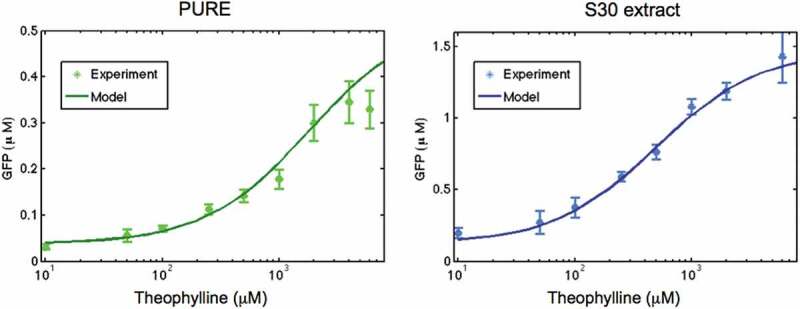
Dose response of theophylline riboswitch in PURE and E. coli extract cell-free system. Solid lines are modelling results and error bars represent the experimental data. Concentration of theophylline is shown on the logarithmic scale
The activation ratio, calculated as the ratio of sfGFP fluorescence in the ‘ON’ state to the fluorescence in the ‘OFF’ state, AR = GFP(ON)/GFP(OFF), is similar in both CFPS: AR = 12. However, the ligand-riboswitch dissociation constant Klig obtained from Eq. R7-R8 (see ‘Materials and Methods’ section) is different for these two systems: Klig = 2000 µM in PURE cell-free system and Klig = 515 µM in S30 extract. These numbers are significantly higher than the reported dissociation constant of the theophylline aptamer for its ligand with Kd ~400 nM [24]. Such difference can be attributed to the kinetic trapping mechanism of riboswitch activation, where the concentration of ligand at the time of initial folding determines the structure formed, not the amount of ligand present throughout the lifetime of the molecule [9]. The difference in ligand-riboswitch dissociation constants in PURE and S30 cell-free systems is clearly visible in Fig. 8 where the riboswitch dose response in these systems is presented on the linear scale.
Figure 8.
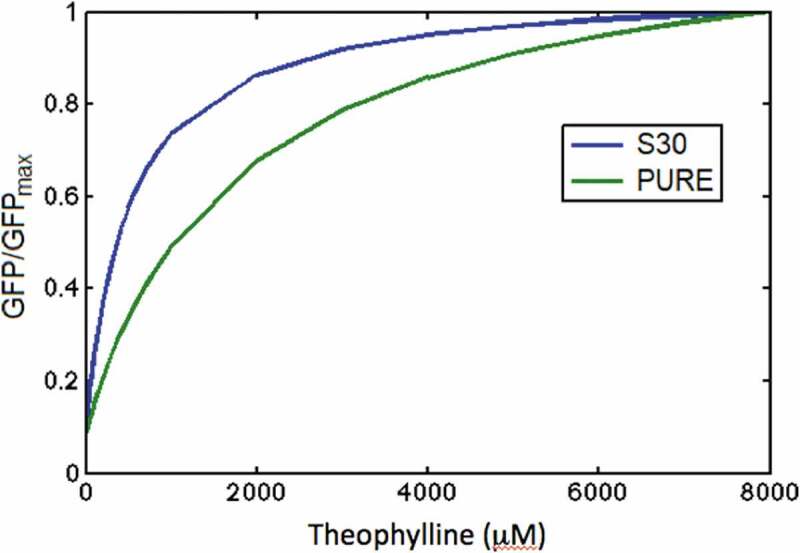
Comparison of dose response in PURE and S30 extract cell-free systems. Theophylline concentration is presented on the linear scale; sfGFP concentration is normalized to sfGFPmax
The riboswitch response to the increase of theophylline concentration in S30 extract is much higher compared with the PURE system. This difference may be attributed to the presence of a variety of different components in a crude S30 extract that enhance binding of ligand and folding of mRNA molecules into the ‘ON’ conformation compared with the PURE system. However, this hypothesis requires further experimental study and analysis.
To estimate the translation initiation rates for both control and riboswitch constructs, we used the Ribosome Binding Site Calculator [25] and the Riboswitch Calculator [26]. Both these tools employ a physics-based statistical thermodynamics method to calculate Gibbs free energy of ribosome binding, which is related to translation initiation rate. We estimated that the translation initiation rate for our control construct is around 900 a.u. (arbitrary units) while the translation initiation rate for the theophylline riboswitch in the ‘ON’ state is significantly lower at 190 a.u. Since the only difference between the control and riboswitch constructs is the presence of riboswitch in front of the Shine–Dalgarno (SD) sequence, the difference in the translation activation rates can be attributed to the changes in mRNA folding that affect the accessibility of SD for ribosome binding [27]. The ~4.7-fold difference in the translation initiation rates between the control construct and the riboswitch cannot alone explain almost the 10-fold difference in the protein levels. It means that additional factors influence the level of protein production from the riboswitch construct.
Based on the modelling results and analysis we can conclude that a combination of two factors contributes to the much lower level of protein expression in the theophylline riboswitch comparing with the control construct:
a reduced fraction of mRNA in the ‘ON’ state; and
a considerably lower translation initiation rate in the riboswitch compared with the control construct.
Conclusions
Cell-free transcription/translation systems can serve as a prototyping platform for the design and characterization of synthetic genetic circuits. We studied the performance of the theophylline riboswitch in PURE and S30 extract cell-free systems using experimental measurements and mathematical modelling.
It was found that the transcription dynamics for the riboswitch was very similar to the synthesis of the control mRNA, while the level of produced sfGFP under the riboswitch control was one order of magnitude lower in both S30 extract and PURE CFPS. The dose–response curves showed similar behaviour of the riboswitch in both CFPS with high micromolar to low millimolar dynamic range. However, in S30 extract, the riboswitch shows a much higher response to the increase in theophylline concentration compared with the PURE system. Experimental measurements of riboswitch activation showed that theophylline molecules needed to be present during the transcription of DNA in order to activate the riboswitch. This indicates that the activation of theophylline riboswitch is governed by the kinetic trapping mechanism, in agreement with previous observations [9]. A mathematical model of riboswitch activation was developed and applied to calculate the fraction of mRNA molecules in the ‘OFF’ and ‘ON’ states. It was found that even at the highest concentration of theophylline studied only a part of mRNAs is in the ‘ON’ state. It was also found that the riboswitch has a significantly lower translation initiation rate compared with the control construct. The combination of these two factors contributes to a much lower level of protein expression in the theophylline riboswitch.
Our results demonstrate that cell-free transcription/translation systems provide an effective prototyping platform for analysis and characterization of synthetic riboswitches. The experimental design and the developed modelling approach described can be applied to any synthetic riboswitch in order to understand and clarify the mechanism of riboswitch-mediated regulation of gene expression.
Methods
Materials
E. coli BL21 Star (DE3) cells were purchased from ThermoFisher (Invitrogen, Carlsbad, CA).
Phosphoenolpyruvate and E. coli total tRNA mixture (from strain MRE600) were purchased from Roche Applied Science (Indianapolis, IN). Ampicilline, theophylline, DMSO, ATP, GTP, CTP, UTP, 20 amino acids and other materials were purchased from Sigma-Aldrich (St. Louis, MO). Phusion DNA polymerase, restriction enzymes, NEBuilder HiFi DNA assembly master mix and PURExpress In Vitro Protein Synthesis Kit were purchased from New England Biolabs (Ipswich, MA). T7 RNA Polymerase was obtained by affinity tag purification [28] and quantified by measuring the absorbance at 280 nm. A plasmid pY71:sfGFP was a generous gift from Prof. Michael Jewett lab. A purified superfolder GFP was a generous gift from Dr Scott Walper from the Naval Research Laboratory, Washington, DC.
Preparation of cell extract
Cell extract and reagents were prepared based on previously described methods [29]. From overnight cultures, E. coli BL21 Star (DE3) cells were grown in 2 X YTPG media (16 g/L tryptone, 10 g/L yeast extract, 5 g/L sodium chloride, 7 g/L potassium phosphate dibasic, 3 g/L potassium phosphate monobasic, 1.8% glucose) at 37°C for approximately 3–4 h until OD600 reached approximately 3.0. Growth was conducted in 1 L of media in a 2.5 -L baffled tunair shake flask (IBI Scientific, Peosta, IA). Cells were then harvested by centrifugation at 5000 x g and 4°C for 15 min and subsequently washed in pre-chilled S30A buffer (10 mM Tris-acetate, pH 8.2, 14 mM magnesium acetate, 60 mM potassium acetate and 2 mM dithiothreitol) three times by resuspending the pellet via vortexing and centrifugation at 5000 x g and 4°C for 10 min. The cell mass was recorded, and the sample was flash-frozen in liquid nitrogen and stored at −80°C.
The cell pellet was thawed on ice and resuspended in 1 mL of pre-chilled S30A buffer per 1 g of cell mass. This suspension was then aliquoted into 1.5 mL Eppendorf tubes in 1 mL volumes, and cells were lysed by sonication in a Q125 sonicator (Qsonica Llc, Newtown, CT) with a 3.175-mm diameter probe at a frequency of 20 kHz and 50% amplitude by 10 s ON/OFF pulses for a total of 60 s (delivering ~350 J). After lysis, an additional 3 mM of dithiothreitol was added to each aliquot, followed by centrifugation at 12,000 x g for 10 min at 4°C. The supernatant was carefully removed, pooled to combine samples from all tubes, mixed by inverting, aliquoted in 100 µL volume, and flash-frozen in liquid nitrogen. Cell extract aliquots were stored at −80°C until use in cell-free reactions.
Plasmids
Since E. coli BL21 StarTM (DE3) cells were designed for high protein expression driven by T7 promoter and T7 RNA polymerase, to achieve the optimal riboswitch performance in generated cell extracts the theophylline synthetic riboswitch was placed under the control of T7 promoter. The commercial PURE system is also designed for the T7-polymerase-driven gene expression. To characterize the transcription- and translation-level of riboswitch regulated gene expression, the theophylline riboswitch was coupled with a sequence encoding sfGFP along with the malachite green RNA aptamer in the 3ʹ-untranslated region (UTR). The 35-base MGapt sequence contains a binding pocket for the malachite green dye [18] and allows mRNA dynamics to be easily monitored in CFPS with high temporal resolution [8]. The MGapt fluorescence signal (Ex: 610 nm, Em: 650 nm) does not overlap with sfGFP fluorescence (Ex: 470 nm, Em: 510 nm). Moreover, it was demonstrated that the inclusion of MGapt in the 3ʹ UTR of a reporter gene, green fluorescent protein (deGFP), had little effect on final deGFP levels, and expression kinetics reported with MGapt are consistent with real-time PCR measurements [8].
Plasmids were created using standard cloning methods. PCR primers and gBLOCK DNA fragments were obtained from Integrated DNA Technologies (Coralville, IA). Plasmid manipulations were performed using MAX Efficiency DH5α chemically competent E. coli cells (Invitrogen, Carlsbad, CA). Full descriptions of primer sequences and plasmids construction techniques are available in the Supplementary material. The sequences of all constructs have been verified by DNA sequencing at the Plant-Microbe Genomics facility at the Ohio State University. The plasmids were purified for cell-free reactions using a PureYield plasmid maxiprep kit (Promega, Madison, WI).
Cell-free reactions
The final CFPS based on S30 extract was composed of the following reagents: 12 mM magnesium glutamate, 130 mM potassium glutamate, 10 mM ammonium glutamate, 1.2 mM ATP, 0.85 mM each of GTP, CTP and UTP, 34 µg/mL folinic acid, 170.6 µg/mL E. coli tRNAs, 2 mM of each of the 20 amino acids, 33 mM phosphoenolpyruvate (PEP), 0.33 mM nicotinamide adenine dinucleotide (NAD), 0.27 mM coenzyme A, 1.5 mM spermidine, 1.0 mM putrescine, 4 mM oxalic acid, 57 mM HEPES, pH 7.4, 10 µM malachite green, 100 µg/mL T7 RNA polymerase, 0.8 U/mL Protector RNase Inhibitor (Sigma-Aldrich), 27% v/v of cell extract, plasmid DNA to the desired concentration and water.
PURE cell-free reactions were carried out following the PURE system manual: 25 µL reaction was composed of 10 µL solution A, 7.5 µL solution B, 0.8 U/mL Protector RNase Inhibitor (Sigma-Aldrich), 10 µM malachite green, plasmid DNA to the desired concentration and water.
To activate the riboswitch, cell-free reactions were treated with appropriate concentrations of theophylline in DMSO (refer to ‘Results and Discussions’ section for theophylline concentrations used to activate the riboswitch in this study). An equivalent volume of DMSO was added to the reactions for riboswitch in ‘OFF’ state.
All kinetic CFPS reactions were prepared on ice in quadruplicate at the 12-µL scale. 50 µl of a mixture containing the desired reaction components was prepared and the 12 µL was pipetted into four wells of 384-well clear bottom black-walled plate (Corning), taking care to avoid bubbles. Plate was sealed with an oxygen impermeable membrane to prevent evaporation. Reactions were incubated for 18 h at 30°C (S30 extract) or 37°C (PURE system) and monitored using a SpectraMax M5 Plate Reader (Molecular Devices), measuring fluorescence every 10 min at 470 nm excitation and 510 nm emission, and 610 nm excitation and 650 nm emission wavelengths for sfGFP and malachite green RNA aptamer, respectively.
For experiments when theophylline is added at different time points, 48 µl of a mixture containing the desired PURE cell-free reaction components was prepared and the 11.5 µL was pipetted into four wells of 384-well plate. To activate the riboswitch, the 0.5 µL of 50 mM theophylline in DMSO (final concentration of theophylline is 2 mM) was added to the reaction mixtures in wells at 0 min, 30 min, 60 min, 90 min. An equivalent amount of DMSO was added to the reaction for riboswitch in ‘OFF’ state. PURE cell-free reactions were performed and monitored as described above.
Preparation of pure mRNA
RNA was transcribed using a linear template PCR amplified from pUC19:PT7-sfGFP-MGapt (for control RNA) or pUC19:PT7-RS-sfGFP-MGapt (for riboswitch RNA) including T7 promoter and T7 terminator region; and the DNA amplicon from the bulk PCR reaction was purified via ethanol precipitation. The RNA transcription reaction was performed with AmliScribe T7-Flash Transcription Kit (Lucigen). The reaction was prepared according to a manufacturer’s protocol as a total volume of 80 µL with 4 µg linear DNA template, 8 µL 10X transcription reaction buffer, 9 mM each NTP, 10 mM DTT, 1 U/µL RiboGard RNase inhibitor, 0.5 U/µL T7 RNA polymerase and water. After an overnight incubation at 37°C, the reaction mixture was treated with 0.05 U/µL RNase-free DNase, incubated for 15 min at 37°C, and run on 1% agarose gel. RNA bands that correspond to the full-length transcript were excited and eluted from gel by Freeze-N-Squeeze column (Biorad). The eluted RNA was precipitated with ethanol, washed with 70% ethanol and air-dried. RNA pellet was resuspended in water or in MGapt binding buffer (refer to ‘Calibration’ for buffer content). Concentrations of purified RNA were determined spectrophotometrically using Nanodrop.
Calibrations
The measured fluorescence intensities of the aptamer-bound malachite green dye and the produced sfGFP were converted into concentration units relying on standard curves obtained from purified mRNA transcripts and sfGFP (see Supplementary material Figures S1 and S2).
To generate mRNA standard curve, multiple solutions with different RNA concentrations were used. The solutions were prepared by dissolving control and riboswitch mRNA transcripts containing MGapt sequence and malachite green in 10 mM Na-HEPES buffer, pH 7.4, containing 0.1 M potassium chloride and 5 mM magnesium chloride. The solutions were then heated to 80°C for 5 min and cooled down to room temperature in about 1 h to ensure the system to fold into the correct structure. After cooling, aliquots of prepared solutions were mixed with S30 extract reaction mixture (without the DNA template) or with PURE system reaction (without the DNA template). The final RNA concentrations were 0 µM, 0.4 µM, 0.6 µM, 0.8 µM and 1.0 µM; the final malachite green concentration was 10 µM. A reaction volume of 12 µL was placed into each well of 384-well clear bottom black-walled plate that was sealed with an oxygen impermeable membrane. Fluorescence measurements were performed at 30°C (S30 extract) or 37°C (PURE system) using a SpectraMax M5 Plate Reader (Molecular Devices) set to 610 nm excitation and 650 nm emission wavelengths.
Standard curves of sfGFP fluorescence were generated by measuring the fluorescence of serial dilutions prepared from the stock of purified sfGFP protein. Standard curves included six sfGFP dilutions, spanning 1.75 to 10.5 µM, at a 12 -µM volume in S30 extract reaction mixture or PURE system reaction. The prepared solutions were placed into each well of 384-well clear bottom black-walled plate that was sealed with an oxygen impermeable membrane. Fluorescence measurements were performed at 30°C (S30 extract) or 37°C (PURE system) using a SpectraMax M5 Plate Reader (Molecular Devices) set to 470 nm excitation and 510 nm emission wavelengths.
Cell-free reactions with mRNA transcripts
mRNA transcripts encoding sfGFP-MGapt (control construct) or RS-sfGFP-MGapt (riboswitch construct) were synthesized and purified as described in the ‘Preparation of Pure mRNA’ section. The purified transcripts were used as templates for in vitro translation reactions in E. coli S30 extract or PURE cell-free systems. RNA pellets were dissolved in water, heated to 80°C for 5 min, cooled down and added to S30 extract reaction mixture or PURE system reaction. The final mRNA concentrations were 1 µM and 2 µM. Translation reactions were performed either in the absence or presence of 2 mM theophylline. All reactions were performed in quadruplicate. Reaction volumes of 12 µL were placed into each well of 384-well clear bottom black-walled plate that was sealed with an oxygen impermeable membrane. Reactions were incubated for 18 h at 30°C (S30 extract) or 37°C (PURE system) and monitored using a SpectraMax M5 Plate Reader (Molecular Devices), measuring fluorescence every 10 min at 470 nm excitation and 510 nm emission, and 610 nm excitation and 650 nm emission wavelengths for sfGFP and malachite green RNA aptamer, respectively.
qRT-PCR
For qRT-PCR, 1-μL samples were taken from PURE and S30 reaction mixtures at indicated time points and diluted 50-fold in water. Samples were further diluted to 1:5000 and then stored at −20°C until used. Samples were analysed in duplicates at a final dilution of 1:25,000 in the qRT-PCR reaction mixture at a reaction volume of 20 µL, using Power SYBR Green RNA-to-CT 1-Step Kit (Life Technologies) in the StepOnePlus Real Time System (Applied Biosystems). RS-sfGFP-MGapt sequence was amplified using forward (5ʹ- GGCTAACAAGTCTAGCGAACC-3ʹ) and reverse (5ʹ- GCCAACTCAGCTTCCTTTCG-3ʹ) primers at a 100 nM concentration. Concentrations of RS-sfGFP-MGapt RNA template in S30/PURE cell-free reactions were determined using a standard curve of purified mRNA ranging from 0.035 pM to 350 pM.
Kinetic modelling
The developed kinetic model of riboswitch activation and gene expression represents the three most important processes: transcription, translation and riboswitch activation. Transcription is the polymerization of nucleoside triphosphates (ATP, GTP, CTP, UTP) by RNA polymerase to produce mRNA. All the transcriptional resources in a model are lumped into the Transcriptional resources variable (TsR). The transcription of DNA and synthesis of mRNA is described by a single equation R1:
| (R1) |
Based on our previous work on the modelling of gene expression [30], the transcription rate is presented by the Michaelis–Menten form where kts is the turnover number, and KTs and KDNA are the corresponding Michaelis–Menten constants:
| (R1.1) |
In a similar way, all translational resources are grouped into the Translational resources variable, TlR, and translation of mRNA and synthesis of GFP is represented by a single equation:
| (R2) |
with the translation rate in the Michaelis–Menten form:
| (R2.1) |
The maturation of GFP and the production of fluorescent protein GFPm are described by a reaction with the irreversible mass action kinetic law:
| (R3) |
| (R3.1) |
In our mathematical modelling, we used a maturation rate of kmat = 0.2 min−1 that was determined previously [11].
Unlike the cell-based systems where the resources are constantly regenerated, in the cell-free systems, they are used or degrade with time. Therefore, we introduced the depletion of resources TsR and TlR. In our approach, utilization of transcriptional resources TsR depends on the template DNA concentration, while the decay of translational resources TlR depends on the concentration of synthesized protein:
| (R4) |
| (R4.1) |
| (R5) |
| (R5.1) |
In such an approach, the consumption of translational resources depends on whether the riboswitch is in the ‘OFF’ or ‘ON’ states. Finally, we included the process of mRNA degradation that is described by a reaction with the irreversible mass action kinetic law:
| (R6) |
| (R6.1) |
The mRNA degradation rate is different in different cell-free systems. In the PURE system, it was determined to be of kdRNA = 7.8x10⁻⁴ min−1 [11], while in the S30 extract, it is two orders of magnitude higher kdRNA = 6.25x10⁻² min−1 [31].
The developed model of gene expression in CFPS was expanded to describe the riboswitch activation according to kinetic trapping mechanism [9]. The transcription of DNA without the theophylline results in the synthesis of mRNA molecules in the ‘OFF’ state mRNA_off:
| (R7) |
| (R7.1) |
while in the presence of theophylline both mRNA_off and mRNA_on are synthesized:
| (R8) |
| (R8.1) |
The fraction of mRNAs in ‘OFF’ and ‘ON’ states depends on the concentration of the ligand (Lig) and is regulated by the ligand-riboswitch dissociation constant Klig. The mRNAs in both ‘OFF’ (mRNA_off) and ‘ON’ states (mRNA_on) are translated into proteins according to the equation (R2) but with a different set of kinetic parameters. Equations (R7)-(R8) together with the equations (R2)-(R6) were used to model the riboswitch activation in cell-free systems.
Parameter estimations
The mathematical model of gene expression in control construct has 6 species, 6 reactions and 12 kinetic parameters. Initial values for all species except DNA, TsR and TlR were set to zero. The DNA concentration was set to the same values as in the experimental measurements while TsR and TlR values were set to one as proposed in [11]. Some kinetic parameters, such as GFP maturation rate kmat and RNA degradation rate kdRNA, were taken from the literature while other parameters were estimated by fitting the kinetic model to the entire set of experimental measurements using generic algorithm within the COPASI software v. 4.23 (http://copasi.org).
Initially, we determined five kinetic parameters that describe the transcriptional process in control construct in both CFPS by fitting Eqs. (R1.1) and (R4.1) to the time course of mRNA values at different DNA concentrations. Difference between the experimental and predicted values for mRNA level was used as the loss function. As a next step, we fitted five kinetic parameters in Eqs. (R2.1) and (R5.1) that describe the translational process to the kinetics of sfGFP at different DNA concentrations. Now, the difference between the experimental and predicted values for sfGFP level was used as the loss function. The obtained kinetic parameters for transcription and translation processes for the control construct in the PURE system were similar to the same parameters in the work by Stögbauer et al. [11], thus indicating the reliability of estimations.
The similar level of mRNA for the riboswitch and the control construct in both PURE and S30 extract as shown on Fig. 3 indicated that the transcription process is similar in both constructs. Therefore, kinetic parameters for transcription that were estimated for the control construct were also used to model the riboswitch activation. On the other, the level of protein synthesis in riboswitch is order of magnitude lower than in control construct. Hence, the kinetic parameters for the translation of mRNA in both ‘OFF’ and ‘ON’ states were estimated separately by fitting five kinetic parameters in Eqs. (R2.1) and (R5.1) and Klig in Eq. (R8.1) to the experimental level of sfGFP at different concentrations of theophylline.
Supplementary Material
Acknowledgments
Authors would like to thank Dr Michael Jewett’s laboratory from the Northwestern University for sharing detailed protocols and for engaging in many fruitful discussions. The views expressed in this article are those of the authors and do not necessarily reflect the official policy or position of the Air Force, the Department of Defense, or the US. Government. The material was assigned a clearance of CLEARED on 5 May 2020 with case number: 88ABW-2020-1631.
Funding Statement
This work was supported by the Air Force Office of Scientific Research [16RH3003J]; Office of the Secretary of Defense [FA8650-19-F-6110].
Disclosure of Potential Conflicts of Interest
No potential conflicts of interest were disclosed.
Supplementary material
Supplemental data for this article can be accessed here.
References
- [1].Winkler WC, Breaker RR.. Regulation of bacterial gene expression by riboswitches. Annu Rev Microbiol. 2005;59:487–517. [DOI] [PubMed] [Google Scholar]
- [2].Lynch SA, Desai SK, Sajja HK, et al. A high-throughput screen for synthetic riboswitches reveals mechanistic insights into their function. Chem Biol. 2007;14:173–184. [DOI] [PMC free article] [PubMed] [Google Scholar]
- [3].Suess B, Hanson S, Berens C, et al. Conditional gene expression by controlling translation with tetracycline-binding aptamers. Nucleic Acids Res. 2003;31:1853–1858. [DOI] [PMC free article] [PubMed] [Google Scholar]
- [4].Davidson ME, Harbaugh SV, Chushak YG, et al. Development of a 2, 4-dinitrotoluene-responsive synthetic riboswitch in E. coli cells. ACS Chem Biol. 2013;8:234–241. [DOI] [PubMed] [Google Scholar]
- [5].Findeiß S, Etzel M, Will S, et al. Design of artificial riboswitches as biosensors. Sensors. 2017;17:1990. [DOI] [PMC free article] [PubMed] [Google Scholar]
- [6].Harbaugh SV, Goodson MS, Dillon K, et al. Riboswitch-based reversible dual color sensor. ACS Synth Biol. 2017;6:766–781. [DOI] [PubMed] [Google Scholar]
- [7].Muranaka N, Sharma V, Nomura Y, et al. Efficient design strategy for whole-cell and cell-free biosensors based on engineered riboswitches. Anal Lett. 2009;42:108–122. [Google Scholar]
- [8].Siegal-Gaskins D, Tuza ZA, Kim J, et al. Gene circuit performance characterization and resource usage in a cell-free “breadboard”. ACS Synth Biol. 2014;3:416–425. [DOI] [PubMed] [Google Scholar]
- [9].Mishler DM, Gallivan JP. A family of synthetic riboswitches adopts a kinetic trapping mechanism. Nucleic Acids Res. 2014;42:6753–6761. [DOI] [PMC free article] [PubMed] [Google Scholar]
- [10].Cole SD, Beabout K, Turner KB, et al. Quantification of interlaboratory cell-free protein synthesis variability. ACS Synth Biol. 2019;8:2080–2091. [DOI] [PubMed] [Google Scholar]
- [11].Stögbauer T, Windhager L, Zimmer R, et al. Experiment and mathematical modeling of gene expression dynamics in a cell-free system. Integr Biol. 2012;4:494–501. [DOI] [PubMed] [Google Scholar]
- [12].Niederholtmeyer H, Xu L, Maerkl SJ. Real-time mRNA measurement during an in vitro transcription and translation reaction using binary probes. ACS Synth Biol. 2013;2:411–417. [DOI] [PubMed] [Google Scholar]
- [13].Doerr A, de Reus E, van Nies P 1, et al. Modelling cell-free RNA and protein synthesis with minimal systems. Phys Biol. 2019;16:025001. [DOI] [PubMed] [Google Scholar]
- [14].van Nies P, Nourian Z, Kok M, et al. Unbiased tracking of the progression of mRNA and protein synthesis in bulk and in liposome‐confined reactions. ChemBioChem. 2013;14:1963–1966. [DOI] [PubMed] [Google Scholar]
- [15].Pédelacq JD, Cabantous S, Tran T, et al. Engineering and characterization of a superfolder green fluorescent protein. Nat Biotech. 2006;24:79. [DOI] [PubMed] [Google Scholar]
- [16].Davidson MW, Campbell RE. Engineered fluorescent proteins: innovations and applications. Nat Methods. 2009;6:713–717. [DOI] [PubMed] [Google Scholar]
- [17].Matsuura T, Tanimura N, Hosoda K, et al. Reaction dynamics analysis of a reconstituted Escherichia coli protein translation system by computational modeling. Proc Natl Acad Sci. 2017;114:E1336–E134. [DOI] [PMC free article] [PubMed] [Google Scholar]
- [18].Grate D, Wilson C. Inducible regulation of the S. cerevisiae cell cycle mediated by an RNA aptamer–ligand complex. Bioorg Med Chem. 2001;9:2565–2570. [DOI] [PubMed] [Google Scholar]
- [19].Lynch SA, Gallivan JP. A flow cytometry-based screen for synthetic riboswitches. Nucleic Acids Res. 2009;37:184–192. [DOI] [PMC free article] [PubMed] [Google Scholar]
- [20].Marshall R, Noireaux V. Quantitative modeling of transcription and translation of an all-E. coli cell-free system. Sci Rep. 2019;9:11980. [DOI] [PMC free article] [PubMed] [Google Scholar]
- [21].Gyorgy A, Del Vecchio D. 2014, Limitations and trade-offs in gene expression due to competition for shared cellular resources. In 2014 53rd IEEE Annual Conference on Decision and Control, CDC 2014 - Los Angeles, USA. 5431–5436. [Google Scholar]
- [22].Kim DM, Swartz JR. Prolonging cell‐free protein synthesis with a novel ATP regeneration system. Biotechnol Bioeng. 1999;66:180–188. [PubMed] [Google Scholar]
- [23].Hansen MM, Ventosa Rosquelles M, Yelleswarapu M, et al. Protein synthesis in coupled and uncoupled cell-free prokaryotic gene expression systems. ACS Synth Biol. 2016;5:1433–1440. [DOI] [PubMed] [Google Scholar]
- [24].Zimmermann GR, Jenison RD, Wick CL, et al. Interlocking structural motifs mediate molecular discrimination by a theophylline-binding RNA. Nat Struct Mol Biol. 1997;4:644–649. [DOI] [PubMed] [Google Scholar]
- [25].Salis HM. The ribosome binding site calculator. In: Voigt C, editor. Methods in enzymology. Vol. 498. Academic Press: San Diego, CA; 2011. p. 19–42. [DOI] [PubMed] [Google Scholar]
- [26].Espah Borujeni A, Mishler DM, Wang J, et al. Automated physics-based design of synthetic riboswitches from diverse RNA aptamers. Nucleic Acids Res. 2015;44:1–13. [DOI] [PMC free article] [PubMed] [Google Scholar]
- [27].Espah Borujeni A, Channarasappa AS, Salis HM. Translation rate is controlled by coupled trade-offs between site accessibility, selective RNA unfolding and sliding at upstream standby sites. Nucleic Acids Res. 2014;42:2646–2659. [DOI] [PMC free article] [PubMed] [Google Scholar]
- [28].Swartz JR, Jewett MC, Woodrow KA. Cell-free protein synthesis with prokaryotic combined transcription-translation. Methods Mol Biol. 2004;267:169–182. [DOI] [PubMed] [Google Scholar]
- [29].Kwon YC, Jewett MC. High-throughput preparation methods of crude extract for robust cell-free protein synthesis. Sci Rep. 2015;5:8663. [DOI] [PMC free article] [PubMed] [Google Scholar]
- [30].Frazier JM, Chushak Y, Foy B. Stochastic simulation and analysis of biomolecular reaction networks. BMC Syst Biol. 2009;3:1–21. [DOI] [PMC free article] [PubMed] [Google Scholar]
- [31].Garamella J, Marshall R, Rustad M, et al. The all E. coli TX-TL Toolbox 2.0: a platform for cell-free synthetic biology. ACS Synth Biol. 2016;5:344–355. [DOI] [PubMed] [Google Scholar]
Associated Data
This section collects any data citations, data availability statements, or supplementary materials included in this article.


