. 2021 Nov 11;10:e69621. doi: 10.7554/eLife.69621

Figure 1. ABCB7 is required for pro-B cell development but not peripheral B cell homeostasis.

(A) Flow cytometry analysis of B cell development in bone marrow from wild-type (WT), Mb1-cre ABCB7 conditional knockout (cKO), and CD23-cre ABCB7 cKO mice. Pro-B cells were divided into Hardy fractions as follows: Fr. B (B220+ CD19+ CD43+ BP-1-), Fr. C (B220+ CD19+ CD43+ CD24lo BP-1+), and Fr. C’ (B220+ CD19+ CD43+ CD24hi BP-1+), Fr. D (B220+ CD19+ CD43-/low sIgM-), Fr. E (B220+ CD19+ CD43-/low sIgM+), and Fr. F (B220hi CD19+ CD43-/low sIgM+). Contour plots are representative of six independent experiments (total of 6–11 mice/group). (B) Flow cytometry analysis of splenic B cell populations in WT, Mb1-cre ABCB7 cKO, and CD23-cre ABCB7 cKO mice. Populations were identified by gating on CD19+ splenocytes: transitional type 1 (T1; AA4.1+CD21/35- IgM+ CD23-), transitional type 2 (T2; AA4.1+ CD21/35- IgM+ CD23+), transitional type 3 (T3; AA4.1+CD21/35+IgM+), follicular (FO; AA4.1- CD21/35+ IgM+), and marginal zone (MZ; AA4.1- CD21/35hi IgMhi). Contour plots are representative of seven independent experiments (total of 7–12 mice/group). (C) Graph showing the percentage of total live bone marrow cells for each Hardy fraction in (A). (D) Graph showing absolute cell numbers of splenic B cell populations in (B). (C, D) Lines represent the mean ± SEM. Statistics were obtained by using a one-way ANOVA with Dunnett’s test for multiple comparisons.

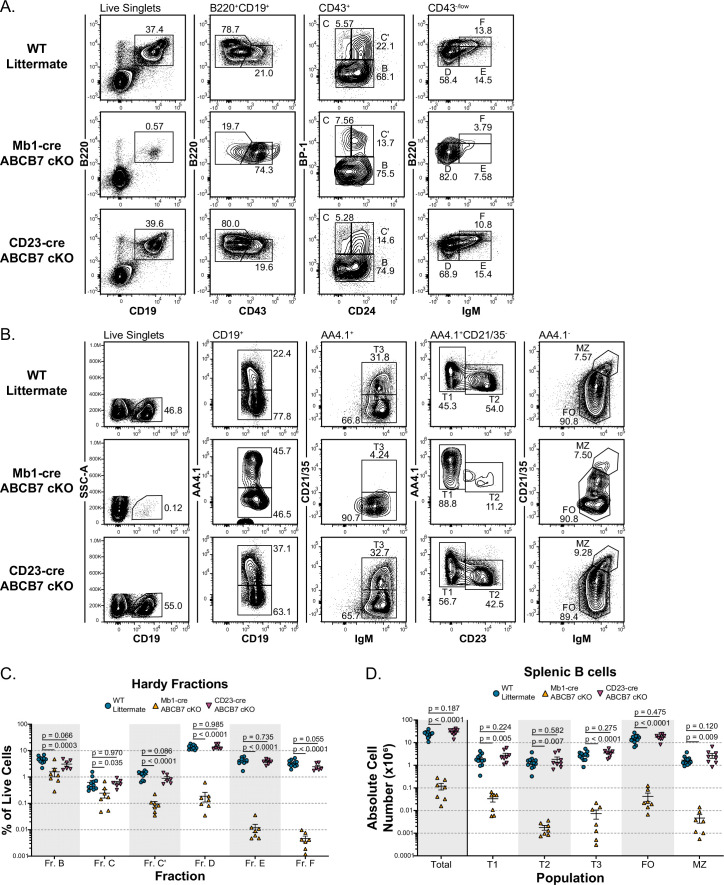
Figure 1.

Figure 1—figure supplement 1. Analysis of pro-B cell block in Mb1-cre ABCB7 conditional knockout (cKO) mice.

Figure 1—figure supplement 1.

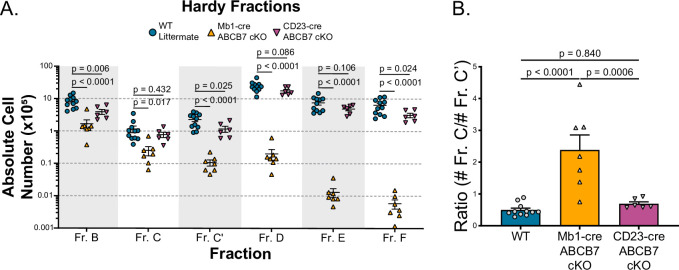
(A) Graph showing the absolute cell numbers of bone marrow Hardy fractions from wild-type (WT), Mb1-cre ABCB7 cKO, and CD23-cre ABCB7 cKO mice from Figure 1A. (B) Graph showing the ratio of absolute numbers of Fr. C cells (B220+ CD19+ CD43+ CD24lo BP-1+) over absolute numbers of Fr. C’ cells (B220+ CD19+ CD43+ CD24hi BP-1+) in WT, Mb1-cre ABCB7 cKO, and CD23-cre ABCB7 cKO mice from (A). (A, B) Error bars represent SEM, and p-values are indicated above the data. Results were collected from six independent experiments (total of 6–11 mice/group). Statistics were obtained by using a one-way ANOVA. Dunnett’s multiple comparisons test was used for (A) while Tukey’s test was used for (B).
Figure 1—figure supplement 2. ABCB7 deletion efficiency in CD23-cre ABCB7 conditional knockout (cKO) peripheral B cells.

Figure 1—figure supplement 2.

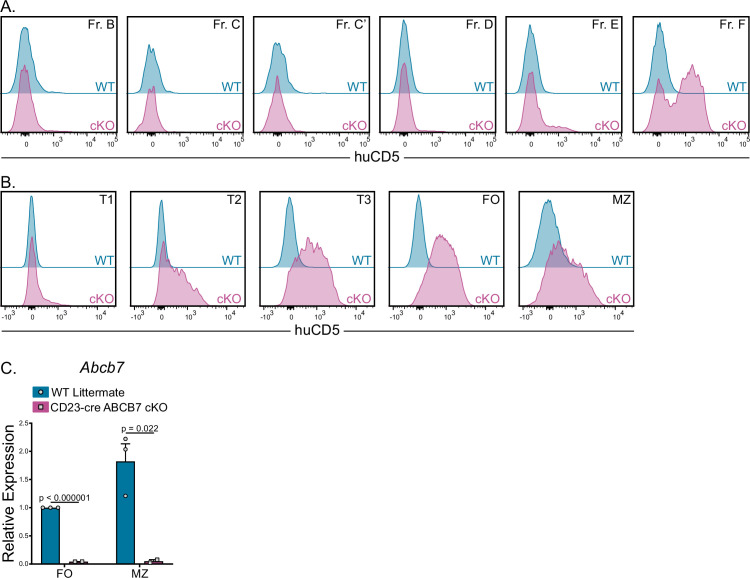
Flow cytometry analysis of huCD5 reporter expression in BM (A) and splenic (B) B cell populations from wild-type (WT) and CD23-cre ABCB7 cKO mice.
Offset histograms are representative of three independent experiments. (C) Quantitative real-time PCR analysis of Abcb7 expression in sorted follicular (FO) and marginal zone (MZ) B cells from WT and CD23-cre ABCB7 cKO mice. 18S rRNA was used as an endogenous control, and relative expression values were normalized to expression in WT FO B cells. Results were obtained from three independent experiments (total of 2–3 mice/group). Error bars represent SEM, and p-values are indicated above the data. Statistics were obtained by using an unpaired Student’s t-test.