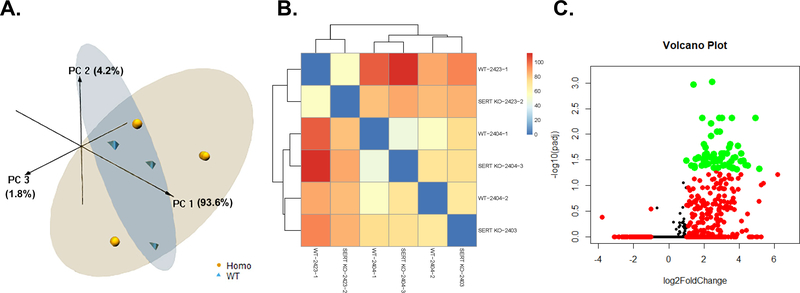
Fig. 2.
Placental gene expression in SERT KO vs. WT conceptuses. A) 3D PCA plot of RNAseq results from placenta of SERT KO males vs. WT males. B) Heatmap based on all transcripts identified in placenta of SERT KO males vs. WT males. d. C) Volcano plot analyses of gene transcripts identified in placenta of SERT KO males vs. WT males. Transcripts represented by Orange: FDR < 0.05; Transcripts represented by Red: log2FoldChange < −1 or > 1; Transcripts represented by Green: FDR < 0.05 AND log2FoldChange < −1 or > 1. N = 3 SERT KO and 3 WT placenta.

