

Beginning in 2018, AcademyHealth established the Reinhardt lecture as a feature of its annual research meeting. The lecture honors a national leader in the field who reflects the high standards Professor Uwe Reinhardt established in moving evidence into action and translating evidence to serve the public interest. HSR has partnered with AcademyHealth to select the annual awardee and to publish the lecture in the journal.
1. REINHARDT LECTURE 2021: HEALTH CARE PRICES AS SIGNALS
One of Uwe Reinhardt's many contributions to health services research was to encourage us to consider the role of prices in explaining the challenges of the US health care system. In this lecture, I describe the evidence for the importance of prices, consider the role prices play in the system, and assess whether current health system prices are providing the right signals to actors in our system.
Among the most striking developments in health services research over the past decade has been the shift from studying quantities to studying prices. As late as 2006, there were fewer than 30 papers a year published in Health Services Research that included the search term “prices.” Last year, there were over 140. The earlier focus on quantities—utilization—had a solid basis in economic theory, which emphasizes how the ubiquity of health insurance generates moral hazard, but it was primarily driven by data availability. Enormous data files on individual‐level utilization within the Medicare program fueled a cottage industry of health services research.
The powerful mantra of “follow the data” likewise provides much of the explanation for the recent interest in prices. The availability of data from commercial insurers, which includes information on price variation, has provided a fruitful field for new research. Soon‐to‐be‐available data from recently enacted price transparency regulations will surely expand the field further. But as is often the case in health economics, Uwe Reinhardt was there first.
Uwe's interest in the role of prices in the health care system long pre‐dated the availability of microdata on US health system prices. Instead, Uwe (with his co‐authors Gerard F. Anderson, Peter S. Hussey, and Varduhi Petrosyan) inferred the importance of prices through their analysis of long‐available Organisation for Economic Co‐operation and Development (OECD) data on health spending and utilization across high‐income countries. 1 Year after year, those data showed that US per capita health spending greatly exceeded levels in other comparable countries. The absolute and relative differences grew substantially over time and were not reflected in improvements in outcomes—indeed, US outcomes relative to each one of the comparison countries deteriorated over the same period. 2
2. IS THE US DIFFERENT?
Uwe—always the mythbuster—recognized that this pattern of US exceptionalism was weird. The peculiarity of US comparative performance shows up in two ways. First, the countries we often compare ourselves to, other high‐income market economies, are very different from one another. They differ in their demographics (Australia and Sweden's populations are relatively young, and Japan's is relatively old), in their social welfare programs, in their political systems, in their cuisines, and in their exercise patterns. They also differ in the structure of their health systems (though they all, in contrast to the United States, have universal health insurance). 3 Most pay physicians using a fee‐for‐service model similar to what is common in the United States, but the United Kingdom and Sweden pay using salaries; most standardize insurer payments for inpatient stays using a categorization mechanism similar to US diagnosis‐related groups (DRGs), but Canada and Sweden use global budgets (reimbursement by time period rather than by patient category). 4 Some of these countries make considerable use of private insurance; others adhere more to a single‐payer‐like model. Yet despite all these many internal differences, the cost and outcome performance of these other, comparable countries has been quite similar over time and has become increasingly different from that of the United States.
This convergence among highly disparate countries casts serious doubt on many of the explanations proffered by apologists of the US system. If factors such as rapidly rising obesity rates, low social welfare spending, substantial reliance on private health insurance and fee‐for‐service payment, or high rates of traffic accidents or of homicide explain the divergence between the United States and other OECD outcomes, then variations in these factors should also explain variation among the other OECD countries. They do not.
Consider the comparison between the United States and Australia, which comes in second or third to the United States on all of these indicators of health system pathologies. 5 In 1976, US per capita health spending was about 40% higher than the average among 10 comparison high‐income countries (all normalized to 2016 prices) and just $13 higher than the next highest country, Switzerland (see Figure 1). Male life expectancy at 40 stood at 99% of the average and was over half a year longer than in the country with the lowest life expectancy, Germany. By 2016, US per capita spending was double the average in the comparison countries, and nearly $3000 greater than in Switzerland (the next costliest country), while male life expectancy at 40 was a full year shorter than in Germany, the country with the next lowest life expectancy.
FIGURE 1.
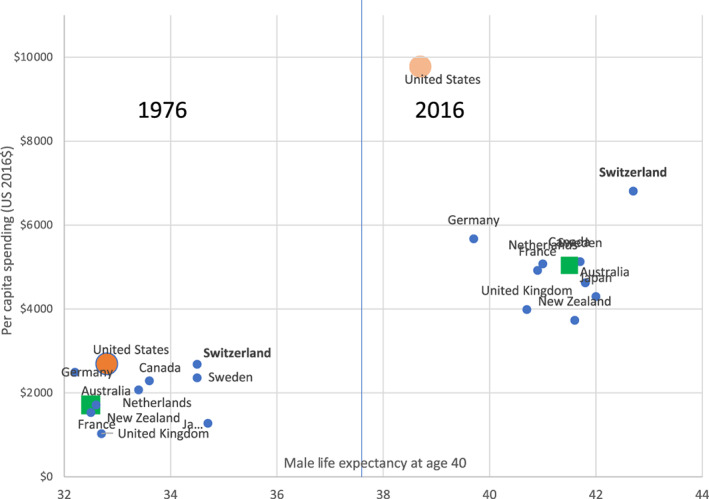
Per capita spending and male life expectancy at age 40. All spending is in 2016 USD. Data are for a set of high‐income countries with complete data over the 1976–2016 period in the Organisation for Economic Co‐operation and Development health database: Australia, Canada, France, Germany, Japan, the Netherlands, New Zealand, Sweden, Switzerland, and the United Kingdom. Life expectancy is in expected years of life after age 40 [Color figure can be viewed at wileyonlinelibrary.com]
By contrast, in 1976, Australian per capita health spending was about 90% of the 10‐country average and about $1000 below Switzerland. In 2016, Australian spending was about 93% of the average and about $2200 below Switzerland. Over the same period, Australia experienced the greatest improvements in life expectancy of any of the comparison countries. If factors such as obesity rates and traffic accidents explain poor US health system performance, they ought to predict poor relative performance for Australia too—and Australia has been a health care system star, with large gains for low costs (Figure 1).
The second reason that the comparative data are surprising is that, in general, the United States is not an exceptionally high‐cost country: We are not Switzerland. In global cost‐of‐living indices, the US ranks below many of the countries in the comparison list. The US minimum wage is low by international standards; while the data are extremely sketchy, it appears that the pay of skilled workers outside the health care sector, such as civil engineers 6 or lawyers, 7 is not exceptionally high; hotel costs are lower in the United States than in most comparator countries. 8 Just as the United States stands out among comparator countries in its high health care costs, the US health care sector stands out within the US economy for its high relative costs—and hence its high share of the GDP, 60% higher than the comparison country average. By contrast, the health care share of GDP in Switzerland, where everything is expensive, is just slightly (7%) above the comparison country average, and just two‐thirds as high as in the United States.
Why then is the cost of US health care so high? Uwe's identification of prices as the culprit came from a simple analysis. The average number of patient‐initiated encounters with the health system is no higher (often lower) in the United States than elsewhere (Figure 2). If costs are high, and encounters are low, the explanation must be that the price per system encounter is higher in the United States than in other countries. Subsequent research examining actual prices for specific types of encounters has confirmed this finding.
FIGURE 2.

Patient‐initiated utilization. Source: Organisation for Economic Co‐operation and Development, 2021 [Color figure can be viewed at wileyonlinelibrary.com]
3. WHAT DO PRICES DO?
Much of the research on international price comparison treats prices as primarily a form of compensation or reimbursement for health care goods and services. In this view, the process through which a health care encounter is produced is set and the cost of production of that encounter depends primarily on the cost of inputs. This is the view held by Centers for Medicare and Medicaid Services actuaries, among many others. At a given cost of inputs, a higher‐priced system is one in which there are greater transfers from health care consumers to health care producers. These transfers might take the form of high margins or profits. For inputs that are in limited supply (such as physicians), high prices would translate into higher compensation. From a distributive perspective, these transfers may be troubling, but from an economic perspective, they do not mean that the system is inefficient.
Empirical evidence does not support the prices‐as‐compensation story. While some actors in the US health care system (in particular, doctors) do earn economic profits, 9 their incomes constitute only a small fraction of total spending—and doctors in at least some of the other comparison countries also appear to earn exceptionally high incomes. 10 Most of those employed in the health sector earn no more than they would elsewhere in the economy. 11 At the organizational level, profits and margins in the sector as a whole have not increased as a share of spending over time, even as costs have escalated. 12
An alternative perspective treats prices not as compensation but as signals (Figure 3). High prices signal to producers that consumers value a service and producers respond to this greater demand. In this alternative perspective, high prices change the way that health care is produced—the choices of inputs and outputs used. If prices are “too high,” then increased inputs can reduce economic efficiency. The prices‐as‐signals view turns the compensation calculation on its head. Rather than high US health prices being a consequence of high underlying input costs under a fixed production function, high US health prices could lead producers to increase the inputs used in production, even if underlying input costs do not change.
FIGURE 3.

Prices as compensation or incentive. When prices serve primarily as compensation for health care (left), higher prices mean more spending is transferred from health care consumers to health care producers—the gray square, the transfer from consumers to suppliers, represents the difference in price multiplied by an unchanging quantity of services. Note that for inputs with constrained supply, such as physician hours, the effort to increase inputs could also generate long‐term increases in compensation. When prices act as a signal (right), high prices signal to health care producers that consumers value a service and producers respond to this signal by supplying more services. In addition to transferring the gray square from consumers to suppliers, the signal model also generates additional spending in the hatched triangle [Color figure can be viewed at wileyonlinelibrary.com]
The alternative perspective of high US health care prices as market signals maps onto one of the critiques of the argument that prices drive high US health care spending. 13 , 14 Critics point out that the quantities associated with prices in international comparisons might not be the same. An encounter in the United States might be delivered with greater intensity—more tests, more provider time, more sophisticated equipment—than a similarly labeled encounter abroad. The higher US price might then be absorbed by the cost of this greater intensity of inputs into the production of encounters, leaving, counter to the compensation view, no excess profit or surplus for providers. In this view, consistent with the prices‐as‐signals view, high US prices match higher underlying costs not because underlying input prices are abnormally high, but because more inputs are being used.
If prices act as signals, they generate incentives (for both suppliers and consumers). High US health prices could generate several different types of incentives. High prices could encourage health care providers to invest in new technologies or amenities to attract more patients willing to pay those prices. The higher the price, the more those extra patients benefit a provider or institution. This incentive is particularly strong where the fixed costs of new technologies or amenities are high and the marginal costs are relatively low.
An extensive research literature supports the view that higher prices encourage providers to invest in technology and amenities. Hospitals invest in costly technologies to attract privately insured patients, whose insurers generally pay higher rates than Medicare. 15 , 16 , 17 As relative Medicare prices change, increasing or decreasing the profitability of specific services, hospitals respond by investing in or divesting from such services. 18 In areas where Medicare prices for MRIs increased, physicians increased their investments in MRI technologies, relative to areas without such increases. 19
Higher prices could encourage providers to invest in technical support and clerical employees to streamline processes and increase the volume of encounters a professional or institution could perform. The higher the price, the greater the benefit to increasing volumes under a pay‐per‐encounter system. If the price per service is high, the added cost of employing additional support staff is a good investment.
A substantial share of recent increases in US health care spending has financed such additions to support and technical staff across the system. The number of clinical support (such as patient transport assistants) and technical staff employed in the health care sector increased by over 50% between 1997 and 2012, greatly outpacing growth in the number of doctors, nurses, or billing‐related administrators. In general, health care employment growth has been greatest in states with the highest levels of health care spending, 20 much of it due to higher prices. 21 This relationship between spending (prices) and employment also holds internationally (Figure 4). Since 2001, the share of the workforce employed in the health care sector has increased from about 6% to about 7% in the comparison countries; over the same period, the share of the US workforce employed in health care grew from just over 7% to nearly 10%.
FIGURE 4.

Share of the workforce employed in the health care sector. Source: Dataset: 7A. Labour input by activity, ISIC rev4. https://stats.oecd.org/Index.aspx?DataSetCode=SNA_TABLE7A
Finally, higher prices could generate increased administrative costs. The benefits of exploiting the complexities of payment systems such as improving coding, reviewing utilization, and appealing a utilization review all grow as the prices paid for the encounter increase. A provider serving patients who pay low prices benefits much less from the latest iteration of coding software than does one whose patients pay very high prices. If the base price is lower, each increment of coding intensity generated by the software generates fewer additional dollars in compensation to the practice, so more patients are required to pay off the initial investment in coding software.
Evidence supports this mechanism too. Increases in Medicare reimbursement lead hospitals to be more aggressive in shifting patients to higher‐paying DRGs. 22 When Medicare increased reimbursement for some services, hospitals aggressively upcoded into these services. 23 They even hired new managers to exploit these new opportunities. 24 Insurers seeking to limit spending are likely to respond to these increases in upcoding by increasing the documentation they demand and the frequency with which they audit providers. 25
4. ARE THE PRICES RIGHT?
All told, the evidence for the hypothesis that prices act as signals is robust. But that raises a further question. Are the prices right? The poor comparative outcomes of the US health system suggest that those high prices are not buying particularly high system‐wide clinical quality. And recent research shows that weak US health system outcomes are not primarily a distributional problem, with low outcomes among the poor masking exceptional performance for rich Americans. Even very high‐income Americans do not have better outcomes than their high‐income counterparts in other countries. 26 , 27 The Commonwealth Fund's regular comparisons of service quality across countries show that the United States is not a standout, even with respect to the timeliness of service receipt. We stand near (not at) the top of the rankings in terms of elective surgery and diagnostic test availability, but our scores on the availability of primary care and weekend and evening access to care rank near the bottom. 28
This is the point where I can imagine Uwe, with a sly smile on his face, asking whether despite this poor performance, those prices are right, and they are providing incentives for exactly what Americans want from their health care system? It seems implausible that even American health care consumers are willing to pay more for more sophisticated coding software, more billing clerks, or more aggressive utilization review. But Uwe might go on to ask whether Americans' manifest admiration of gilt and faux luxury—think of the palaces of Las Vegas or Atlantic City—extends to a willingness to pay premiums for splendid hospital lobbies and similarly luxurious services. After all, he might wonder: Do other countries actually publish photo spreads of their most beautiful health care institutions? 29
That's where the recent spate of research on health care prices fits in. Now that data have become available, we have learned that there is tremendous variation in the prices paid by private insurers to doctors and hospitals in the US health system. Prices paid for the same procedure in the same hospital vary by payer by a factor of 50%. Prices paid for the same procedure by the same payer similarly vary among hospitals. 30 Which of these prices reflects the preferences of the average American health care consumer? Which signal would it be most efficient for health care providers to follow?
Private market prices in the US health care system derive from bargaining and negotiation within a market. That market, however, is characterized by substantial regulatory barriers to entry, opaque quality, extensive insurance coverage, and small, highly localized markets that often do not have the population base to support adequate competition. There is no reason to believe that current prices provide incentives that reflect either underlying costs or consumer preferences.
Uwe's admonition to look to the prices as the root problem in American health care provides a framework in which to situate the flow of recent work on the characteristics of those prices. Health care system prices matter, not only because they raise the cost of coverage or because they enrich health care producers at the expense of consumers but also because participants in the system respond to them and make investment and allocation decisions accordingly. As health services researchers study the newly available price data, they should focus not only on documenting price variation and its correlates, but on assessing whether those prices are generating the right signals. 31
Glied S. Reinhardt lecture 2021: Health care prices as signals. Health Serv Res. 2021;56(6):1087‐1092. doi: 10.1111/1475-6773.13878
Funding information Commonwealth Fund, Grant/Award Number: 20202859
REFERENCES
- 1. Anderson GF, Reinhardt UE, Hussey PS, Petrosyan V. It's the prices, stupid: why the United States is so different from other countries. Health Aff (Millwood). 2003;22(3):89‐105. [DOI] [PubMed] [Google Scholar]
- 2. Muennig PA, Glied SA. What changes in survival rates tell us about US health care. Health Aff. 2010;29(11):2105‐2113. [DOI] [PubMed] [Google Scholar]
- 3. Glied S, Black M, Lauerman W, Snowden S. Considering “single payer” proposals in the US: Lessons from abroad. Issue Brief (Commonw Fund) 2019; 2019:1–10. [PubMed]
- 4. OECD . Health Systems Characteristics Survey. 2016; https://www.oecd.org/els/health-systems/characteristics.htm. Accessed August 8, 2021.
- 5. OECD . Health Statistics Database. 2021; https://www.oecd.org/els/health-systems/health-data.htm. Accessed August 8, 2021.
- 6. Forum OC. Highest Paying Countries for Civil Engineer. 2021; https://www.onlinecivilforum.com/site/highest-paying-countries-for-civil-engineer/. Accessed July 8, 2021.
- 7. Nailbuzz . 10 Countries With The Highest Lawyer Salaries In The World. 2020; https://naibuzz.com/10-countries-with-the-highest-lawyer-salaries-in-the-world/. Accessed September 8, 2021.
- 8. Hotels.com . Review of Global Hotel Prices. 2013; https://mb.cision.com/Public/70/9545330/a1b932cdf99da254.pdf. Accessed September 8, 2021.
- 9. Laugesen MJ, Glied SA. Higher fees paid to US physicians drive higher spending for physician services compared to other countries. Health Aff (Millwood). 2011;30(9):1647‐1656. [DOI] [PubMed] [Google Scholar]
- 10. Ketel N, Leuven E, Oosterbeek H, van der Klaauw B. The returns to medical school: evidence from admission lotteries. Am Econ J Appl Econ. 2016;8(2):225‐254. [Google Scholar]
- 11. Glied SA, Ma S, Pearlstein I. Understanding pay differentials among health professionals, nonprofessionals, and their counterparts in other sectors. Health Aff. 2015;34(6):929‐935. [DOI] [PubMed] [Google Scholar]
- 12. Glied S, Ma S, Solis‐Roman C. Where the money goes: the evolving expenses of the US health care system. Health Aff. 2016;35(7):1197‐1203. [DOI] [PubMed] [Google Scholar]
- 13. Emanuel EJ. The real cost of the US health care system. JAMA. 2018;319(10):983‐985. [DOI] [PubMed] [Google Scholar]
- 14. Baicker K, Chandra A. Do we spend too much on health care? NEJM. 2020;383(7):605‐608. [DOI] [PubMed] [Google Scholar]
- 15. Wright JD, Tergas AI, Hou JY, et al. Effect of regional hospital competition and hospital financial status on the use of robotic‐assisted surgery. JAMA Surg. 2016;151(7):612‐620. [DOI] [PubMed] [Google Scholar]
- 16. Barbash GI, Friedman B, Glied SA, Steiner CA. Factors associated with adoption of robotic surgical technology in US hospitals and relationship to radical prostatectomy procedure volume. Ann Surg. 2014;259(1):1‐6. [DOI] [PubMed] [Google Scholar]
- 17. Garthwaite C, Ody C, Starc A. Endogenous quality investments in the US hospital market. Nat Bur Econ Res. 2020. 10.3386/w27440 [DOI] [PubMed] [Google Scholar]
- 18. Horwitz JR. Making profits and providing care: comparing nonprofit, for‐profit, and government hospitals. Health Aff. 2005;24(3):790‐801. [DOI] [PubMed] [Google Scholar]
- 19. Clemens J, Gottlieb JD. Do physicians' financial incentives affect medical treatment and patient health? Am Econ Rev. 2014;104(4):1320‐1349. [DOI] [PMC free article] [PubMed] [Google Scholar]
- 20. Skinner J, Chandra A. Health care employment growth and the future of US cost containment. JAMA. 2018;319(18):1861‐1862. [DOI] [PubMed] [Google Scholar]
- 21. Cooper Z, Craig SV, Gaynor M, Van Reenen J. The price ain't right? Hospital prices and health spending on the privately insured. Q J Econ. 2019;134(1):51‐107. [DOI] [PMC free article] [PubMed] [Google Scholar]
- 22. Shin E. Hospital responses to price shocks under the prospective payment system. Health Econ. 2019;28(2):245‐260. [DOI] [PubMed] [Google Scholar]
- 23. Dafny LS. How do hospitals respond to price changes? Am Econ Rev. 2005;95(5):1525‐1547. [DOI] [PubMed] [Google Scholar]
- 24. Dafny L, Dranove D. Regulatory exploitation and management changes: Upcoding in the hospital industry. J Law Econ. 2009;52(2):223‐250. [Google Scholar]
- 25. Kuhn M, Siciliani L. Upcoding and Optimal Auditing in Health Care (or the Economics of DRG Creep), CEPR Discussion Papers 6689. 2008.
- 26. Milligan K, Schirle T. The evolution of longevity: evidence from Canada. Can J Econ/Rev Canadienne d'économique. 2021;54(1):164‐192. [Google Scholar]
- 27. Cutler DM. Life and death in Norway and the United States. JAMA. 2019;321(19):1877‐1879. [DOI] [PubMed] [Google Scholar]
- 28. Schneider E, Sarnak D, Squires D, Shah A, Doty M. Mirror, mirror 2017: international comparison reflects flaws and opportunities for better US health care. New York: Commonwealth Fund; 2017. 2021.
- 29. Saleh N. Hotel or hospital? The 10 most beautiful US health‐care institutions. 2018. https://www.mdlinx.com/article/hotel-or-hospital-the-10-most-beautiful-us-health-care-institutions/lfc-3222 [Google Scholar]
- 30. Fronsdal TL, Bhattacharya J, Tamang S. Variation in health care prices across public and private payers. NBER Working Paper 27490. Cambridge, MA: National Bureau of Economic Research; July, 2020. 10.3386/w27490 [DOI] [Google Scholar]
- 31. Frakt AB, Chernew ME. The importance of relative prices in health care spending. JAMA. 2018;319(5):441‐442. [DOI] [PubMed] [Google Scholar]