

Abstract
Objective
To quantify discrepancies between opioid prescribing and dispensing via the percentage of patients with Electronic Medical Record (EMR) prescriptions who subsequently filled the prescription within 90 days, defined as congruence, and compared opioid congruence with related medications.
Data sources
Deidentified data from the IBM MarketScan Explorys Claims‐EMR Dataset.
Study design
In this retrospective, observational study, we examined congruence for commonly prescribed controlled substances—opioids, stimulants, and benzodiazepines. Congruence was stratified by age group and sex.
Data collection/extraction methods
Continuously enrolled adults aged 18‐64 years with an EMR encounter (excluding inpatient settings) and ≥ 1 prescription for selected classes between 1/1/2016 and 10/2/2017.
Principal findings
During the study period, 1,353,478 adults had ≥1 EMR encounter. Patients with stimulants prescriptions had the highest congruence (83%) corresponding to 7151 claims for 8,635 EMR prescriptions, followed by opioids (66%; 62,766/95,690) and benzodiazepines (64%; 30,181/47,408). Chi‐square testing showed congruence differed by age group within opioids (P < .0001) and benzodiazepines (P < .0001) and was higher among females within benzodiazepines (P < .0001).
Conclusions
These findings demonstrate that relying on claims data alone for opioid prescribing measures might underestimate actual prescribing magnitude by as much as one‐third in these data. Combined EMR and claims data can help future research better understand characteristics associated with congruence or incongruence between prescribing and dispensing.
Keywords: benzodiazepines, claims, electronic medical records, prescription opioids, stimulants
What is known on this topic?
Opioid prescribing is frequently measured using claims data.
Accurate opioid prescribing data are critical to better inform effective overdose prevention and intervention activities.
Linked electronic medical records and insurance claims data have been previously used to assess prescription fill rates, medication exposure, or adherence, while limited to the general classes of analgesics and anti‐inflammatories.
What this study adds?
We quantify discrepancies between prescribing and dispensing through for the overall medication classes of opioids, benzodiazepines, and stimulants using 90‐day prescription‐claim congruence.
Claims data alone may underestimate actual opioid prescribing by as much as one third.
Given continued concerns around high‐risk opioid prescribing, claims‐EMR data linkages can result in opportunities to better measure prescribing and dispensing behavior.
1. INTRODUCTION
Fatal and nonfatal opioid overdoses continue to remain a public health epidemic in the U.S. In 2018, over two‐thirds of the 67,367 drug overdose deaths involved an opioid. 1 Despite overall declines in opioid prescribing since 2012, 2 , 3 prescribing remains substantially high relative to 1999. 2 High‐risk opioid prescribing and use is associated with an increased risk of fatal and nonfatal overdoses. 4 , 5 Prescription opioids were involved in over 30% of opioid overdose deaths in 2018. 6
Accurate opioid prescribing data are critical to better inform effective overdose prevention and intervention activities. Data on opioid prescribing often come from pharmacy dispensing records (including Prescription Drug Monitoring Program data) and health insurance administrative claims data. 7 While these sources capture dispensed prescriptions and are critical for measuring medication use, they might not completely reflect actual opioid prescribing. Studies have found that pharmacy dispensing does not always match actual prescribing, 8 , 9 , 10 with differences primarily depending on medication class. 10 Discrepancies might arise due to a variety of reasons—for example, patients may not pick up their prescriptions due to a lack of perceived need, lack of insurance coverage, or cost barriers. 11 , 12 Electronic medical records (EMR) data can provide additional insight into opioid prescribing by capturing actual prescribing and indications for prescribing from patient‐provider encounters. Linked patient‐level EMR and claims data are therefore uniquely suited for studying such discrepancies by respectively offering insight into patient‐provider encounters as well as subsequent activities including prescription fills/refills and billing/payment. 8 , 9
Previous work using linked EMR and claims data has measured discrepancies in prescribing and dispensing with the goal of assessing prescription fill rates, 9 medication exposure, 8 or adherence, 10 limited to the general classes of analgesics and anti‐inflammatories. 8 , 10 While medication use has been measured among specific opioids such as hydrocodone and oxycodone, 8 discrepancies between prescribing and dispensing remain unknown for the overall class of opioids.
The goal of this study is to better understand the magnitude of discrepancy between claims data and prescribing information for opioids from patient‐provider encounters. We do this by quantifying the percentage of patients with opioid prescriptions from noninpatient settings who had a subsequent opioid claim within 90 days, defined as 90‐day prescription‐claim congruence, in the medication class of opioids using linked pharmacy claims and EMR data from 1/1/2016 through 10/2/2017. For comparison, we also determine congruence among two other prescription medication classes which are also commonly prescribed controlled substances with abuse potential, benzodiazepines, and stimulants. Benzodiazepines are a high‐risk factor for overdose, especially when co‐prescribed with opioids. 13 , 14 Stimulants, like opioids, have potential for misuse 15 and also present an increased risk of overdose 16 and other poor health outcomes, especially when simultaneously used with opioids. 17 We also assess congruence by age and sex and the top three most frequent types of prescription by class.
2. METHODS
2.1. Data
In this retrospective observational study, we obtained deidentified, linked claims and EMR data from the IBM MarketScan Explorys Claims‐EMR Data Set (CED), accessed through the MarketScan Treatment Pathways platform. This dataset is composed of a subset of administrative commercial and Medicare supplemental claims data from the IBM MarketScan Research Databases matched with electronic medical record (EMR) data from the IBM Explorys Universe Dataset through patient‐level deterministic linking. The MarketScan Research Databases contain comprehensive collections of deidentified, patient‐level pharmaceutical, laboratory, medical, and dental data in the United States, with more than 300 contributing employers, over 25 contributing health plans, and more than 200 million covered lives since 1996. The Explorys Universe Dataset comprises a 20‐year data repository of EMRs collected from all points of care with clinical data including prescribing and lab results, for roughly 72 million patients, integrated from more than 39 large health systems comprising about 400 hospitals and about 400,000 providers across the U.S. The data were previously collected and statistically deidentified and are compliant with the conditions set forth in the Health Insurance Portability and Accountability Act; therefore, approval from an institutional review board was not sought.
2.2. Population
To capture patients with simultaneously overlapping EMR and insurance claims data coverage during the study period, we first selected patients who had at least one EMR encounter to ensure medical record data coverage and then retained those who had continuous enrollment with both medical and pharmacy benefits following first prescriptions to ensure claims data coverage (Figure 1).
FIGURE 1.
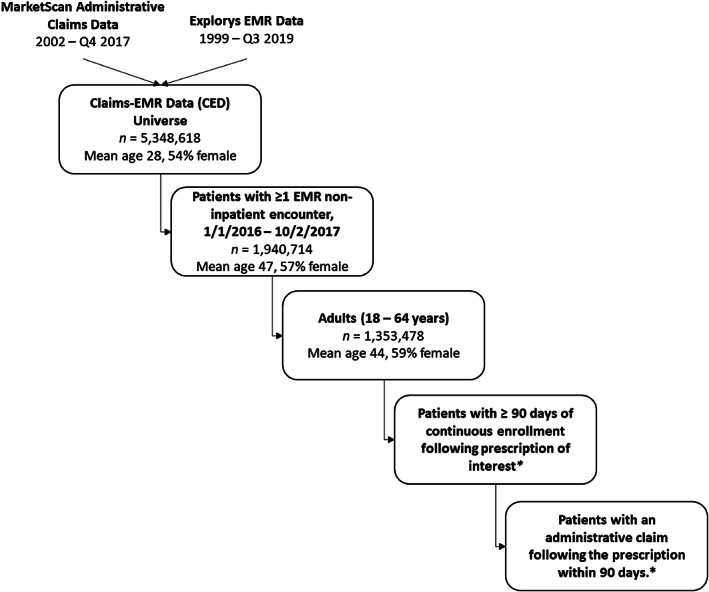
Study population selection. *Population sizes (n) and demographics for continuously enrolled patients following prescriptions and claims are dependent on the drug class, available in Tables 1 and 2, respectively
Among the 5.3 million unique patients in Treatment Pathways, 1,940,714 patients (36.3%) had at least one EMR encounter outside the inpatient setting between 1/1/2016 and 10/2/2017. Encounters from inpatient settings were excluded from our study since Treatment Pathways does not contain data on inpatient pharmaceutical claims (Appendix S1). Of these, 1,353,478 patients aged 18‐64 years were selected for further study. Among those adults with at least one EMR encounter during the study period, first prescriptions recorded in the EMR during the study period (referred to as first prescription) for selected drug classes were then identified using the RxNorm drug terminology 18 codes produced by the National Library of Medicine (Appendix S2). 19 Among these prescriptions, we further excluded prescriptions with statuses indicating they were entered in error, canceled, or scheduled for the future. As a result, only prescriptions transmitted to the pharmacy or printed for the patient were retained for analysis.
Then, among individuals with a prescription and at least 90 days of subsequent continuous enrollment in the same health plan following the prescription, adjudicated prescription claims within 90 days of the prescription were identified using National Drug Codes (NDCs) corresponding to the selected medication classes (Appendix S3). We restricted our study end date to 10/2/2017 to ensure all patients were able to have at least 90 days of continuous enrollment after a prescription during 2017.
2.3. Measures
Discrepancies between prescribing and dispensing were identified through 90‐day prescription‐claim congruence (henceforth referred to as congruence). Congruence was defined among patients receiving a prescription for a given medication class/drug type as the percentage of them with a corresponding adjudicated claim for the same drug within 90 days of the prescription. We define the term congruence specifically in the context of pharmacy claims‐EMR data in order to distinguish it from: (a) prescription fill‐rates (since the data do not capture filled prescriptions that might have been paid for out‐of‐pocket or paid by a different health plan which did not contribute to the MarketScan Claims Databases); (b) compliance/adherence (since medications may not be taken as directed 20 ); and (c) concordance (since this is a measure to indicate whether patients and physicians are both in agreement about a planned medication regimen 21 , 22 ).
2.4. Analysis
We obtained congruence for drugs under the following classes: opioids, benzodiazepines, and stimulants and stratified results by age group and sex. Within each class, we also examined congruence for commonly prescribed drugs, namely—hydrocodone, oxycodone, and tramadol for opioids; alprazolam, lorazepam, and clonazepam for benzodiazepines; and amphetamines, lisdexamfetamine dimesylate, and methylphenidate for stimulants. Injectable products of these drug classes were excluded because they are not typically dispensed by outpatient pharmacies. For opioids, cough and cold products, buprenorphine products indicated for the treatment of opioid use disorder were also excluded. The number of prescriptions and adjudicated claims are reported at the patient level. Mean claim time (days) was also reported for each drug and class. Chi‐square tests were performed to determine differences in congruence by age and sex using SAS statistical software (version 9.4; SAS Institute).
3. RESULTS
Of 1,353,478 adult patients aged 18‐64 years with at least one EMR encounter in the sample, 59% were female (n = 802,185), with 27% aged 18‐34 years, 33% aged 35‐49 years, and 40% aged 50‐64 years. The mean age was 44 years (SD = 13.0). Table 1 shows the numbers of patients with prescriptions, adjudicated claims, and the resulting congruence. Opioids were the most frequently prescribed medication class (n = 95,690 patients, 7.1% of patients), followed by benzodiazepines (n = 47,408, 3.5%), and stimulants (n = 8,635, 0.6%). Patients with opioid prescriptions had an overall congruence of 66% and the shortest duration between prescription and claim (mean = 5.5 days). Within opioids, tramadol had the highest congruence (69%), followed by hydrocodone (64%) and oxycodone (62%). By medication class, benzodiazepines had similar overall congruence compared to opioids (64%), while the highest congruence was seen in stimulants (83%). Within benzodiazepines (mean claim time = 8.6 days), which had the widest within‐class range of congruence across the top three most frequently prescribed drugs, lorazepam had the lowest congruence (55%), while clonazepam had the highest (77%). Within stimulants, which had the longest mean claim time (9.1 days) of all classes considered, the congruence ranged from 76% for methylphenidate to 84% for lisdexamfetamine.
TABLE 1.
Ninety‐day prescription‐claim congruence by medication class for patientsa with prescriptions, 1/1/2016‐10/2/2017
| Cohort | Patients, N (%) | Patients with adjudicated 90‐day claims, N | Congruence, (%) | Mean claim time, (Days) |
|---|---|---|---|---|
| Adults (18–64 years) | 1,353,478 (100%) | — | — | — |
| Patients with prescriptions, CE | ||||
| All opioids | 95,690 (7.1%) | 62,766 | 65.6% | 5.48 |
| Hydrocodone | 42,460 (3.1%) | 26,989 | 63.6% | 4.13 |
| Oxycodone | 32,889 (2.4%) | 20,510 | 62.4% | 4.30 |
| Tramadol | 22,038 (1.6%) | 15,169 | 68.8% | 4.14 |
| Benzodiazepines | 47,408 (3.5%) | 30,181 | 63.7% | 8.64 |
| Alprazolam | 15,644 (1.2%) | 11,064 | 70.7% | 7.57 |
| Lorazepam | 14,099 (1.0%) | 7,713 | 54.7% | 10.37 |
| Clonazepam | 6,397 (0.5%) | 4,912 | 76.8% | 9.35 |
| Stimulants | 8,635 (0.6%) | 7,151 | 82.8% | 9.06 |
| Amphetamine | 6,072 (0.4%) | 4,838 | 79.7% | 9.05 |
| Lisdexamfetamine | 1,306 (0.1%) | 1,100 | 84.2% | 6.78 |
| Methylphenidate | 1,630 (0.1%) | 1,244 | 76.3% | 9.53 |
Abbreviations: CED, claims‐EMR data; CE, continuous enrollment.
Excludes patients in the following settings: Comprehensive inpatient rehabilitation facility, hospital inpatient, inpatient psychiatric facility, inpatient psychiatric facility partial hospitalization, inpatient rehabilitation facility, end‐stage renal disease treatment facility, birthing center, skilled nursing facility, nursing facility, psychiatric residential treatment center, hospice, residential substance abuse treatment facility, nursing home visit, and assisted living facility.
For each medication class, Table 2 shows the number of patients with prescriptions and congruence by age and sex. Congruence was higher among females (66%) compared to males (59%) within benzodiazepines (χ 2 (1) = 215.3, P < 0.0001). However, congruence was similar across sex for opioids (females—65%, males—66%; (χ 2 (1) = 1.2, P = 0.2803)) and stimulants (83%, 82%; (χ 2 (1) = 1.0, P = 0.3184)). Age was associated with differences in congruence within opioids (χ 2 (2) = 271.9, P < 0.0001) and benzodiazepines (χ 2 (2) = 24.3, P < 0.0001). Congruence was higher among those aged 35‐49 years compared to other age groups (opioids—68%; benzodiazepines—65%). Congruence was virtually identical across age groups within stimulants (18‐34 years ‐ 82%, 35‐49 years ‐ 83% and 50‐64 years ‐ 83%; (χ 2 (1) = 1.6, P = 0.44)).
TABLE 2.
Number of patients with prescriptions, claims, and 90‐day prescription‐claim congruence, by age and sex, 1/1/2016–10/2/2017
| Drug Class | Measure | Sex | Age group, years | |||
|---|---|---|---|---|---|---|
| Female | Male | 18–34 | 35–49 | 50‐64 | ||
| Overall |
Population, N (%) a |
802,185 (59.3%) | 551,293 (40.7%) | 369,931 (27.3%) | 440,195 (32.5%) | 543,352 (40.1%) |
| Opioids |
CE patients with Rxs, N (%) b |
58,333 (7.3%) | 37,357 (6.8%) | 20,389 (5.5%) | 29,224 (6.6%) | 46,077 (8.5%) |
| Patients with claims, N | 38,185 | 24,581 | 12,472 | 19,956 | 30,338 | |
| Congruence, % | 65.5% | 65.8% | 61.2% | 68.3% | 65.8% | |
| P‐valuec | 0.2803 | <.0001 | ||||
| Benzodiazepines |
CE patients with Rxs, N (%)b |
31,220 (3.9%) | 16,188 (2.9%) | 8,453 (2.3%) | 15,647 (3.6%) | 23,308 (4.3%) |
| Patients with claims, N | 20,604 | 9,577 | 5,202 | 10,130 | 14,849 | |
| Congruence, % | 66.0% | 59.2% | 61.5% | 64.7% | 63.7% | |
| p‐valuec | <.0001 | <.0001 | ||||
| Stimulants |
CE patients with Rxs, N (%)b |
5,220 (0.7%) | 3,415 (0.6%) | 4,229 (1.1%) | 2,768 (0.6%) | 1,638 (0.3%) |
| Patients with claims, N | 4,340 | 2,811 | 3,480 | 2,308 | 1,363 | |
| Congruence, % | 83.1% | 82.3% | 82.3% | 83.4% | 83.2% | |
| p‐valuec | 0.3184 | 0.4433 | ||||
Abbreviations: CE, continuous enrollment; Rxs, prescriptions.
Percentage of patients by age or sex strata among 1,353,478 adults 18‐64 years with at least one EMR noninpatient encounter.
Percentage of patients with prescriptions and subsequent continuous enrollment of at least 90 days among overall population in age or sex strata.
Chi‐square test.
4. DISCUSSION
The goal of this study was to explore and quantify discrepancies between prescribing and dispensing for the medication classes of opioids, benzodiazepines, and stimulants by quantifying the 90‐day congruence using linked claims‐EMR data. To achieve this, we used two different drug identification coding systems (RxNorm and NDC) to capture prescriptions and claims in EMR and claims respectively for the three classes of medications. To the best of our knowledge, this is the first such compilation of RxNorm codes for stimulants.
Our findings show that congruence for opioid medications was 65%, and over a third of the patients with prescriptions for opioids did not have a subsequently associated claim, suggesting that more opioids are prescribed than can be ascertained through claims data. These results are similar to those of Rowan et al. 8 whose examination of patient medication exposure found that 71% and 66% of patients with EHR prescriptions for hydrocodone and oxycodone, respectively, had an associated pharmaceutical claim in the subsequent month.
Like opioids, just under two in three patients receiving a benzodiazepine prescription were found to have an associated claim (64%). However, unlike opioids, there was a wide range of variation in congruence observed among the most prescribed benzodiazepine products (55‐77%). We believe this is the first study to use combined claims‐EMR data to quantify congruence or a related measure (such as medication exposure or fill‐rates) in both the overall benzodiazepine class and the specific drugs of alprazolam, lorazepam, and clonazepam. Of the three medication classes, stimulants had the highest congruence—83% of all prescriptions were associated with a claim in the subsequent 90 days. In their study, Rowan et al. 8 similarly found that a high fraction of patients (74‐79%) receiving prescriptions of the stimulant medications of methylphenidate and lisdexamfetamine for attention‐deficit hyperactivity disorder had associated claims in a 1 month period.
Differences in congruence among the three medication classes studied could possibly be attributed to a combination of factors such as differences in patients' perceptions of risk, recurrence of prescriptions (ie, newly prescribed vs refills), out‐of‐pocket costs, or availability of other therapeutic substitutes. For instance, one possible explanation for the high congruence among stimulants is low cost sharing. Previous research has shown that over a third of patients who were dispensed a stimulant had no co‐pay. 23 Opioid analgesics were the only medication class where the three most prescribed drugs had a congruence lower than 70%. Possible explanations for this lower congruence might be higher perceived risks of opioid use in recent years and the increased availability of other therapeutic substitutes such as nonopioid analgesic prescriptions and/or over the counter pain relievers.
Our findings suggest that relying on claims data alone for measures of prescribing could result in underestimating the magnitude of prescribing among controlled substance prescriptions with abuse potential. The margin by which this is underestimated varies by medication class. In recent years, there has been a great deal of focus on how clinical and policy initiatives, affect high‐risk opioid prescribing. Studies using claims data alone should be aware of the lower congruence of opioid prescriptions and claims, meaning impacts on prescribing behavior may not be accurately captured. Other limitations of claims data include representativeness and timeliness. 24 Therefore, when possible, the use of combined EMR and claims data can provide a more complete picture of prescribing. In the absence of combined data, electronic medical records can provide a more accurate measure of prescribing by clinicians, while claims data can serve as an approximation for medication use. Future studies should consider using multiple years of combined EMR and claims data to study trends in congruence for opioid analgesics.
This study is subject to certain limitations. First, despite the wide coverage of the Explorys Universe and MarketScan Research Databases, individuals included in the CED represent a convenience sample and are not nationally representative (i.e., the data do not include the weights available in the MarketScan Database). The CED inclusion criteria require individuals to be present in both Explorys and MarketScan databases. Therefore, we cannot rule out the possibility that congruence might be different for people not represented in this dataset (i.e., those who do not have either EMR, claims data, or both). Additionally, the lack of clear denominators for the population included in the CED limit conclusions we can draw about absolute prescription and claim counts in our analysis. Second, while unlikely, certain patients in the CED may have additional prescription coverage via health plans not contributing to the MarketScan databases which can result in certain claims not being captured in the data. Third, claims from patients not meeting the 90‐day continuous enrollment criteria are also not captured in this analysis. It is also possible that some patients might have chosen to pay out of pocket, resulting in no claim. The second and third limitations could potentially result in underestimating congruence. Fourth, in patients with multiple prescriptions for the same medication between the first prescription and the subsequent first claim, we could not identify which prescription a claim was associated with, for reasons including processing order of claims and claims not in the MarketScan databases. Congruence measured at the prescription‐level may possibly differ from that of the patient level.
Despite these limitations, this study has important strengths. This is the first study to examine prescription‐claim congruence for the overall medication classes of opioids, benzodiazepines, and stimulants allowing us to quantify discrepancies between prescribing and dispensing. The combination of claims and electronic medical record data provides a unique perspective by leveraging data from two separate rich data sources. Linked EMR and claims data can help us better understand prescribing and subsequent medication exposure.
Opioid prescribing is frequently measured using claims data. While claims data provide a reasonable measure of exposure to medication, this research shows that such data may underestimate actual opioid prescribing, by as much as one third. Given continued concerns around high‐risk opioid prescribing 25 and overdoses involving prescription opioids ,26 it is important to understand the limitations of utilizing claims data or EMR alone to study opioid prescribing/use. This work highlights how data linkages and utilization of EMR data may result in opportunities to better measure prescribing and dispensing behavior.
CONFLICTS OF INTEREST
The authors have no relevant conflicts of interest to disclose.
Supporting information
Appendix S1: Supporting information.
Appendix S2: RxNorms.
Appendix S3: NDCs.
ACKNOWLEDGMENTS
We are grateful to Jeffery Ratto, Cheryl Isenhour, Ocelander Mason, Violanda Grigorescu, at the CDC Data Hub for the opportunity to access the data during a pilot period. We also appreciate Kay Miller, Benjamin Kolt, and Randall Dick from IBM for providing assistance in using the data.
Nataraj N, Zhang K, Strahan AE, Guy GP Jr. Congruence of opioid prescriptions and dispensing using electronic records and claims data. Health Serv Res. 2021;56(6):1245–1251. 10.1111/1475-6773.13673
The findings and conclusions in this report are those of the authors and do not necessarily represent the official position of the Centers for Disease Control and Prevention.
REFERENCES
- 1. Hedegaard H, Miniño AM, Warner M. Drug overdose deaths in the United States, 1999‐2018. NCHS Data Brief. 2020;1–8. https://www.cdc.gov/nchs/data/databriefs/db356-h.pdf. [PubMed] [Google Scholar]
- 2. Guy Jr GP, Zhang K, Bohm MK, et al. Vital signs: changes in opioid prescribing in the United States, 2006‐2015. MMWR Morb Mortal Wkly Rep. 2017;66(26):697‐704. [DOI] [PMC free article] [PubMed] [Google Scholar]
- 3. Guy Jr GP, Zhang K, Schieber LZ, Young R, Dowell D. County‐level opioid prescribing in the United States, 2015 and 2017. JAMA Intern Med. 2019;179(4):574‐576. [DOI] [PMC free article] [PubMed] [Google Scholar]
- 4. Rose AJ, Bernson D, Chui KKH, et al. Potentially inappropriate opioid prescribing, overdose, and mortality in Massachusetts, 2011–2015. J Gen Intern Med. 2018;33(9):1512‐1519. [DOI] [PMC free article] [PubMed] [Google Scholar]
- 5. Baumblatt JAG, Wiedeman C, Dunn JR, Schaffner W, Paulozzi LJ, Jones TF. High‐risk use by patients prescribed opioids for pain and its role in overdose deaths. JAMA Intern Med. 2014;174(5):796‐801. [DOI] [PubMed] [Google Scholar]
- 6. Wilson N, Kariisa M, Seth P, Smith H IV, Davis NL. Drug and opioid‐involved overdose deaths—United States, 2017–2018. MMWR Morb Mortal Wkly Rep. 2020;69:290‐297. [DOI] [PMC free article] [PubMed] [Google Scholar]
- 7. Smart R, Kase CA, Meyer A, Stein BD. Data Sources and Data‐Linking Strategies to Support Research to Address the Opioid Crisis. Washington, DC: Assistant Secretary for Planning and Evaluation; 2018. [Google Scholar]
- 8. Rowan CG, Flory J, Gerhard T, et al. Agreement and validity of electronic health record prescribing data relative to pharmacy claims data: a validation study from a US electronic health record database. Pharmacoepidemiol Drug Saf. 2017;26(8):963‐972. [DOI] [PubMed] [Google Scholar]
- 9. Park Y, Yang H, Das AK, Yuen‐Reed G. Prescription fill rates for acute and chronic medications in claims‐EMR linked data. Medicine. 2018;97(44):e13110. [DOI] [PMC free article] [PubMed] [Google Scholar]
- 10. Fischer MA, Stedman MR, Lii J, et al. Primary medication non‐adherence: analysis of 195,930 electronic prescriptions. J Gen Intern Med. 2010;25(4):284‐290. [DOI] [PMC free article] [PubMed] [Google Scholar]
- 11. Kennedy J, Tuleu I, Mackay K. Unfilled prescriptions of medicare beneficiaries: prevalence, reasons, and types of medicines prescribed. J Manag Care Pharm. 2008;14(6):553‐560. [DOI] [PMC free article] [PubMed] [Google Scholar]
- 12. Gadkari AS, McHorney CA. Medication nonfulfillment rates and reasons: narrative systematic review. Curr Med Res Opin. 2010;26(3):683‐705. [DOI] [PubMed] [Google Scholar]
- 13. Sun EC, Dixit A, Humphreys K, Darnall BD, Baker LC, Mackey S. Association between concurrent use of prescription opioids and benzodiazepines and overdose: retrospective analysis. BMJ. 2017;356:j760. [DOI] [PMC free article] [PubMed] [Google Scholar]
- 14. Jones JD, Mogali S, Comer SD. Polydrug abuse: a review of opioid and benzodiazepine combination use. Drug Alcohol Depend. 2012;125(1–2):8‐18. [DOI] [PMC free article] [PubMed] [Google Scholar]
- 15. Votaw VR, Geyer R, Rieselbach MM, RK MH. The epidemiology of benzodiazepine misuse: a systematic review. Drug Alcohol Depend. 2019;200:95‐114. [DOI] [PMC free article] [PubMed] [Google Scholar]
- 16. Hoots B, Vivolo‐Kantor A, Seth P. The rise in non‐fatal and fatal overdoses involving stimulants with and without opioids in the United States. Addiction. 2020;115(5):946‐958. [DOI] [PMC free article] [PubMed] [Google Scholar]
- 17. Timko C, Han X, Woodhead E, Shelley A, Cucciare MA. Polysubstance use by stimulant users: health outcomes over three years. J Stud Alcohol Drugs. 2018;79(5):799‐807. [DOI] [PMC free article] [PubMed] [Google Scholar]
- 18. Nelson SJ, Zeng K, Kilbourne J, Powell T, Moore R. Normalized names for clinical drugs: RxNorm at 6 years. J Am Med Inform Assoc. 2011;18(4):441‐448. [DOI] [PMC free article] [PubMed] [Google Scholar]
- 19. RxNav. U.S.National Library of Medicine, National Institutes of Health 2019. https://rxnav.nlm.nih.gov/index.html. Accessed November 18, 2019.
- 20. Ho PM, Bryson CL, Rumsfeld JS. Medication adherence: its importance in cardiovascular outcomes. Circulation. 2009;119(23):3028‐3035. [DOI] [PubMed] [Google Scholar]
- 21. Bell JS, Airaksinen MS, Lyles A, Chen TF, Aslani P. Concordance is not synonymous with compliance or adherence. Br J Clin Pharmacol. 2007;64(5):710. [DOI] [PMC free article] [PubMed] [Google Scholar]
- 22. Dickinson D, Wilkie P, Harris M. Taking medicines: concordance is not compliance. BMJ. 1999;319(7212):787. [DOI] [PMC free article] [PubMed] [Google Scholar]
- 23. Board AR, Guy G, Jones CM, Hoots B. Trends in stimulant dispensing by age, sex, state of residence, and prescriber specialty—United States, 2014–2019. Drug Alcohol Depend. 2020;217:108297. [DOI] [PMC free article] [PubMed] [Google Scholar]
- 24. Majumder MS, Rose S. Health care claims data may be useful for COVID‐19 research despite significant limitations. Health Affairs Blog. 2020.
- 25. Zhu W, Chernew ME, Sherry TB, Maestas N. Initial opioid prescriptions among US commercially insured patients, 2012–2017. N Engl J Med. 2019;380(11):1043‐1052. [DOI] [PMC free article] [PubMed] [Google Scholar]
- 26. Centers for Disease Control and Prevention, U.S. Department of Health and Human Services . 2019 annual surveillance report of drug‐related risks and outcomes—United States surveillance special report. 2019.
Associated Data
This section collects any data citations, data availability statements, or supplementary materials included in this article.
Supplementary Materials
Appendix S1: Supporting information.
Appendix S2: RxNorms.
Appendix S3: NDCs.