

Abstract
As an air pollutant closely related to urban traffic and heavy industrial capacity, the variation of NO2 (nitrogen dioxide) concentration can directly reflect the strength of socioeconomic activities. Using the weekly average results of daily product synthesis of tropospheric NO2 column concentrations from OMI (Ozone Monitoring Instrument) satellite inversion, a weekly-scale variation series of standardized socioeconomic activity index during the Spring Festival period of 2019–2021 is constructed. The results show that the OMI-NO2 satellite data are in good consistency with ground-based monitoring data; the Spring Festival holiday also suppresses socioeconomic activity in normal years, but the coronavirus disease 2019 (COVID-19) epidemic leads to an extended period of 2–3 weeks of weakened socioeconomic activity in China after the holiday, while the minimum value of socioeconomic activity intensity decreases by 0.12. Although socioeconomic activity is significantly suppressed in the short term, the intensity of socioeconomic activity rises steadily with the gradual resumption of work and production everywhere from the third week after the Chinese Spring Festival and has reached 60.91% of the highest level before the holiday in the seventh week after the holiday. OMI-NO2 satellite data can be used for a rapid assessment of the intensity of air pollution emissions and the level of socioeconomic activity in different regions.
Keywords: Remote sensing, OMI, NO2, COVID-19, Socioeconomic activities
Introduction
Nitrogen dioxide (NO2) is an important chemical component in the troposphere and is the main pollutant in the formation of nitric acid rain, acid fog, and photochemical smog, which has had a negative impact on human health and ecosystems, and is one of the six major atmospheric pollutants of key concern to environmental authorities in various countries (Kong et al. 2020; Liu and Du 2016). NO2 mainly comes from emissions from urban traffic and heavy chemical industries, biomass combustion, soil release, and lightning, among which NO2 in winter is mainly released from anthropogenic activities (van der A et al. 2008). The three most important sources of anthropogenic NO2 emissions are industry, transportation, and power plants, contributing 42.0%, 35.2%, and 19.2%, respectively, to the total anthropogenic NO2 emissions in China in 2017, according to the Chinese multi-resolution emission inventory (Zheng et al. 2018). Therefore, changes in industry and transportation may lead to significant changes in NO2 emissions. For example, during the Spring Festival (SF) (1 day before SF to 5 days after it) holiday, the longest holiday in China, many factories will stop production, and therefore NO2 emissions from industry will decrease.
Ground-based NO2 monitoring technology has gradually matured, with increasing temporal resolution and the number of monitoring stations, but it is still impossible to obtain spatially continuous and long-term NO2 concentration trends (Zhang et al. 2018). Compared with the traditional single-point scale ground monitoring, remote sensing technology provides a reliable basis for detecting the spatial and temporal distribution studies of atmospheric NO2 at regional scale due to its high temporal and spatial resolution (Gao and Yu 2015; Huang and Sun 2020). Since the 1990s, with the increasing concern of humans about the atmospheric environment and the emergence of environmental satellites for earth observation, Global Ozone Monitoring Experiment (GOME), Scanning Imaging Absorption Spectrometer for Atmospheric Chartography (SCIAMACHY), Ozone Monitoring Instrument (OMI), Tropospheric Monitoring Instrument (TROPOMI), and other satellite sensors have been applied to the remote sensing monitoring of NO2 column concentration in the troposphere (Boersma et al. 2014; Bracher et al. 2005; Griffin et al. 2019; Martin et al. 2004; Russell et al. 2011). Because of the advantages of satellite remote sensing data in the analysis of NO2 pollution spatial and temporal variation patterns, the relevant data have been widely applied to environmental pollution monitoring in different regions of China, such as Beijing-Tianjin-Hebei (BTH) (Zheng et al. 2014), Yangtze River Delta (YRD) (Wei et al. 2018), Pearl River Delta (PRD) (Liao et al. 2015), and Shandong Province (Zhou et al. 2015).
In addition to long-term analyses of NO2 pollution trends, there are also studies on the impact of major events on pollutant emission, such as the commemoration of the 70th anniversary of China's victory in the war of resistance against Japan and the APEC conference in 2015 (Tao et al. 2009; Zhang et al. 2017a). Also, for related economic issues, studies are analyzing the impact of economic recession on NO2 pollution emissions at the national scale in the USA (Russell et al. 2012).
At present, the novel coronavirus disease 2019 (COVID-19) has spread pandemically in more than 100 countries and regions around the world, causing serious impact on people’s daily production life and the smooth and healthy operation of social economy (Le et al. 2020; Li et al. 2021). As a result of the COVID-19, the Chinese Spring Festival holiday has been extended, the movement of people has been restricted, and the resumption of work has been delayed, especially for the transportation, tourism and entertainment, and food and beverage retail industries. Many scholars have conducted a series of studies on the impact of this epidemic. Chu et al. (2021) concluded that NO2 concentrations were significantly reduced in most regions of China based on observations from the Chinese Environmental Monitoring Station. Zhang et al. (2020) used the WRF-GC (Weather Research and Forecasting—Goddard Earth Observing System Chemical Transport Model) model and TROPOMI tropospheric NO2 column concentration data to conclude that NO2 emissions in East China decreased significantly during the epidemic compared to the pre-epidemic period.
The above studies provide a basis for exploring the atmospheric NO2 changes in China during COVID-19. However, so far, there are fewer relevant studies that analyze the short-term changes of socioeconomic activities during the COVID-19 outbreak. The study verified the OMI satellite remote sensing data based on ground monitoring data, and on this basis, a standardized NO2 emission index was established to analyze the change process of NO2 concentration from 2019 to 2021, quantify the potential impact of the COVID-19 on socioeconomic activities in China, and explore the feasibility of using pollutant remote sensing monitoring technology to analyze the short-term change process of socioeconomic activities on a large scale.
Materials and methods
Satellite data and processing
The primary data used in the study are remotely sensed inversion products from the OMI satellite sensor, a hyperspectral atmospheric environmental monitoring sensor carried on Aura, part of NASA’s (National Aeronautics and Space Administration) Earth observation series of satellites. The sensor, jointly developed by the Netherlands, Finland, and NASA, contains three channels, UV-1, UV-2, and VIS, with an amplitude of 2600 km and can cover the globe once a day (Anoruo 2020). The main monitoring targets of OMI are a variety of trace gases including O3, NO2, SO2, CH2O, etc. The tropospheric column concentration products of OMI that can effectively reflect the NO2 pollution emission characteristics are mainly based on spectral information in the visible wavelength range of 405–465 nm, obtained by the Differential Optical Absorption Spectroscopy (DOAS) inversion method (Goldberg et al. 2019). In this study, we use the OMI Level 3 product OMNO2d (OMI-NO2) from the NASA, which is stored in HDF-EOS5 format, and the file contains tropospheric NO2 column concentration (TropNO2) and total NO2 column concentration (TotNO2) data with a spatial resolution of 0.25° × 0.25° (Zhang et al. 2017b).
To de-minimize, the influence of clouds on the monitoring results, Cloud-Screened daily products (≤ 30%) of TropNO2 were used in the analysis. Since there is a serious data deficit in the daily NO2 data of OMNO2d, in order to obtain relatively effective monitoring results, weekly-scale monitoring products are established by mean synthesis of daily products every 7 days. Considering that the SF holiday also has a large impact on socioeconomic activities, in order to objectively analyze the short-term impact process of the epidemic, the weekly TropNO2 products for the three SF periods (7 weeks before to 8 weeks after the SF) during 2019–2021 were analyzed.
The industrial thermal anomaly and radiation intensity data were obtained from the daily product dataset of 375-m resolution multispectral data from the VIIRS sensor carried by the Soumi-NPP satellite. In this study, the thermal anomalies falling on industrial land were extracted by combining land use classification data and excluding the interference of factors such as reflected sunlight from buildings.
Ground monitoring data
Near-ground NO2 data were obtained from the real-time NO2 monitoring data (μg/m3) released by the National Real-Time Urban Air Quality Release Platform (http://106.37.208.233:20035/) of the China General Environmental Monitoring Station. Three time periods were obtained for comparative analysis in this study, i.e., 2019, 2020, and 2021 (January 20 to February 2). Among them, 1460, 1470, and 1754 effective observation stations and 20,248, 20,156, and 24,406 effective data were obtained for 3 years, respectively. The spatial distribution of NO2 at ground monitoring stations during the epidemic period and the comparison period was obtained by averaging the multi-day data from each station on the basis of excluding the anomalous values.
Standardized socioeconomic activity index
In order to quantitatively analyze the changes in the intensity of socioeconomic activities in a specific region, a standardized socioeconomic activity index (SSEI) on a weekly scale is established using the highest pre-holiday weekly average concentration in the region in that year as a reference, with the following equation:
| 1 |
where, is the standardized socioeconomic activity index for the n-th week of the m-th region in the k-th year, is the mean TropNO2 value for the n-th week of the m-th region in the k-th year, is the maximum value of the TropNO2 in the n-th week of the m-th region in the k-th year.
Kernel density estimation
Kernel density estimation (KDE) is used to calculate the unit density of point and line element measurements in a specified neighborhood, which can visualize the distribution of discrete measurements in a continuous region (Jiang et al. 2017), and the raster value is the unit density. If there exist thermal anomalies x1, x2, …, xn, then the kernel density at any thermal anomaly aggregation area xi is estimated as
| 2 |
where, K is the weight function (Gaussian function is used in the study), h is the search radius, and x − xi denotes the distance from the estimated point to the sample xi.
In the study, the kernel density of thermal anomalies is estimated based on their spatial distribution and the magnitude of radiation intensity to reflect the scale of industrial production in each region.
Results and discussion
Characteristics of the TropNO2 column concentrations during the SF week
By comparing the course of weekly TropNO2 column concentrations in China during the last three SF periods (Fig. 1), it can be seen that all three SF periods show a trend of gradual decrease before the festival and gradual increase after the festival. The highest value in 2019 was 6.22 × 10¹⁵molecules/cm2 in the 5th week before the SF; the highest value in 2020 was 5.30 × 10¹⁵ molecules/cm2 in the 7th week before the SF; the highest value in 2021 was 5.87 × 10¹⁵ molecules/cm2 in the 7th week before the SF. The lowest NO2 column concentrations in the 3 years of the SF occurred in the first week after the SF in 2019. NO2 pollution takes time to dilute, transform, and settle after formation, so the lowest NO2 values often lag slightly behind the pollutant reduction process (Zhang et al. 2017a). In contrast to 2019, the lowest value in 2020 occurs in the second week after the SF. In terms of the minimum values of weekly concentrations during the SF week, the minimum value of the SF in 2020 (1.72 × 10¹⁵ molecules/cm2) is 1.19 × 10¹⁵ molecules/cm2 lower than the minimum value of the same period in 2019 (2.91 × 10¹⁵ molecules/cm2), and the extended process of pollutant concentration reduction and the concentration. The reduced minimum should be directly related to the impact caused by the COVID-19 outbreak. The minimum for the SF in 2021 (2.80 × 10¹⁵ molecules/cm2) is 1.09 × 10¹⁵ molecules/cm2 higher than the minimum for the same period in 2020.
Fig. 1.

Weekly variation of average tropospheric column NO2 density of China during the recent three Chinese Spring Festival periods
Figures 2, 3, and 4 show the weekly variation process of the TropNO2 column concentration before the SF (from Dec. 2, 2019 to Jan. 19, 2020), during the SF (from Jan. 20 to Feb. 2, 2020), and after the SF (from Feb. 3 to Mar. 29, 2020), respectively. In general, before and during the SF, the high NO2 range a lot and show a gradually decreasing law; after the SF, the high NO2 is less, especially NO2 concentration of the first and second week after the SF is the smallest, and from the third week after the SF shows a gradually increasing law. In addition, from its spatial distribution pattern, its main high-value distribution areas coincide with the hotspot areas of socioeconomic development, in which the BTH (Beijing-Tianjin-Hebei), YRD (Yangtze River Delta), and PRD (Pearl River Delta) regions all show high NO2 concentration.
Fig. 2.

Decreased weekly tropospheric NO2 column density in China from Dec. 2, 2019 to Jan 19, 2020
Fig. 3.
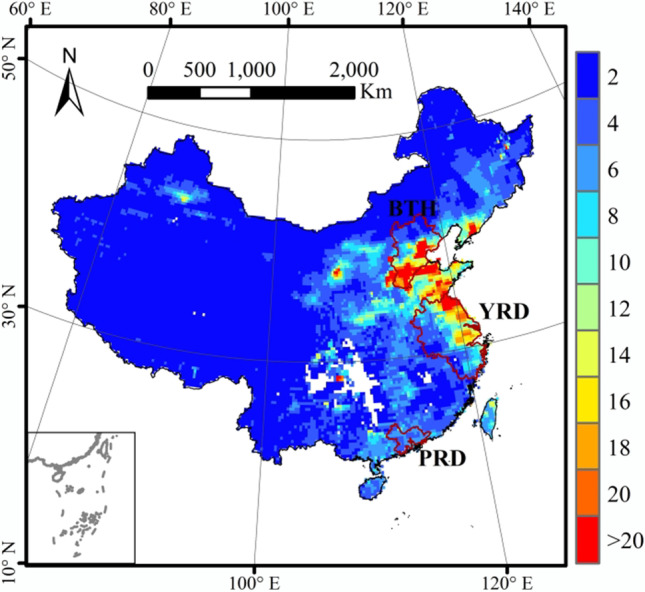
Variation of tropospheric NO2 column concentration in China during the SF week from Jan. 20 to Feb. 2, 2020. BTH, YRD, and PRD denote the Beijing-Tianjin-Hebei, Yangtze River Delta, and Pearl River Delta regions in China, respectively
Fig. 4.

Weekly variation of tropospheric NO2 column concentration in China from Feb. 3 to Mar. 29, 2020
Spatial and temporal analysis of near-surface NO2
The OMI-NO2 concentration represents the NO2 information from the ground to the whole layer of the satellite, and there are still some differences with the mass concentration near the ground. To test the adaptability of the satellite products and also to analyze the impact of COVID-19 on air pollution emissions in China from multiple sources, the study compares the differences between the epidemic period (Fig. 5b) and the comparison period (the same period in 2019 and 2021, Fig. 5a, c) based on the near-ground NO2 concentration data.
Fig. 5.

Spatial distribution of NO2 concentration mean values at ground monitoring stations. (a–c) indicate the spatial distribution of the mean NO2 concentration for the same period from 2019 to 2021, respectively. The black line is the Hu Line
During COVID-19, NO2 was generally low in most areas (83.5% below 30 μg/m3) except for high NO2 (> 40 μg/m3) in BTH, PRD, YRD, and Xinjiang Province, China (Fig. 5b). The spatial distribution of ground observations and satellite inversion results during the epidemic period were in high agreement. In-depth analysis shows that the high value points of NO2 during the epidemic period are mainly associated with coal, chemical, and power plants, which are related to the national livelihood.
Relative to the 2020 epidemic period (22.51 μg/m3), the average NO2 concentrations in the comparison period (Fig. 5a, c) were 38.15 μg/m3 and 36.82 μg/m3, respectively. The high value areas of near-surface NO2 concentrations in the comparison period covered the entire North China Plain, PRD and YRD, i.e., they were mainly distributed in the Hu line (proposed by Chinese geographer Hu Huanyong in 1935 to delineate China’s population density comparison line (Wang et al. 2019)) to the east. As for Hubei Province, which is the center of the epidemic outbreak in China, the near-ground NO2 concentration is 39.80 μg/m3 and 37.74 μg/m3 in 2019 and 2021, respectively, while NO2 decreases to 20.32 μg/m3 during the epidemic period.
By comparing the near-ground NO2 concentrations during the epidemic period, it was found that the near-ground NO2 concentrations decreased by about 50% nationwide and about 50% in Hubei Province within only half a month of the epidemic outbreak. In terms of time scale, the near-ground NO2 concentrations are in good agreement with the satellite results, which also illustrates the feasibility of using satellite remote sensing data to analyze the NO2 changes in different regions of China.
Temporal variation of industrial thermal anomalies under the influence of epidemics
The number of industrial thermal anomalies can indicate the spatial distribution of industrial production as well as the various characteristics, and the magnitude of radiation intensity can characterize the scale of industrial production and energy consumption, which indirectly reflects the air quality condition (Sun et al. 2020, 2019). Thermal anomalies are mostly distributed in three heavy industrial cities, Tangshan, Tianjin, and Handan in China (Fig. 6). Comparing the temporal changes of thermal anomalies before and after the SF in the three regions, it is easy to find that the number of thermal anomalies in the YRD stays at 50 before the SF, decreases gradually from the first week before the SF until the second week after the SF, and then the thermal anomalies increase substantially; the thermal anomalies in the BTH region decrease gradually from the seventh week to the third week before the SF. In the following 3 weeks, the number of thermal anomalies remained around 50. The number of thermal anomalies increases substantially from the SF week; unlike the other two regions, the number of thermal anomalies in the PRD region is always maintained at a low level during the SF week. Comparing the radiation intensity of thermal anomalies in the three regions (Table 1), the radiation intensity of the BTH region before and after the SF is always maintained around 1.6 MW; the radiation intensity of the PRD region gradually decreases from the seventh week before the Spring Festival, reaches the lowest value in the first week after the SF, and then rises rapidly; the radiation intensity of the YRD region gradually decreases from the second week before the SF until it reaches the lowest point in the Spring Festival week, and then starts to rise gradually. Due to the heavy industrial structure in the BTH region, which is dominated by heavy industries with high pollution and high energy consumption such as thermal power generation, iron and steel, and cement, such industries did not stop production during the epidemic because of the existence of uninterruptible production processes (Xia et al. 2018). The results of this study also verified the findings.
Fig. 6.

Kernel density of industrial thermal anomaly and radiation intensity in the BTH region. (a–p) indicate the weekly changes from 7 weeks before to 8 weeks after Chinese New Year, respectively
Table 1.
Thermal anomalies (TA) and radiation intensities (FPR, unit: MW) in the BTH, YRD, and PRD regions
| Week a | BTH-TA | BTH-FPR | PRD-TA | PRD-FPR | YRD-TA | YRD-FPR |
|---|---|---|---|---|---|---|
| − 7 | 131 | 1.65 | 37 | 3.13 | 45 | 3.51 |
| − 6 | 146 | 1.46 | 35 | 1.92 | 52 | 3.31 |
| − 5 | 74 | 1.65 | 3 | 0.61 | 38 | 3.40 |
| − 4 | 81 | 1.70 | 17 | 2.14 | 50 | 3.73 |
| − 3 | 56 | 1.71 | 17 | 1.61 | 55 | 3.54 |
| − 2 | 56 | 1.60 | 22 | 1.49 | 29 | 3.68 |
| − 1 | 55 | 1.77 | 1 | 1.19 | 72 | 3.14 |
| 0 | 65 | 1.79 | 23 | 0.81 | 67 | 2.48 |
| 1 | 91 | 1.65 | 0 | 0.65 | 53 | 3.01 |
| 2 | 141 | 1.62 | 4 | 1.66 | 45 | 2.97 |
| 3 | 222 | 1.83 | 8 | 1.61 | 151 | 3.94 |
| 4 | 80 | 1.20 | 7 | 0.90 | 100 | 4.39 |
| 5 | 146 | 1.70 | 2 | 1.60 | 113 | 4.12 |
| 6 | 327 | 1.64 | 8 | 1.94 | 130 | 4.53 |
| 7 | 431 | 1.77 | 5 | 2.75 | 215 | 3.89 |
| 8 | 264 | 1.58 | 6 | 2.01 | 60 | 3.99 |
aWeeks relative to the SF week
Time-series changes of the SSEI
The SSEI reached its highest value in the 5th week before the SF week in 2019, rapidly decreased to bottom in the 1st week after the SF week, and rapidly recovered to 66.8% of the highest value in the 3rd week after the SF, and then kept fluctuating and changing around 70% due to short-term meteorological processes (Fig. 7). The lowest value of the SSEI was only 0.32 in 2020 due to the epidemic, which is lower than 0.15 lower than that of 2019, and the lowering period lasted longer. The SSEI starts to recover gradually in the 4th week after the SF in 2020 and reaches the highest value of 0.61 in the 8th week after the SF, which is only 0.12 different from the value of the index in the same week of the SF week in 2019, so it can be seen that although the epidemic has had a serious impact on socioeconomic activities nationwide, the SSEI rises week by week from the 4th week onwards as the effectiveness of epidemic prevention gradually emerges, indicating that socioeconomic activities are steadily recovering. The SSEI decreases to the lowest value in the second week before the SF week in 2021 and then remains around 0.5 until the third week after the SF, and gradually increases from the fourth week after the SF until it reaches the highest value in the eighth week.
Fig. 7.
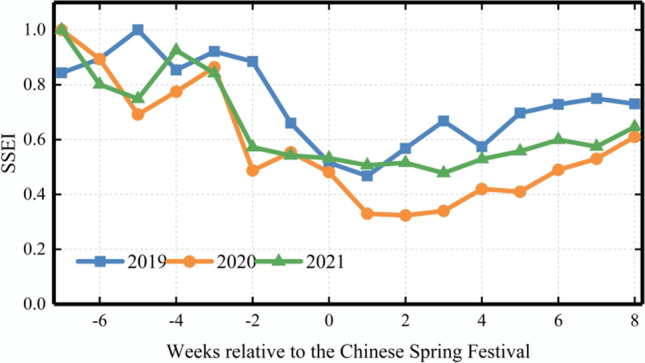
Weekly variation of the SSIE in China during the recent three SF periods
To grasp the short-term impact process of the epidemic on the economic hotspot regions in China, the change process of the SSEI of the three major urban clusters (BTH, YRD, and PRD) in the SF week of 2020 was analyzed (Fig. 8). The SSEI of the PRD region decreases most significantly in the previous period due to the epidemic, with the SSEI dropping sharply to 18.4% of the highest value, while the YRD and BTH regions also drop to 22.8% and 31.9% of the highest value, respectively. The PRD region has the largest decrease, which may be directly related to its highest reliance on foreign workers. A series of preventive measures such as “city closure” and traffic restrictions have significantly pushed back the wave of returning workers, with limited recovery in the PRD region in the first few weeks after the holiday. However, as the main heavy chemical base in the three major urban clusters, the pillar industries of the BTH region, such as iron and steel metallurgy and petrochemicals, are resource-based industries with high pollution and energy consumption, which require high continuity of factory production, and thus the SSEI drop is the smallest (Bo et al. 2017; Le et al. 2019; Zhao et al. 2021). The decline process of the SSEI in the BTH region is similar to that of the national average, reaching the lowest after the 3rd week after the SF. The decline process of YRD was similar to that of BTH, but the decline process in the YRD continued until the 4th week after SF. Due to the absence of 2 weeks of data, it is not possible to understand the recovery of socioeconomic activity in the PRD region during this time period, but the general trend shows that the overall recovery in the economically developed regions is slightly better than the national average.
Fig. 8.

Weekly variation of the SSIE of three metropolitans in China during the 2020 Chinese Spring Festival period
Conclusion
Satellite remote sensing provides continuous data sources for monitoring and estimating large-scale and long-term changes in environment. Based on the weekly synthesis results of tropospheric NO2 column concentrations from OMI satellite inversions, the SSEI differences for the 2019–2021 SF week were compared by constructing SSEI, and it was found that the COVID-19 epidemic caused some significant effects on socioeconomic activities in China in the short term. For example, (1) the epidemic prolonged the period of reduced socioeconomic activity after the SF holiday by 2–3 weeks; (2) the epidemic caused the lowest value of SSEI to decrease by 0.12 relative to a normal year; (3) the SSEI in China steadily rebounded from the third week after the SF and recovered to 61.1% of the highest value before the SF in the eighth week after the SF, and economic hotspots such as the BTH and YRD also showed similar trends. The study provides a new quantitative analysis method, which reflects the short-term suppression and recovery process of socioeconomic activities in China by the epidemic and the SF holidays. The OMI-NO2 data has a good response to the monitoring of NO2 concentration during major events, providing an important basis for air quality assurance and the formulation of relevant environmental protection policies and regulations.
Acknowledgements
The authors would like to acknowledge the National Aeronautics and Space Administration for providing the OMI-NO2 satellite data, industrial thermal anomaly, and radiation intensity data, and the China General Environmental Monitoring Station for providing the near-ground NO2 data. We are also thankful for several anonymous reviewers for their help in improving this paper with their constructive suggestions.
Author contribution
HC is responsible for the conceptualization, methodology, software, validation, and visualization of this article, while LH is responsible for supervision.
Data availability
Data sharing is not applicable to this article as no datasets were generated or analyzed during the current study.
Declarations
Ethics approval
Not applicable.
Consent to participate
The authors are informed and agree to the study.
Consent for publication
All authors agree to have this manuscript published in this journal.
Conflict of interest
The authors declare no competing interests.
Footnotes
Publisher's Note
Springer Nature remains neutral with regard to jurisdictional claims in published maps and institutional affiliations.
References
- Anoruo CM. Validation of OMI seasonal and spatio-temporal variations in aerosol-cloud interactions over Banizoumbou using AERONET data. J Atmos Sol-Terr Phy. 2020;211:105457. doi: 10.1016/j.jastp.2020.105457. [DOI] [Google Scholar]
- Bo X, Xu J, Du XH, et al. Impacts assessment of steel plants on air quality over Beijing-Tianjin-Hebei area. China Environ Sci. 2017;37:1684–1692. doi: 10.3969/j.issn.1000-6923.2017.05.011. [DOI] [Google Scholar]
- Boersma K, Jacob D, Trainic M, et al. Validation of urban NO2 concentrations and their diurnal and seasonal variations observed from space (SCIAMACHY and OMI sensors) using in situ measurements in Israeli cities. Atmos Chem Phys. 2014;9:3867–3879. doi: 10.5194/acp-9-3867-2009. [DOI] [Google Scholar]
- Bracher A, Bovensmann H, Bramstedt K, et al. Cross comparisons of O3 and NO2 measured by the atmospheric ENVISAT instruments GOMOS, MIPAS, and SCIAMACHY. Adv Space Res. 2005;36:855–867. doi: 10.1016/j.asr.2005.04.005. [DOI] [Google Scholar]
- Chu BW, Zhang SP, Liu J, et al. Significant concurrent decrease in PM2.5 and NO2 concentrations in China during COVID-19 epidemic. J Environ Sci. 2021;99:346–353. doi: 10.1016/j.jes.2020.06.031. [DOI] [PMC free article] [PubMed] [Google Scholar]
- Gao Q, Yu C. A review of urbanization impact on nitrogen cycle. Prog Geog. 2015;34:726–738. doi: 10.18306/dlkxjz.2015.06.008. [DOI] [Google Scholar]
- Goldberg DL, Lu ZF, Oda T, et al. Exploiting OMI NO2 satellite observations to infer fossil-fuel CO2 emissions from U.S. megacities. Sci Total Environ. 2019;695:133805. doi: 10.1016/j.scitotenv.2019.133805. [DOI] [PubMed] [Google Scholar]
- Griffin D, Zhao XY, McLinden CA, et al. High-resolution mapping of nitrogen dioxide with TROPOMI: first results and validation over the Canadian oil sands. Geophys Res Lett. 2019;46:1049–1060. doi: 10.1029/2018GL081095. [DOI] [PMC free article] [PubMed] [Google Scholar]
- Huang GY, Sun K. Non-negligible impacts of clean air regulations on the reduction of tropospheric NO2 over East China during the COVID-19 pandemic observed by OMI and TROPOMI. Sci Total Environ. 2020;745:141023. doi: 10.1016/j.scitotenv.2020.141023. [DOI] [PMC free article] [PubMed] [Google Scholar]
- Jiang SR, Wang Y, Wang M, et al. Industrial sectors and pollution in China based on the regional perspective. China Environ Sci. 2017;37:4380–4387. doi: 10.3969/j.issn.1000-6923.2017.11.044. [DOI] [Google Scholar]
- Kong L, Tang X, Zhu J, et al. Evaluation and uncertainty investigation of the NO2, CO and NH3 modeling over China under the framework of MICS-Asia III. Atmos Chem Phys. 2020;20:181–202. doi: 10.5194/acp-20-181-2020. [DOI] [Google Scholar]
- Le P, Zhao YY, Zhao JL, et al. Spatiotemporal patterns of air pollution in air pollution transmission channel of Beijing-Tianjin-Hebei from 2000 to 2015. China Environ Sci. 2019;39:449–458. doi: 10.3969/j.issn.1000-6923.2019.02.001. [DOI] [Google Scholar]
- Le TH, Wang Y, Liu L, et al. Unexpected air pollution with marked emission reductions during the COVID-19 outbreak in China. Science. 2020;369:702–706. doi: 10.1126/science.abb7431. [DOI] [PMC free article] [PubMed] [Google Scholar]
- Li MY, Zhang ZL, Cao WX, et al. Identifying novel factors associated with COVID-19 transmission and fatality using the machine learning approach. Sci Total Environ. 2021;764:142810. doi: 10.1016/j.scitotenv.2020.142810. [DOI] [PMC free article] [PubMed] [Google Scholar]
- Liao ZH, Sun JR, Fan SJ, et al. Variation characteristics and influencing factors of air pollution in Pearl River Delta area from 2006 to 2012. China Environ Sci. 2015;35:329–336. [Google Scholar]
- Liu HJ, Du GJ. Spatial pattern and distributional dynamics of urban air pollution in China: an empirical study based on AQI and six sub-pollutants of 161 cities. Econ Geogr. 2016;36:33–38. doi: 10.15957/j.cnki.jjdl.2016.10.005. [DOI] [Google Scholar]
- Martin RV, Parrish DD, Ryerson TB, et al. Evaluation of GOME satellite measurements of tropospheric NO2 and HCHO using regional data from aircraft campaigns in the southeastern United States. J Geophys Res Atmos. 2004;109:D24307. doi: 10.1029/2004JD004869. [DOI] [Google Scholar]
- Russell A, Perring A, Valin L, et al. A high spatial resolution retrieval of NO2 column densities from OMI: method and evaluation. Atmos Chem Phys Discuss. 2011;11:12411–12440. doi: 10.5194/acpd-11-12411-2011. [DOI] [Google Scholar]
- Russell A, Valin L, Cohen R. Trends in OMI NO2 observations over the United States: effects of emission control technology and the economic recession. Atmos Chem Phys. 2012;12:12197–12209. doi: 10.5194/acp-12-12197-2012. [DOI] [Google Scholar]
- Sun S, Li LJ, Wu ZH, et al. Variation of industrial air pollution emissions based on VIIRS thermal anomaly data. Atmos Res. 2020;244:105021. doi: 10.1016/j.atmosres.2020.105021. [DOI] [Google Scholar]
- Sun S, Li LJ, Zhao WJ, et al. Industrial pollution emissions based on thermal anomaly remote sensing monitoring: a case study of Southern Hebei urban agglomerations, China. China Environ Sci. 2019;39:3120–3129. doi: 10.3969/j.issn.1000-6923.2019.07.051. [DOI] [Google Scholar]
- Tao JH, Wang ZF, Han D, et al. Analysis of crop residue burning and tropospheric NO2 vertical column density retrieved from satellite remote sensing in North China. China Environ Sci. 2009;29:1016–1020. doi: 10.3321/j.issn:1000-6923.2009.10.003. [DOI] [Google Scholar]
- van der ARJ, Eskes HJ, Boersma KF, et al. Trends, seasonal variability and dominant NOx source derived from a ten year record of NO2 measured from space. J Geophys Res Atmos. 2008;113:D04302. doi: 10.1029/2007JD009021. [DOI] [Google Scholar]
- Wang H, Gao ZQ, Ren JZ, et al. An urban-rural and sex differences in cancer incidence and mortality and the relationship with PM2.5 exposure: an ecological study in the southeastern side of Hu line. Chemosphere. 2019;216:766–773. doi: 10.1016/j.chemosphere.2018.10.183. [DOI] [PubMed] [Google Scholar]
- Wei YY, Yang SQ, Chen ZQ, et al. Tropospheric NO2 Characteristics of the Yangtze River Delta region based on OMI satellite data. Environ Sci Technol. 2018;41:80–87. doi: 10.19672/j.cnki.1003-6504.2018.03.012. [DOI] [Google Scholar]
- Xia HP, Chen YH, Quan JL. A simple method based on the thermal anomaly index to detect industrial heat sources. Int J Appl Earth Obs Geoinf. 2018;73:627–637. doi: 10.1016/j.jag.2018.08.003. [DOI] [Google Scholar]
- Zhang H, Yu C, Su L et al (2017a) Emission control effects observed from space during the military parade 2015 in Beijing. J Remote Sens 21:622–632. 10.11834/jrs.20175337
- Zhang RX, Zhang YZ, Lin HP, et al. NOx emission reduction and recovery during COVID-19 in East China. Atmosphere. 2020;11:433. doi: 10.3390/atmos11040433. [DOI] [Google Scholar]
- Zhang WT, Zhang XY, Liu L, et al. Spatial variations in NO2 trend in North China Plain based on multi-source satellite remote sensing. J Remote Sens. 2018;22:335–346. doi: 10.11834/jrs.20187305. [DOI] [Google Scholar]
- Zhang XY, Lu XH, Liu L, et al. Dry deposition of NO2 over China inferred from OMI columnar NO2 and atmospheric chemistry transport model. Atmos Environ. 2017;169:238–249. doi: 10.1016/j.atmosenv.2017.09.017. [DOI] [Google Scholar]
- Zhao X, Shen NC, Li LJ, et al. Analysis of changes and factors influencing air pollutants in the Beijing-Tianjin-Hebei region during the COVID-19 pandemic. Environ Sci. 2021;42:1205–1214. doi: 10.13227/j.hjkx.202007249. [DOI] [PubMed] [Google Scholar]
- Zheng B, Tong D, Li M, et al. Trends in China’s anthropogenic emissions since 2010 as the consequence of clean air actions. Atmos Chem Phys Discuss. 2018;18:14095–14111. doi: 10.5194/acp-2018-374. [DOI] [Google Scholar]
- Zheng XX, Li LJ, Zhao WJ et al (2014) Spatial and temporal characteristics of atmospheric NO2 in the Beijing-Tianjin-Hebei region. Ecol Environ Sci:1938–1945. 10.3969/j.issn.1674-5906.2014.12.008
- Zhou CY, Li Q, He YX, et al. Spatial-temporal change of tropospheric NO2 column density and its impact factors over Shandong province during 2005–2014. China Environ Sci. 2015;35:2281–2290. doi: 10.3969/j.issn.1000-6923.2015.08.005. [DOI] [Google Scholar]
Associated Data
This section collects any data citations, data availability statements, or supplementary materials included in this article.
Data Availability Statement
Data sharing is not applicable to this article as no datasets were generated or analyzed during the current study.