

Abstract
Osteosarcoma has been the most common malignant bone tumor in children and adolescents, while the 5‐y survival of osteosarcoma patients gained no significant improvement over the past decades. This study aimed to explore the role of ferroptosis‐related genes (FRGs) in the development and prognosis of osteosarcoma. The datasets of osteosarcoma patients including RNA sequencing data and clinical information were acquired from the TRGET and Gene Expression Omnibus (GEO) databases. The identification of molecular subgroups with different FRG expression patterns was achieved through nonnegative matrix factorization (NMF) clustering. The prognostic model was constructed using the least absolute shrinkage and selection operator (LASSO) algorithm and multivariate Cox regression analysis. The ESTIMATE algorithm was applied for determining the stromal score, immune score, ESTIMA score, and tumor purity of osteosarcoma patients. Functional analyses including Gene Ontology (GO), Kyoto Encyclopedia of Genes and Genomes (KEGG) analyses, Gene Set Enrichment Analysis (GSEA), and Gene Set Variation Analysis (GSVA) were conducted to explore the underlying mechanisms in the development and prognosis of osteosarcoma. Two molecular subgroups with different FRGs expression patterns were identified. The molecular subgroups with higher immune score and more active immune status showed better prognostic survival. On the basis of FRGs, a prognostic model and a nomogram integrating clinical characteristics were constructed and their prediction efficiency for osteosarcoma prognosis were well validated. Gene functional enrichment analysis showed that these differentially expressed FRGs were mainly enriched in immunity‐related signaling pathways, indicating that FRGs may affect the development and prognosis of osteosarcoma by regulating the immune microenvironment. The expression profiles of FRGs were closely related to the immunity status and prognostic survival of osteosarcoma patients. The interaction between ferroptosis and immunity in the development of osteosarcoma could provide a new insight into the exploration of molecular mechanisms and targeted therapies of osteosarcoma patients.
Keywords: ferroptosis, immunity, osteosarcoma, prognosis, tumor microenvironment
Ferroptosis‐related gene signature associates with immunity and predicts prognosis of osteosarcoma.

1. INTRODUCTION
Osteosarcoma is the most common primary bone tumor in children, adults and the elderly over 60 y old. 1 , 2 Osteosarcoma is a kind of malignant tumor with common occurrence in the metaphysis of long bone, which is characterized with poor prognosis and high disability rate. The poor prognosis of osteosarcoma is mainly due to its predisposition to metastases, especially lung metastases. 3 , 4 Follow‐up data have shown that osteosarcoma patients without lung metastases had a 70% 5‐y survival rate, which decreased to 30% for patients with lung metastases. 5 Despite the treatment advancement for osteosarcoma, such as chemotherapy, neoadjuvant chemotherapy, radiotherapy, and immunotherapy, the 5‐y survivorship of osteosarcoma patients has still been far from satisfactory. It has been reported that the genomic complexity and instability of osteosarcoma slows the progress of treatment. 6 As such, it was necessary to optimize the early detection, treatment progress, and prognosis prediction of osteosarcoma from the perspective of molecular genetics.
Over the last decade, iron metabolism has become a hotspot in the research into the mechanism of the tumorigenesis and development. 7 , 8 , 9 As an essential element of life, iron plays a critical role in various biological process including DNA synthesis, energy transport, erythropoiesis, as well as cell signaling. 10 , 11 However, the dysregulation of iron metabolism, involving the redox reaction of iron in vivo, would result in the overproduction of reactive oxygen species (ROS). 12 As a result, the overproduced ROS would cause damage to genetic material, such as DNA and RNA, thereby inducing gene mutations and cell damage. 12 Ferroptosis is an iron‐dependent non‐apoptotic programmed cell death, which is characterized by altered iron metabolism and lipid peroxidation. 13 Cells undergoing ferroptosis show some morphology characteristics, including dysmorphic small mitochondria with decreased cristae, membrane condensation, and outer membrane rupture. 14 Different from apoptosis, which involves a mechanism to induce specific cell death at specific time points, ferroptosis is more of a mechanism protecting cellular integrity. 15 Therefore, newly developed cancer therapy methods based on ferroptosis have shown great potential for treating cancer patients who are resistant to conventional therapeutics, which mainly involved the apoptosis pathways. 16 , 17 For example, some studies have found that the ferroptosis activator could promote cell death of fibrosarcoma tissues and lung cancer tissues. 18 In addition, Harris and colleagues 19 found that buthionine sulfoximine, a ferroptosis agonist, could promote cell death in non–small‐cell lung cancer, colon cancer, breast cancer, and lymphoma. Also, Q. Liu and co‐workers 18 found that the objective response rate of osteosarcoma patients receiving cisplatin treatment could be enhanced by activating ferroptosis signaling. Consequently, ferroptosis‐based therapy showed promising prospects in improving the therapeutic effect of cancer chemotherapy.
In addition to the treatment exploration of cancer, many studies have investigated the underlying mechanism of occurrence and development of various tumors from the perspective of ferroptosis, 20 , 21 and aimed to construct prognostic models through bioinformatic analysis based on ferroptosis. 22 , 23 With the increase in sequencing data of tumor tissue, many prognostic models based on FRGs have been successfully constructed, which showed potential clinical sense for prognosis prediction and development of molecular targeted drugs. However, as the most common malignant bone tumor, there has been no such prognostic model of osteosarcoma. Here, in this study, we developed a prognostic model based on the FRGs and explored its prognostic role for osteosarcoma patients; we also explored its correlation with immune status in osteosarcoma.
2. DATA AND METHODS
2.1. Collection of osteosarcoma datasets
Clinical data and RNA sequencing data regarding osteosarcoma patients were acquired from Therapeutically Applicable Research to Generate Effective Treatments (TARGET; https://ocg.cancer.gov/programs/target) databases, with 93 samples included and set as the training cohort. From the Gene Expression Omnibus (GEO; https://www.ncbi.nlm.nih.gov/geo/) database, 47 samples (GSE21257) were acquired and set as the verification cohort. In total, 112 FRGs were acquired from the Reactome and Gene Ontology (GO) analysis and Kyoto Encyclopedia of Genes and Genomes (KEGG) databases.
2.2. Screening of prognosis‐related genes and preliminary classification of molecular subgroups
Univariate COX regression analysis was first carried out to identify prognosis‐related FRGs of osteosarcoma patients, datasets of which were derived from the TARGET database. Then nonnegative matrix factorization (NMF) clustering was applied for identification of new subtypes using the nmf R package. The Estimation of Stromal and Immune cells in Malignant Tumor tissues using Expression data (ESTIMATE) algorithm was used to calculate stromal score, immune score, ESTIMA score, and tumor purity of different molecular subgroups.
2.3. Construction and verification of a prognostic model based on FRGs
The prognostic model was constructed based on the TARGET dataset, which was set as the training cohort. Preliminarily screened prognosis‐related FRGs were further narrowed down using the least absolute shrinkage and selection operator (LASSO) analysis through the glmnet R package. The constructed prognostic model could be represented concisely using the formula: risk score = , in which the X represents the expression level of each FRGs and the Coef represents the coefficient of relative prognostic FRGs in multivariate Cox regression model. In accordance with the prognostic model, the prognostic risk score of each osteosarcoma patient could be calculated and the medium was defined as the boundary between high and low risk groups. Patients with risk scores more than the medium value were grouped into the high risk. In addition, the samples from the GEO database were set as a verification cohort to validate the predication performance of the constructed prognostic model.
2.4. Construction and validation of the nomogram based on the prognostic model
A nomogram integrating the prognostic model and clinical characteristics of osteosarcoma patients, including sex, age, tumor metastasis, and tumor site, was constructed for better prediction of prognosis in both the training and verification cohorts. In addition, the prognosis prediction efficiency of the constructed nomogram was validated in the verification cohorts through comparing the fitting degree between the observed values and the optimized values.
2.5. Functional analyses and mechanism exploration
The underlying effect of FRGs on the development of osteosarcoma was explored through functional enrichment analysis. Firstly, the differentially expressed genes (DEGs) between the high risk and low risk groups were identified with R package limma. Then the pathway enrichment analyses, including Gene Ontology (GO) analysis and KEGG analyses were completed to explore underlying pathways. In addition, a protein‐protein interaction (PPI) network on the basis of identified DEGs was constructed in the Search Tool for the Retrieval of Interacting Genes (STRING) database to screen hub genes. In addition, the Gene Set Variation Analysis (GSVA) algorithm was applied to explore the activity variation of biological process (BP) terms in GO analysis.
2.6. Statistical analyses
R software (version 3.6.1) and SSPS software (SPSS Inc, Chicago, IL, USA) were applied for statistical analyses. The survival‐related genes were identified through univariate Cox regression analysis and survival analysis and was achieved through the Kaplan‐Meier curve. The prognostic prediction genes used for the construction of the prognostic model were screened through multivariate COX regression analysis. The prediction efficiency of the prognostic model was assessed using time‐dependent receiver operating characteristic (ROC) analysis. Student t test was applied for statistical analysis between 2 groups, and 1‐way analysis of variance (ANOVA) was selected flexibly when there were 3 or more groups. A P‐value < .05 was considered as statistically different.
3. RESULTS
3.1. Clustering of molecular subgroup
Here, 15 prognostic‐related FRGs (Table 1) were identified through univariate COX regression analysis. On the basis of the 15 identified prognostic genes, a preliminary classification of molecular subgroups was performed through the nmf consensus clustering (Figure S1), with 2 subgroups classified out reasonably (Figure 1A). As shown in Figure 1B, the expression levels of prognostic‐related genes in each patient in cluster 1 and cluster 2 were visualized using a heatmap. In addition, the immune condition of the osteosarcoma tissues of each patient was evaluated using the ESTIMATE algorithm and compared between the 2 clusters. As shown in Figure 1C‐F, the osteosarcoma tissues in the cluster 2 showed higher stromal score, immune score, and ESTIMATE score, as well as lower tumor purity than cluster 1. Also, the TIMER algorithm was applied to calculate the abundance of immune cells in osteosarcoma tissues, including B cells, CD4+ T cells, CD8+ T cells, neutrophil cells, macrophage cells, and dendritic cells, with statistically higher abundance of CD8 T cells, macrophage cells, and dendritic cells found in the cluster 2 (Figure 1G). In addition, we compared the overall survival of the 2 clusters and found that cluster 1 underwent better overall survival (Figure 1H).
TABLE 1.
Prognostic genes generated by univariate Cox analysis
| Gene | Coef | HR | HR.95L | HR.95H | P‐value |
|---|---|---|---|---|---|
| SOCS1 | −0.67009 | 0.511662 | 0.355563 | 0.736293 | .000308 |
| MYC | 0.64282 | 1.901836 | 1.327286 | 2.725095 | .00046 |
| MUC1 | 0.33054 | 1.391719 | 1.130938 | 1.712632 | .001795 |
| FTH1 | −0.69305 | 0.50005 | 0.319719 | 0.782095 | .00239 |
| G6PD | −0.64234 | 0.526061 | 0.343779 | 0.804994 | .003083 |
| ALOX15B | 0.904224 | 2.470013 | 1.337533 | 4.561357 | .003862 |
| ATG7 | −0.71787 | 0.487792 | 0.290872 | 0.818027 | .0065 |
| CBS | 0.379009 | 1.460837 | 1.107137 | 1.927534 | .007373 |
| PEBP1 | −0.68737 | 0.502896 | 0.2927 | 0.86404 | 0.012804 |
| FTL | −0.51299 | 0.598702 | 0.394661 | 0.908233 | 0.015837 |
| EGLN1 | 0.490507 | 1.633145 | 1.078991 | 2.471902 | 0.020369 |
| PGD | −0.51693 | 0.596346 | 0.380974 | 0.933472 | 0.023754 |
| GSS | −0.55546 | 0.573806 | 0.353501 | 0.931409 | 0.02461 |
| SLC39A8 | −0.41425 | 0.660834 | 0.443831 | 0.983936 | 0.04138 |
| DPP4 | −0.21404 | 0.807314 | 0.656789 | 0.992338 | 0.04205 |
FIGURE 1.

Screening of molecular subgroups through nonnegative matrix factorization (NMF) cluster. A, Two subgroups was identified the optimal value for consensus clustering. B, Heatmap visualizing the expression of ferroptosis‐related genes in the 2 subgroups; comparations between the 2 subgroups in terms of (C) stromal score, (D) immune score, (E) ESTIMATE score, (F) tumor purity, G, abundance of immune filtrating cells in tumor tissues, and (H) survival curve of the patients
3.2. Construction of prognostic model based on the TARGET dataset
The prognostic prediction value of the FRGs gene signature in osteosarcoma patients was then detected. LASSO analysis further identified 12 prognostic genes (Table 2, Figures 2A and S2), which was finally used for constructing the prognostic model. In accordance with the constructed prognostic model, each patient was assigned with a risk score and patients were grouped into high risk or low risk groups depending on the score (Figure 2B). As shown in Figure 2C, the gene expression level of FRGs in each patient was visualized through a heatmap. In addition, immune condition evaluation (Figure 2D‐K) revealed that the high risk group showed statistically higher stromal score, immune score, ESTIMATE score, and lower tumor purity, as well as lower abundance of immune cells in osteosarcoma tissues, including dendritic cells, B cells, CD4+ T cells, and macrophage cells, compared with the low risk group. What is more, patients in the low risk group showed better overall survival than patients in the high risk group (Figure 2L). Time‐dependent ROC analysis was applied to further evaluate the prediction efficiency of the constructed prognostic model, with the areas under curve (AUC) of 1, 3 and 5 y being 0.806, 0.818 and 0.838, respectively (Figure 2M).
TABLE 2.
Genes included for construction prognostic‐related gene signature
| Sig_genes | Active coefficient | Full name | Category | Gene card ID |
|---|---|---|---|---|
| ALOX15B | 0.902212994 | Arachidonate 15‐Lipoxygenase Type B | Protein Coding | GC17P008039 |
| ATG7 | −0.668153678 | Autophagy Related 7 | Protein Coding | GC03P011273 |
| CBS | 0.090367621 | Cystathionine Beta‐Synthase | Protein Coding | GC21M043053 |
| DPP4 | −0.019240524 | Dipeptidyl Peptidase 4 | Protein Coding | GC02M161992 |
| EGLN1 | 0.182768936 | Egl‐9 Family Hypoxia Inducible Factor 1 | Protein Coding | GC01M231363 |
| G6PD | −0.065538143 | Glucose‐6‐Phosphate Dehydrogenase | Protein Coding | GC0XM154531 |
| MUC1 | 0.178257302 | Mucin 1, Cell Surface Associated | Protein Coding | GC01M155185 |
| MYC | 0.336193028 | MYC Proto‐Oncogene, BHLH Transcription Factor | Protein Coding | GC08P127735 |
| PEBP1 | −0.687714327 | Phosphatidylethanolamine Binding Protein 1 | Protein Coding | GC12P118135 |
| PGD | −0.028691641 | Phosphogluconate Dehydrogenase | Protein Coding | GC01P010398 |
| SLC39A8 | −0.061396094 | Solute Carrier Family 39 Member 8 | Protein Coding | GC04M102252 |
| SOCS1 | −0.317892139 | Suppressor Of Cytokine Signaling 1 | Protein Coding | GC16M011255 |
FIGURE 2.

Construction of the prognosis risk prediction model in the training cohort. A, Twelve candidate genes screened out by LASSO analysis with minimal lambda. B, Distribution of risk score and survival status of each osteosarcoma patient in the high risk and low risk groups. C, Heatmap visualizing the expression matrix of the 12 candidate genes in the 2 groups. D‐L, Comparisons between the 2 groups in terms of stomal score, immune score, ESTIMATE score, tumor purity, abundance of immune filtrating cells in tumor tissues and survival curve of the patients. M, Time‐dependent ROC curve of the constructed model
3.3. Independence testing of the constructed prognostic model
The independence of the constructed prognostic model from the patients’ clinical characteristics, including sex, age, metastasis condition, and lesion site, was detected through COX regression analysis and subgroup analysis. As shown in Figure 3A, the univariate and multivariate COX regression analysis showed that risk score, metastasis condition, and lesion site were independently associated with the prognosis of osteosarcoma patients, while no prognosis association was found in terms of sex and age. In addition, the subgroup analysis grouped by age (Figure 3C), sex (Figure 3D) and metastasis condition (Figure 3F) showed that patients in each subgroup with higher risk score had a poor prognosis, which demonstrated the independent prediction efficiency of the constructed prognostic model. In addition, we also detected whether there was significant difference between each subgroup in terms of risk score, with no significant difference found between subgroups grouped by gender (Figure 3G), age (Figure 3H), and lesion site (Figure 3I). While a significant difference of risk score was found between the metastasis and non‐metastasis subgroups (Figure 3F). These results indicated that the constructed prognostic model could be applied to independently predict the prognosis of osteosarcoma patients.
FIGURE 3.
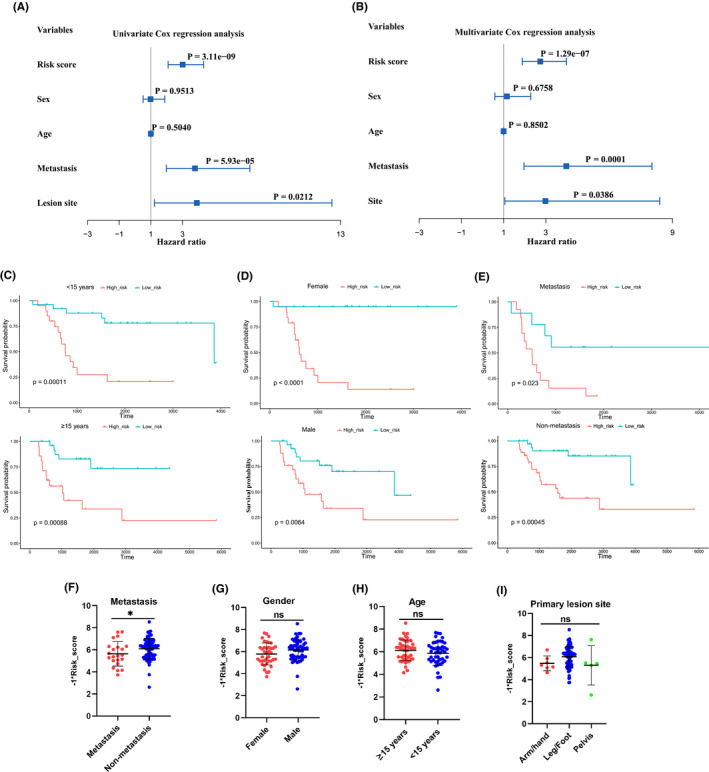
Independence detection of the constructed risk prediction model. A, B, Independent prognostic‐related factors screened out by COX regression analysis. C‐E, Subgroups analysis of survival curve in accordance with different age, sex and metastasis status. F‐I, Subgroups analysis of risk score in accordance with different metastasis status, sex, age, and lesion site
3.4. Verification of the constructed prognostic model based on the GEO dataset
The GEO dataset was used to validate the efficiency of the constructed prognostic model. Patients in the GEO cohort were divided into 2 subgroups based on their risk scores calculated using the constructed prognostic model (Figure 4A). As shown in Figure 4B, the expression levels of the key genes used for model construction in the GEO cohort were presented through a heatmap. In addition, the comparison of tumor tissue scores between the high risk and low risk groups in the GEO cohort was performed, with significant difference found in terms of stromal score (Figure 4C), immune score (Figure 4D), ESTIMATE score (Figure 4E), and tumor purity (Figure 4F). Survival analysis also indicated that patients in the low risk group had a better prognosis than those in the high risk group (Figure 4G). In addition, ROC analysis indicated that the AUC of 1 y, 3 y, and 5 y was 0.756, 0.717, and 0.65, respectively (Figure 4H). These results synergistically demonstrated the prognostic prediction accuracy of the constructed prognostic model.
FIGURE 4.

Validation of the constructed risk prediction model in the verification cohort. A, Distribution of survival status and risk score of osteosarcoma patients in the verification cohort. B, Heatmap visualizing the expression matrix of 12 candidate genes in the verification cohort. C‐G, Comparisons between the high risk and low risk groups in terms of stromal score, immune score, ESTIMATE score, tumor purity, and survival curve in the verification cohort. H, ROC curve of the risk prediction model in the verification cohort
3.5. Construction and validation of the nomogram
To better predict the 5‐y survival rate of osteosarcoma patients, we constructed a nomogram that integrated the prognostic model and clinical determinants, including sex, age, metastasis condition, and tumor site. As shown in Figure 5A, with each item assigned a score based on the actual condition, patients could get a total score for predicting their survival rate within 5 y. Then the prediction accuracy of the constructed nomogram was validated in the TARGET and GEO cohorts. As shown in Figure 5B,C, the blue lines represent the observed survival rate and the gray line represents the optimized survival rate, showing a good fitting between the observed value and optimized value in the training cohort. Similarly, the observed survival rate and optimized survival rate showed a good fitting in the verification cohort (Figure 5D‐E).
FIGURE 5.

Construction and calibration of nomogram. A, Nomogram integrating risk score and clinical characteristics. B, C, calibration of the nomogram at 3‐y and 5‐y survival in the training cohort. D, E, Calibration of the nomogram at 3‐y and 5‐y survival in the verification cohort
3.6. Identification of differentially expressed ferroptosis‐related genes and functional enrichment analysis
The underlying mechanism that the FRGs affected the prognosis of osteosarcoma patients was further detected. The expression levels of genes in the 2 clustered molecular subtypes were firstly compared with screen out DEGs. As shown in Figure 6A, 157 DEGs between the 2 clusters were identified, with 26 genes upregulated and 131 genes downregulated in cluster 2. GO function enrichment analysis indicated that DEGs were enriched in immune‐related BP, such as immune response regulation, complement and coagulation cascades and production of immune‐mediated molecules (Figure 6B,C). In addition, the KEGG enrichment analysis indicated that the DEGs was closely associated with some immune‐related signaling pathways (Figure 6D). The PPI analysis further screened out 3 submodes, which mainly involved immune response and tumor development (Figure 6E). To further identify the expression difference of involved BP, the GSVA enrichment analysis revealed that immune‐related BPs, including antigen presentation and regulation of immune cells, were highly expressed in cluster 1, compared with cluster 2 (Figure 6F). These gene function enrichment analysis synergistically indicated that DEGs were closely associated with immunity disorders in osteosarcoma patients, which may be the underlying mechanism for predicting the prognosis of osteosarcoma patients.
FIGURE 6.

FIGURE Differentially expressed genes analysis and gene function enrichment analyses. A, Volcano plot showing the DEGs between the high risk and low risk groups. B, C, Circle plot and network through Gene Ontology (GO) analysis visualizing the biological processes enriched by DEGs. D, Bubble diagram showing the signaling pathways enriched by DEGs through Kyoto Encyclopedia of Genes and Genomes (KEGG) analysis. E, PPI analysis of DEGs. F, Heatmap illustrating the result of GSVA
4. DISCUSSION
Osteosarcoma has been the most common malignant bone tumor in adults and children, with a strong ability for invasion and metastasis. Currently, many treatment methods have been applied for osteosarcoma patients, including surgery, radiotherapy, chemotherapy, and neoadjuvant chemotherapy. However, due to the features of high malignancy, the overall survival of osteosarcoma patients has been still far away from satisfactory, especially for the advanced osteosarcoma. What is more, some osteosarcoma patients have showed tolerance to traditional chemotherapy drugs, which caused clinical challenges for their treatment. As such, some new treatments targeting tumor development processes, such as tumor cell apoptosis‐promoting agents, antiangiogenic drugs, and immunity therapy, have been applied for osteosarcoma treatment. While the effectiveness and underlying mechanism still remained unclear. Therefore, it was important to make a deeper insight into the molecular pathomechanism related to the genesis and progression of osteosarcoma, which could help us screen out key molecules or biomarkers applied for early diagnosis, targeting therapy, and prognosis analysis of osteosarcoma.
Many traditional anti‐tumor drugs have been developed based on the primary mechanism of apoptosis induction. Although these apoptosis‐induction drugs have made great contributions to improving the overall survival over the past decades, there has increasingly been patients who showed apoptosis‐resistant characteristics. Recently, some studies have indicated that drugs inducing ferroptosis of cancer cells showed great prospects to overcome the dilemma of apoptosis‐induction drug resistance. 17 Ferroptosis is a newly discovered method of programmed cell death that is characterized by iron‐dependent lipid peroxidation. Since the introduction of the concept of ferroptosis in 2012, much research has successively been carried out focusing on the underlying mechanisms and treatment application. The mechanisms playing an important role in the process of ferroptosis mainly involved the production of ROS. The main mechanisms that have been well studied included lipid metabolism disorders, glutathione dysregulation, iron metabolism disorders, and the ferroptosis effector protein 1 (FSP1) pathway in ferroptosis. The excessive accumulation of polyunsaturated fatty acid (PUFA) is an important indicator for ferroptosis. The PUFA accumulation process usually requires both the inhibition of lipid deoxidation, which mainly involves glutathione and FSP1 signaling, 24 , 25 and increase in lipid hyperoxidation, which requires the participation of iron and iron‐incorporating enzymes. 26 The accumulated PUFA eventually results in damage to the cell membrane and cell ferroptosis. Many studies have demonstrated that intracellular ROS levels were closely associated with the biological behaviors of tumor tissues, including tumor genesis, angiogenesis, metastasis, and invasion. 27 Also, researchers have found that some cancer cells with enhanced ability to resist oxidation or adapt to oxidative stress showed a stronger ability for tumor progression and chemoresistance. 19 , 28 As such, much research has investigated the association between ferroptosis and treatment as well as prognosis of various cancers. 17 , 29 However, there have been no studies reported to investigate the relationship between ferroptosis and clinical characteristics among osteosarcoma patients. Therefore, in this study, we constructed a comprehensive prognostic model and also explored the underlying molecular mechanism and signaling regarding the osteosarcoma progression based on multi ferroptosis‐related genes (FRGs). Firstly, we divided the osteosarcoma patients into 2 clusters in accordance with their expression matrix of prognosis‐related ferroptosis genes, with significant difference detected between the 2 clusters in terms of overall survival and immunity status. These analysis results indicated that FRGs were closely related to the prognosis of osteosarcoma patients, which may be due to the immunity difference between the 2 clusters. Then, we further constructed a FRG signature using the TARGET dataset to predict the prognosis of osteosarcoma patients that showed excellent prognosis prediction efficiency and was well validated in the GEO cohort. The FRG signature is comprised of 12 genes: G6PD, PEBP1, PGD, DPP4, SLC39A8, SOCS1, ATG7, ALOX15B, CBS, MYC, EGLN1, and MUC1.
G6PD, full name glucose‐6‐phosphate dehydrogenase, is the main source of nicotinamide adenine dinucleotide phosphate (NADPH). 30 Dysfunction of G6PD would result in the excessive production of ROS and decrease in nitric oxide (NO). 31 In addition, PGD is an important enzyme in the pentose phosphate pathway, which was also associated with the production of NADPH. 32 PEBP1 has been demonstrated to have downregulated expression in various cancers, and PEBP1 deficiency was closely associated with cancer metastases. 33 DPP4, also known as CD26, has been recognized as the marker of cancer stem cells in various cancers, such as colorectal cancer, pancreatic cancer, and lung cancer. 34 SLCA39 has been reported to play important roles in the development of various malignant tumors, such as esophageal cancer, colorectal cancer, prostate cancer, lung cancer, and hepatocellular cancer. 35 In addition, some studies have indicated that SLCA39A8 plays an important role in the regulation of IFN‐γ expression in T cells and is closely associated with the development of hepatocellular carcinoma. 36 , 37 SOCS1 belongs to the SOCS protein family, which is highly specific in controlling the activity of some cytokines. SOCS1 is mainly responsible for negatively regulating the response of myeloid cells to interferon (IFN)‐γ and interleukin (IL)‐4. 38 Decreased SCOS1 expression has been reported to be associated with the development of various cancers, such as hepatocellular carcinoma and prostate cancer. 39 , 40 Autophagy‐related (ATG) genes play a critical role in the process of autophagy, and ATG7 is responsible for the autophagosome formation. Wen Hou and colleagues found that knockdown of ATG7 would limit ferroptosis through decreased intracellular ferrous iron levels and lipid peroxidation. 41 ALOX15B is an arachidonic acid metabolizing enzyme and has been reported to function as a tumor suppressor for prostate cancer and other cancers. 42 CBS has been reported to play an important role in regulating homocysteine metabolism and hydrogen sulfide (H2S) biosynthesis, which is essential for many BPs, including energetics metabolism, protein modification, and so on. 43 Also, some studies have reported that CBS was associated with the tumor growth of some cancers, such as colon and ovarian cancers. 44 MYC is a well‐known oncogene, which plays a critical role in the tumor genesis of various cancers. 45 EGLN1 is the main HIFα prolyl hydroxylase and would experience oxidative self‐inactivation due to the lack of cysteine, which would further increase the HIF1α accumulation. 46 MUC1 is a protein usually located on the top surface of most normal secretory epithelial cells, and the excessive expression of MUC1 in most adenocarcinomas has been reported. 47
The independence of the prognostic model was well demonstrated in the training cohort through univariate cox regression analysis, multivariate cox regression analysis, and subgroup analysis. In addition, we found that the metastasis condition and lesion site were also the independent factors affecting the prognosis of osteosarcoma patients. To better predict the prognosis of osteosarcoma patients, we constructed a nomogram integrating clinical characteristics of osteosarcoma patients, including sex, age, metastasis condition, and lesion site. In this constructed nomogram, the risk score based on the ferroptosis‐related gene signature was the highest weighted score, followed by tumor site and metastasis condition. The prognostic prediction efficiency of the nomogram was well demonstrated both in the training and validation cohorts in terms of 3‐y and 5‐y survival rates, which further demonstrated the prediction efficiency of the prognostic model.
During the process of construction and validation of the prognosis model, we found that osteosarcoma patients with different ferroptosis‐related gene expression matrix showed different immunity status, with better prognosis occurring in the patients with more active immunity status. Increasing understanding of the interaction between immunity and tumor microenvironment have been achieved over the past decades. 48 The tumor microenvironment consisted of cellular components, including immune cells, endothelial cells, and fibroblasts, as well as non‐cellular components, including extracellular matrix, cytokines, and hormones. Immune cells, including innate and adaptive cells, play an important role in affecting tumors’ behaviors and their responses to treatment. 49 In this study, increased immune cells infiltration, such as B cells, T cells and macrophage cells, were found in the high risk group compared with the low risk group. Although there have been studies reporting that increased ferroptosis could enhance the anti‐tumor efficacy of immunotherapy through activating CD8+ T cells, 50 whether FRGs influence the development and progression of osteosarcoma by regulating the immune state of tumor microenvironment still remains unclear. As such, we further performed function analysis to detect the underlying mechanism. Firstly, we screened out DEGs between the 2 subgroups, in accordance with which we further performed GO analysis indicating that many immunity‐related BPs were closely associated with the function of these DEGs. In addition, the heatmap of the GSVA indicated that many immunity‐related BPs were more active in the low risk group than in the high risk group. Also, we performed Gene Set Enrichment Analysis (GSEA) of these DEGs and found their enrichment in the immunity‐related BPs. Recently, some studies have found a very close interaction between ferroptosis and immunity that played a critical role in the genesis, progression, and treatment of various tumors. Wang et al first found that immunotherapy‐activated CD8+ T cells induced the ferroptosis behaviors of ovarian tumor cells, indicating a close connection between ferroptosis and anti‐tumor immunity, 50 and they also found that immunotherapy‐activated CD8+ T cells could induce ferroptosis of human melanoma and fibrosarcoma cells. 51 While the underlying specific mechanism that inducing ferroptosis behaviors of tumor cells enhanced the anti‐tumor immunity responses was unclear. In this study, we also found some clues that ferroptosis affected the immune status of osteosarcoma and therefore the development of osteosarcoma. Although the specific mechanism behind this study requires further clarification, this study could help to provide a new insight into the molecular mechanisms underlying the genesis and development of osteosarcoma, as well as the exploration of potential targeted therapies for osteosarcoma, which would cause significant clinical implications, especially for osteosarcoma patients resistant to conventional chemoradiotherapy.
4.1. Study strength and limits
Despite the treatment advancement of osteosarcoma, the overall 5‐y survival of osteosarcoma patients was still far from satisfactory. What is worse, the resistance to traditional chemotherapy and radiotherapy have aggravated this situation. Ferroptosis is a newly discovered type of cell death that is different from apoptosis. The induction of ferroptosis has been demonstrated to enhance the treatment response of various cancers, while few studies have been carried out to explore the effect of ferroptosis on the development and treatment of osteosarcoma. In this study, we explored the influences of FRGs on the genesis, development of osteosarcoma through comprehensive bioinformatic analysis. We identified 2 molecular subgroups of osteosarcoma patients based on their FRG expression matrix, and the 2 subgroups showed different immune status and prognosis. We also developed a prognosis risk model and further integrated clinical characteristics of osteosarcoma patients to develop a nomogram for better prediction of osteosarcoma patient survival. In addition, we explored the underlying mechanism in the development and treatment of osteosarcoma from the perspective of ferroptosis and immunity. To the best of our knowledge, this is the first bioinformatics study to comprehensively explore the association between ferroptosis and osteosarcoma. The findings of this study could help to optimize the clinical staging of osteosarcoma, and also provide a new perspective and direction for future research on molecular targeted therapy of osteosarcoma. Nevertheless, some limitations of this study should be considered when generalizing the conclusion. First, due to the lack of data availability, it was difficult to integrate some other clinical characteristics in the nomogram, such as the stage of osteosarcoma. Second, in this study, all the results were acquired by bioinformatics analysis, and the lack of experiment validation limited the evidence level of this study. Third, the datasets used in this study were derived from retrospective studies, the low evidence of which also limited the evidence level of this study. Overall, more related studies should be carried out to further explore the association behind ferroptosis and osteosarcoma, which is expected to facilitate the improvement of treatment for osteosarcoma patients.
5. CONCLUSION
In this study, we identified 2 molecular subgroups based on their expression matrix of FRGs through NMF clustering. The 2 molecular subgroups showed significantly different survival and immune status. A prognostic model based on FRGs was developed and its prediction efficiency was well demonstrated. The gene function enrichment analysis showed that FRGs could affect the immune status of the tumor microenvironment, thereby affecting the development and prognosis of osteosarcoma. In conclusion, this study revealed the important role of the interaction between ferroptosis and immunity on the development of osteosarcoma, and could provide a new insight into the exploration of molecular mechanisms and targeted therapies for osteosarcoma.
CONFLICT OF INTEREST
The authors declare that the research was conducted without any commercial or financial relationships that could be construed as a potential conflict of interest.
AUTHOR CONTRIBUTIONS
YH and PL conceived the original ideas of this manuscript and executed supervision throughout the process. TL and HQ performed the data collection, analysis, and prepared tables, figures and manuscript. All authors have read and approved the manuscript.
Supporting information
Fig S1‐S2
Lei T, Qian H, Lei P, Hu Y. Ferroptosis‐related gene signature associates with immunity and predicts prognosis accurately in patients with osteosarcoma. Cancer Sci. 2021;112:4785–4798. 10.1111/cas.15131
Funding information
This study was supported by the Fundamental Research Funds for the Central Universities of Central South University (Grant No. 2021zzts0346), the Science and Technology Innovation Leading Project for High‐tech Industry of Hunan Province (Grant No. 2020SK2008), and the Natural Science Foundation of China (Grant Nos. 81873988 and 82002277).
Contributor Information
Pengfei Lei, Email: pengfeilei@csu.edu.cn.
Yihe Hu, Email: csuyihehu@gmail.com.
DATA AVAILABILITY STATEMENT
The datasets presented in this study can be found in online databases. The names of the databases and accession number(s) can be found in the article.
REFERENCE
- 1. Damron TA, Ward WG, Osteosarcoma SA. Osteosarcoma, chondrosarcoma, and Ewing's sarcoma: national cancer data base report. Clin Orthopaed Rel Res. 2007;459:40‐47. [DOI] [PubMed] [Google Scholar]
- 2. Kumar R, Kumar M, Malhotra K, Patel S. Primary osteosarcoma in the elderly revisited: current concepts in diagnosis and treatment. Curr. Oncol. Rep. 2018;20(2):1‐6. [DOI] [PubMed] [Google Scholar]
- 3. Sajadi KR, Heck RK, Neel MD, et al. The incidence and prognosis of osteosarcoma skip metastases. Clin Orthopaed Rel Res. 2004;426:92‐96. [DOI] [PubMed] [Google Scholar]
- 4. Huang X, Zhao J, Bai J, et al. Risk and clinicopathological features of osteosarcoma metastasis to the lung: a population‐based study. J Bone Oncol. 2019;16: 100230. [DOI] [PMC free article] [PubMed] [Google Scholar]
- 5. Kaste SC, Pratt CB, Cain AM, Jones‐Wallace DJ, Rao BN. Metastases detected at the time of diagnosis of primary pediatric extremity osteosarcoma at diagnosis: imaging features. Cancer. 1999;86(8):1602‐1608. [DOI] [PubMed] [Google Scholar]
- 6. Wu CC, Livingston JA. Genomics and the Immune Landscape of Osteosarcoma. Adv Exp Med Biol. 2020;1258:21‐36. [DOI] [PubMed] [Google Scholar]
- 7. Torti SV, Torti FM. Iron and cancer: more ore to be mined. Nat Rev Cancer. 2013;13(5):342‐355. [DOI] [PMC free article] [PubMed] [Google Scholar]
- 8. Hassannia B, Vandenabeele P, Vanden BT. Targeting ferroptosis to iron out cancer. Cancer Cell. 2019;35(6):830‐849. [DOI] [PubMed] [Google Scholar]
- 9. Forciniti S, Greco L, Grizzi F, Malesci A, Laghi L. Iron metabolism in cancer progression. Int J Mol Sci. 2020;21(6). [DOI] [PMC free article] [PubMed] [Google Scholar]
- 10. Paul BT, Manz DH, Torti FM, Torti SV. Mitochondria and Iron: current questions. Expert Rev. Hematol. 2017;10(1):65‐79. [DOI] [PMC free article] [PubMed] [Google Scholar]
- 11. Muckenthaler MU, Rivella S, Hentze MW, Galy B. A red carpet for iron metabolism. Cell. 2017;168(3):344‐361. [DOI] [PMC free article] [PubMed] [Google Scholar]
- 12. Bystrom LM, Guzman ML, Rivella S. Iron and reactive oxygen species: friends or foes of cancer cells? Antioxid Redox Signal. 2014;20(12):1917‐1924. [DOI] [PMC free article] [PubMed] [Google Scholar]
- 13. Dixon SJ, Lemberg KM, Lamprecht MR, et al. Ferroptosis: an iron‐dependent form of nonapoptotic cell death. Cell. 2012;149(5):1060‐1072. [DOI] [PMC free article] [PubMed] [Google Scholar]
- 14. Angeli JPF, Schneider M, Proneth B, et al. Inactivation of the ferroptosis regulator Gpx4 triggers acute renal failure in mice. Nat Cell Biol. 2014;16(12):1180‐1191. [DOI] [PMC free article] [PubMed] [Google Scholar]
- 15. Jiang X, Stockwell BR, Conrad M. Ferroptosis: mechanisms, biology and role in disease. Nat Rev Mol Cell Biol. 2021;22(4):266‐282. [DOI] [PMC free article] [PubMed] [Google Scholar]
- 16. Cerella C, Grandjenette C, Dicato M, Diederich M. Roles of apoptosis and cellular senescence in cancer and aging. Curr Drug Targets. 2016;17(4):405‐415. [DOI] [PubMed] [Google Scholar]
- 17. Li B, Yang L, Peng X, et al. Emerging mechanisms and applications of ferroptosis in the treatment of resistant cancers. Biomed Pharmacother. 2020;130: 110710. [DOI] [PubMed] [Google Scholar]
- 18. Liu Q, Wang K. The induction of ferroptosis by impairing STAT3/Nrf2/GPx4 signaling enhances the sensitivity of osteosarcoma cells to cisplatin. Cell Biol Int. 2019;43(11):1245‐1256. [DOI] [PubMed] [Google Scholar]
- 19. Harris IS, Treloar AE, Inoue S, et al. Glutathione and thioredoxin antioxidant pathways synergize to drive cancer initiation and progression. Cancer Cell. 2015;27(2):211‐222. [DOI] [PubMed] [Google Scholar]
- 20. Zhang H, Deng T, Liu R, et al. CAF secreted miR‐522 suppresses ferroptosis and promotes acquired chemo‐resistance in gastric cancer. Mol Cancer. 2020;19(1):43. [DOI] [PMC free article] [PubMed] [Google Scholar]
- 21. Yu M, Gai C, Li Z, et al. Targeted exosome‐encapsulated erastin induced ferroptosis in triple negative breast cancer cells. Cancer Sci. 2019;110(10):3173‐3182. [DOI] [PMC free article] [PubMed] [Google Scholar]
- 22. Du X, Zhang Y. Integrated analysis of immunity‐ and ferroptosis‐related biomarker signatures to improve the prognosis prediction of hepatocellular carcinoma. Front Genet. 2020;11: 614888. [DOI] [PMC free article] [PubMed] [Google Scholar]
- 23. Zhu L, Yang F, Wang L, et al. Identification the ferroptosis‐related gene signature in patients with esophageal adenocarcinoma. Cancer Cell Int. 2021;21(1):124. [DOI] [PMC free article] [PubMed] [Google Scholar]
- 24. Maiorino M, Conrad M, Ursini F. GPx4, lipid peroxidation, and cell death: discoveries, rediscoveries, and open issues. Antioxid Redox Signal. 2018;29(1):61‐74. [DOI] [PubMed] [Google Scholar]
- 25. Pryor WA, Porter NA. Suggested mechanisms for the production of 4‐hydroxy‐2‐nonenal from the autoxidation of polyunsaturated fatty acids. Free Radic Biol Med. 1990;8(6):541‐543. [DOI] [PubMed] [Google Scholar]
- 26. Galaris D, Barbouti A, Pantopoulos K. Iron homeostasis and oxidative stress: An intimate relationship. Biochim Biophys Acta Mol Cell Res. 2019;1866(12): 118535. [DOI] [PubMed] [Google Scholar]
- 27. Galadari S, Rahman A, Pallichankandy S, Thayyullathil F. Reactive oxygen species and cancer paradox: to promote or to suppress? Free Radic Biol Med. 2017;104:144‐164. [DOI] [PubMed] [Google Scholar]
- 28. Takahashi N, Chen H‐Y, Harris IS, et al. Cancer cells co‐opt the neuronal redox‐sensing channel TRPA1 to promote oxidative‐stress tolerance. Cancer Cell. 2018;33(6):985‐1003.e7. [DOI] [PMC free article] [PubMed] [Google Scholar]
- 29. Wang H, Cheng Y, Mao C, et al. Emerging mechanisms and targeted therapy of ferroptosis in cancer. Mol Ther. 2021;29(7):2185‐2208. [DOI] [PMC free article] [PubMed] [Google Scholar]
- 30. Leopold JA, Loscalzo J. Oxidative enzymopathies and vascular disease. Arterioscler Thromb Vasc Biol. 2005;25(7):1332‐1340. [DOI] [PubMed] [Google Scholar]
- 31. Leopold JA, Dam A, Maron BA, et al. Aldosterone impairs vascular reactivity by decreasing glucose‐6‐phosphate dehydrogenase activity. Nat Med. 2007;13(2):189‐197. [DOI] [PMC free article] [PubMed] [Google Scholar]
- 32. Ong AJ, Saeidi S, Chi NHK, et al. The positive feedback loop between Nrf2 and phosphogluconate dehydrogenase stimulates proliferation and clonogenicity of human hepatoma cells. Free Radic. Res. 2020;1‐12. [DOI] [PubMed] [Google Scholar]
- 33. Lamiman K, Keller JM, Mizokami A, Zhang J, Keller ET. Survey of Raf kinase inhibitor protein (RKIP) in multiple cancer types. Crit Rev Oncogen. 2014;19(6):455‐468. [DOI] [PubMed] [Google Scholar]
- 34. Varela‐Calviño R, Rodríguez‐Quiroga M, Dias Carvalho P, et al. The mechanism of sitagliptin inhibition of colorectal cancer cell lines' metastatic functionalities. IUBMB Life. 2021;73(5):761‐773. [DOI] [PubMed] [Google Scholar]
- 35. Liu L, Yang J, Wang C. Analysis of the prognostic significance of solute carrier (SLC) family 39 genes in breast cancer. Biosci Rep. 2020;40(8):BSR20200764. [DOI] [PMC free article] [PubMed] [Google Scholar]
- 36. Aydemir TB, Liuzzi JP, McClellan S, Cousins RJ. Zinc transporter ZIP8 (SLC39A8) and zinc influence IFN‐γ expression in activated human T cells. J Leukoc Biol. 2009;86(2):337‐348. [DOI] [PMC free article] [PubMed] [Google Scholar]
- 37. Engelken J, Espadas G, Mancuso FM, et al. Signatures of evolutionary adaptation in quantitative trait loci influencing trace element homeostasis in liver. Mol Biol Evol. 2016;33(3):738‐754. [DOI] [PMC free article] [PubMed] [Google Scholar]
- 38. Wormald S, Hilton DJ. The negative regulatory roles of suppressor of cytokine signaling proteins in myeloid signaling pathways. Curr Opin Hematol. 2007;14(1):9‐15. [DOI] [PubMed] [Google Scholar]
- 39. Bagnyukova TV, Tryndyak VP, Muskhelishvili L, Ross SA, Beland FA, Pogribny IP. Epigenetic down‐regulation of the suppressor of cytokine signaling 1 (Socs1) gene is associated with the STAT3 activation and development of hepatocellular carcinoma induced by methyl‐deficiency in rats. Cell Cycle. 2008;7(20):3202‐3210. [DOI] [PubMed] [Google Scholar]
- 40. Flowers LO, Subramaniam PS, Johnson HM. A SOCS‐1 peptide mimetic inhibits both constitutive and IL‐6 induced activation of STAT3 in prostate cancer cells. Oncogene. 2005;24(12):2114‐2120. [DOI] [PubMed] [Google Scholar]
- 41. Hou W, Xie Y, Song X, et al. Autophagy promotes ferroptosis by degradation of ferritin. Autophagy. 2016;12(8):1425‐1428. [DOI] [PMC free article] [PubMed] [Google Scholar]
- 42. Tang S, Bhatia B, Maldonado CJ, et al. Evidence that arachidonate 15‐lipoxygenase 2 is a negative cell cycle regulator in normal prostate epithelial cells. J Biol Chem. 2002;277(18):16189‐16201. [DOI] [PubMed] [Google Scholar]
- 43. Zhu H, Blake S, Chan KT, Pearson RB, Kang J. Cystathionine β‐synthase in physiology and cancer. Biomed Res Int. 2018;2018:3205125. [DOI] [PMC free article] [PubMed] [Google Scholar]
- 44. Ches' Nique MP, Zatarain JR, Nicholls ME, et al. Upregulation of cystathionine‐β‐synthase in colonic epithelia reprograms metabolism and promotes carcinogenesis. Cancer Res. 2017;77(21):5741‐5754. [DOI] [PMC free article] [PubMed] [Google Scholar]
- 45. Dang CV. MYC on the path to cancer. Cell. 2012;149(1):22‐35. [DOI] [PMC free article] [PubMed] [Google Scholar]
- 46. Briggs KJ, Koivunen P, Cao S, et al. Paracrine induction of HIF by glutamate in breast cancer: EglN1 senses cysteine. Cell. 2016;166(1):126‐139. [DOI] [PMC free article] [PubMed] [Google Scholar]
- 47. Nabavinia MS, Gholoobi A, Charbgoo F, Nabavinia M, Ramezani M, Abnous K. Anti‐MUC1 aptamer: A potential opportunity for cancer treatment. Med Res Rev. 2017;37(6):1518‐1539. [DOI] [PubMed] [Google Scholar]
- 48. Gajewski TF, Schreiber H, Fu YX. Innate and adaptive immune cells in the tumor microenvironment. Nat Immunol. 2013;14(10):1014‐1022. [DOI] [PMC free article] [PubMed] [Google Scholar]
- 49. Wu T, Dai Y. Tumor microenvironment and therapeutic response. Cancer Lett. 2017;387:61‐68. [DOI] [PubMed] [Google Scholar]
- 50. Wang W, Green M, Choi JE, et al. CD8(+) T cells regulate tumour ferroptosis during cancer immunotherapy. Nature. 2019;569(7755):270‐274. [DOI] [PMC free article] [PubMed] [Google Scholar]
- 51. Lang X, Green MD, Wang W, et al. Radiotherapy and immunotherapy promote tumoral lipid oxidation and ferroptosis via synergistic repression of SLC7A11. Cancer Discov. 2019;9(12):1673‐1685. [DOI] [PMC free article] [PubMed] [Google Scholar]
Associated Data
This section collects any data citations, data availability statements, or supplementary materials included in this article.
Supplementary Materials
Fig S1‐S2
Data Availability Statement
The datasets presented in this study can be found in online databases. The names of the databases and accession number(s) can be found in the article.