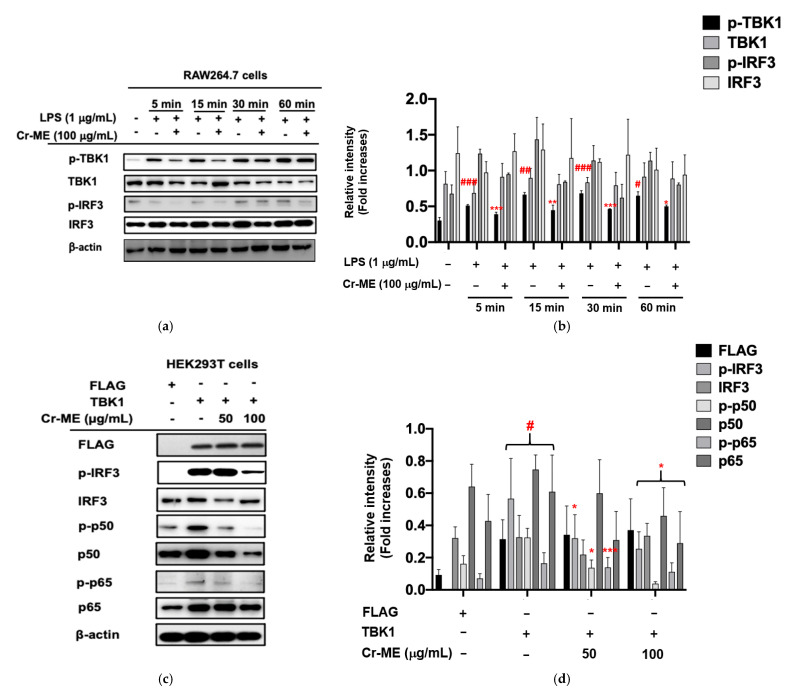
Figure 4.
Effect of Cr-ME on the IRF3 pathway and its upstream enzyme TBK1 activation. (a,b) RAW264.7 cells pretreated with 100 μg/mL of Cr-ME were stimulated by LPS (1 μg/mL) for the indicated times. Then, the phosphorylation levels of TBK1 and IRF3 were detected by Western blotting analysis (a). Relative intensity of these proteins was calculated by ImageJ (b). (c,d) HEK293T cells were transfected with TBK1 along with Cr-ME (50 and 100 μg/mL). Then, the phosphorylation levels of IRF3, p50, and p65 were determined by Western blotting analysis (c). Relative intensity of these proteins was calculated by ImageJ (d). All the data (b,d) expressed as the mean ± SD of three independent experiments. Statistical significance was calculated using one-way ANOVA (Dunnett’s t-test). # p < 0.05, ## p < 0.001, and ### p < 0.001 compared to normal group, and * p < 0.05, ** p < 0.005, and *** p < 0.001 compared to control group.

