

Abstract

To prevent greenhouse emissions into the atmosphere, separations like CO2/CH4 and CO2/N2 from natural gas, biogas, and flue gasses are crucial. Polymer membranes gained a key role in gas separations over the past decades, but these polymers are often not organized at a molecular level, which results in a trade-off between permeability and selectivity. In this work, the effect of molecular order and orientation in liquid crystals (LCs) polymer membranes for gas permeation is demonstrated. Using the self-assembly of polymerizable LCs to prepare membranes ensures control over the supramolecular organization and alignment of the building blocks at a molecular level. Robust freestanding LC membranes were fabricated that have various, distinct morphologies (isotropic, nematic cybotactic, and smectic C) and alignment (planar and homeotropic), while using the same chemical composition. Single gas permeation data show that the permeability decreases with increasing molecular order while the ideal gas selectivity of He and CO2 over N2 increases tremendously (36-fold for He/N2 and 21-fold for CO2/N2) when going from randomly ordered to the highly ordered smectic C morphology. The calculated diffusion coefficients showed a 10-fold decrease when going from randomly ordered membranes to ordered smectic C membranes. It is proposed that with increasing molecular order, the free volume elements in the membrane become smaller, which hinders gasses with larger kinetic diameters (Ar, N2) more than gasses with smaller kinetic diameters (He, CO2), inducing selectivity. Comparison of gas sorption and permeation performances of planar and homeotropic aligned smectic C membranes shows the effect of molecular orientation by a 3-fold decrease of the diffusion coefficient of homeotropic aligned smectic C membranes resulting in a diminished gas permeation and increased ideal gas selectivities. These results strongly highlight the importance of molecular order and orientation in LC polymer membranes for gas separation.
1. Introduction
Over the past century, the average human welfare has increased tremendously due to technological advances resulting in a broad availability of electricity, healthcare, transportation, and food and clean drinking water. However, these technological advances do not come without costs.1 Besides exploitation of earth’s resources, large-scale energy production via incineration of fossil fuels resulted in increasing concentrations of greenhouse gasses (CO2, CH4, N2O) in the atmosphere, leading to global warming. The largest contributing greenhouse gasses CO2 and CH4 are present in valuable gas sources such as natural gas, biogas, or in waste streams like flue gasses. To prevent emission into the atmosphere, separations like CO2/CH4 and CO2/N2 are crucial to minimize pollution.2−5 Moreover, separations of rare gasses such as helium from natural gas (He/CH4 and He/N2) are getting increasingly more important due to the higher global demand and costly production using conventional cryogenic processes.6,7
The polymeric membrane technology decreases the operating and energy costs compared to other separation technologies and therefore gained a key role in gas separation over past decades.8 Other advantages of the use of polymeric membrane technology are milder operating conditions and low ecological footprint compared to other separation technologies, making it a competitive separation technology.6,8,9 Although polymeric membranes are successful and frequently used for gas separations, the used polymers are often not organized at a molecular level, which results in limitations such as poorly defined free volume. These limitations lead to a trade-off between permeability and selectivity, described by Robeson’s upper bound, which limits the performance of current membranes for gas separation.3,8,10−17 The role of supramolecular organization and orientation in the polymer matrix on gas separation performance (permeability and selectivity) is relatively unknown. Understanding the effect of supramolecular organization and orientation could potentially lead to better membranes.
Self-assembly as a bottom-up method can be used to obtain in a wide variety of ordered nanostructures, thereby gaining control over the supramolecular organization and alignment of the building blocks at the molecular level.18−21 There are two classes of materials that are of particular interest to obtain nanostructured polymer membranes based on self-assembly. The first class is block copolymers that consist of two or more distinct homopolymers that are covalently bound to each other, thereby having the ability to self-assemble into various morphologies by micro-phase separation.18,22 For gas separations, block copolymers have been widely investigated for the removal of CO2 from light gasses.18,23 Often one of the blocks in the copolymer is low-molecular-weight poly(ethyleneoxide) due to the favorable interactions of the quadrupole of CO2 with the dipoles of the ether segments.14,23−26
The second class is liquid crystal (LC) polymers that have subnanometer nanostructures by self-assembly of the LC molecular building blocks. The nanostructures are determined by the positional order of the LC monomers like nematic and smectic phases and can differ in orientation. A typical fabrication method to obtain robust, freestanding LC polymer membranes is to induce self-assembly of reactive LC monomers inside an LC cell having alignment layers to control the molecular orientation. Subsequent cross-linking fixates the nanostructures. LC polymer membranes have already been investigated for water filtration.27−40 However, these materials are rarely used for gas separations. Bara et al.10 showed the importance of molecular order for gas separation, by testing the performance of light gasses, of cross-linked LC polymer membranes with an ordered but not aligned columnar morphology. The nanostructured membranes exhibit a slightly lower CO2 permeability but an increase in CO2/N2 and CO2/CH4 selectivity compared to the membranes without molecular order. To the best of our knowledge, there is no additional work reported on this topic.
Here, we study the molecular order and orientation of freestanding thermotropic LC polymer membranes with a lamellar morphology for gas separations of He, Ar, N2, and CO2. Membranes are fabricated with various alignments and molecular order (isotropic, nematic, and smectic), while using the same chemical composition. An LC mixture consisting of a monoacrylate (molecule 1) LC with a crown ether functionality and a smectic diacrylate (molecule 2) cross-linker is aligned and polymerized inside a glass cell with an alignment layer, resulting in robust, freestanding membranes (Figure 3). The single gas permeation performance (permeability, selectivity) of these films for various gasses is studied, and the effect of molecular orientation and order is shown.
Figure 3.
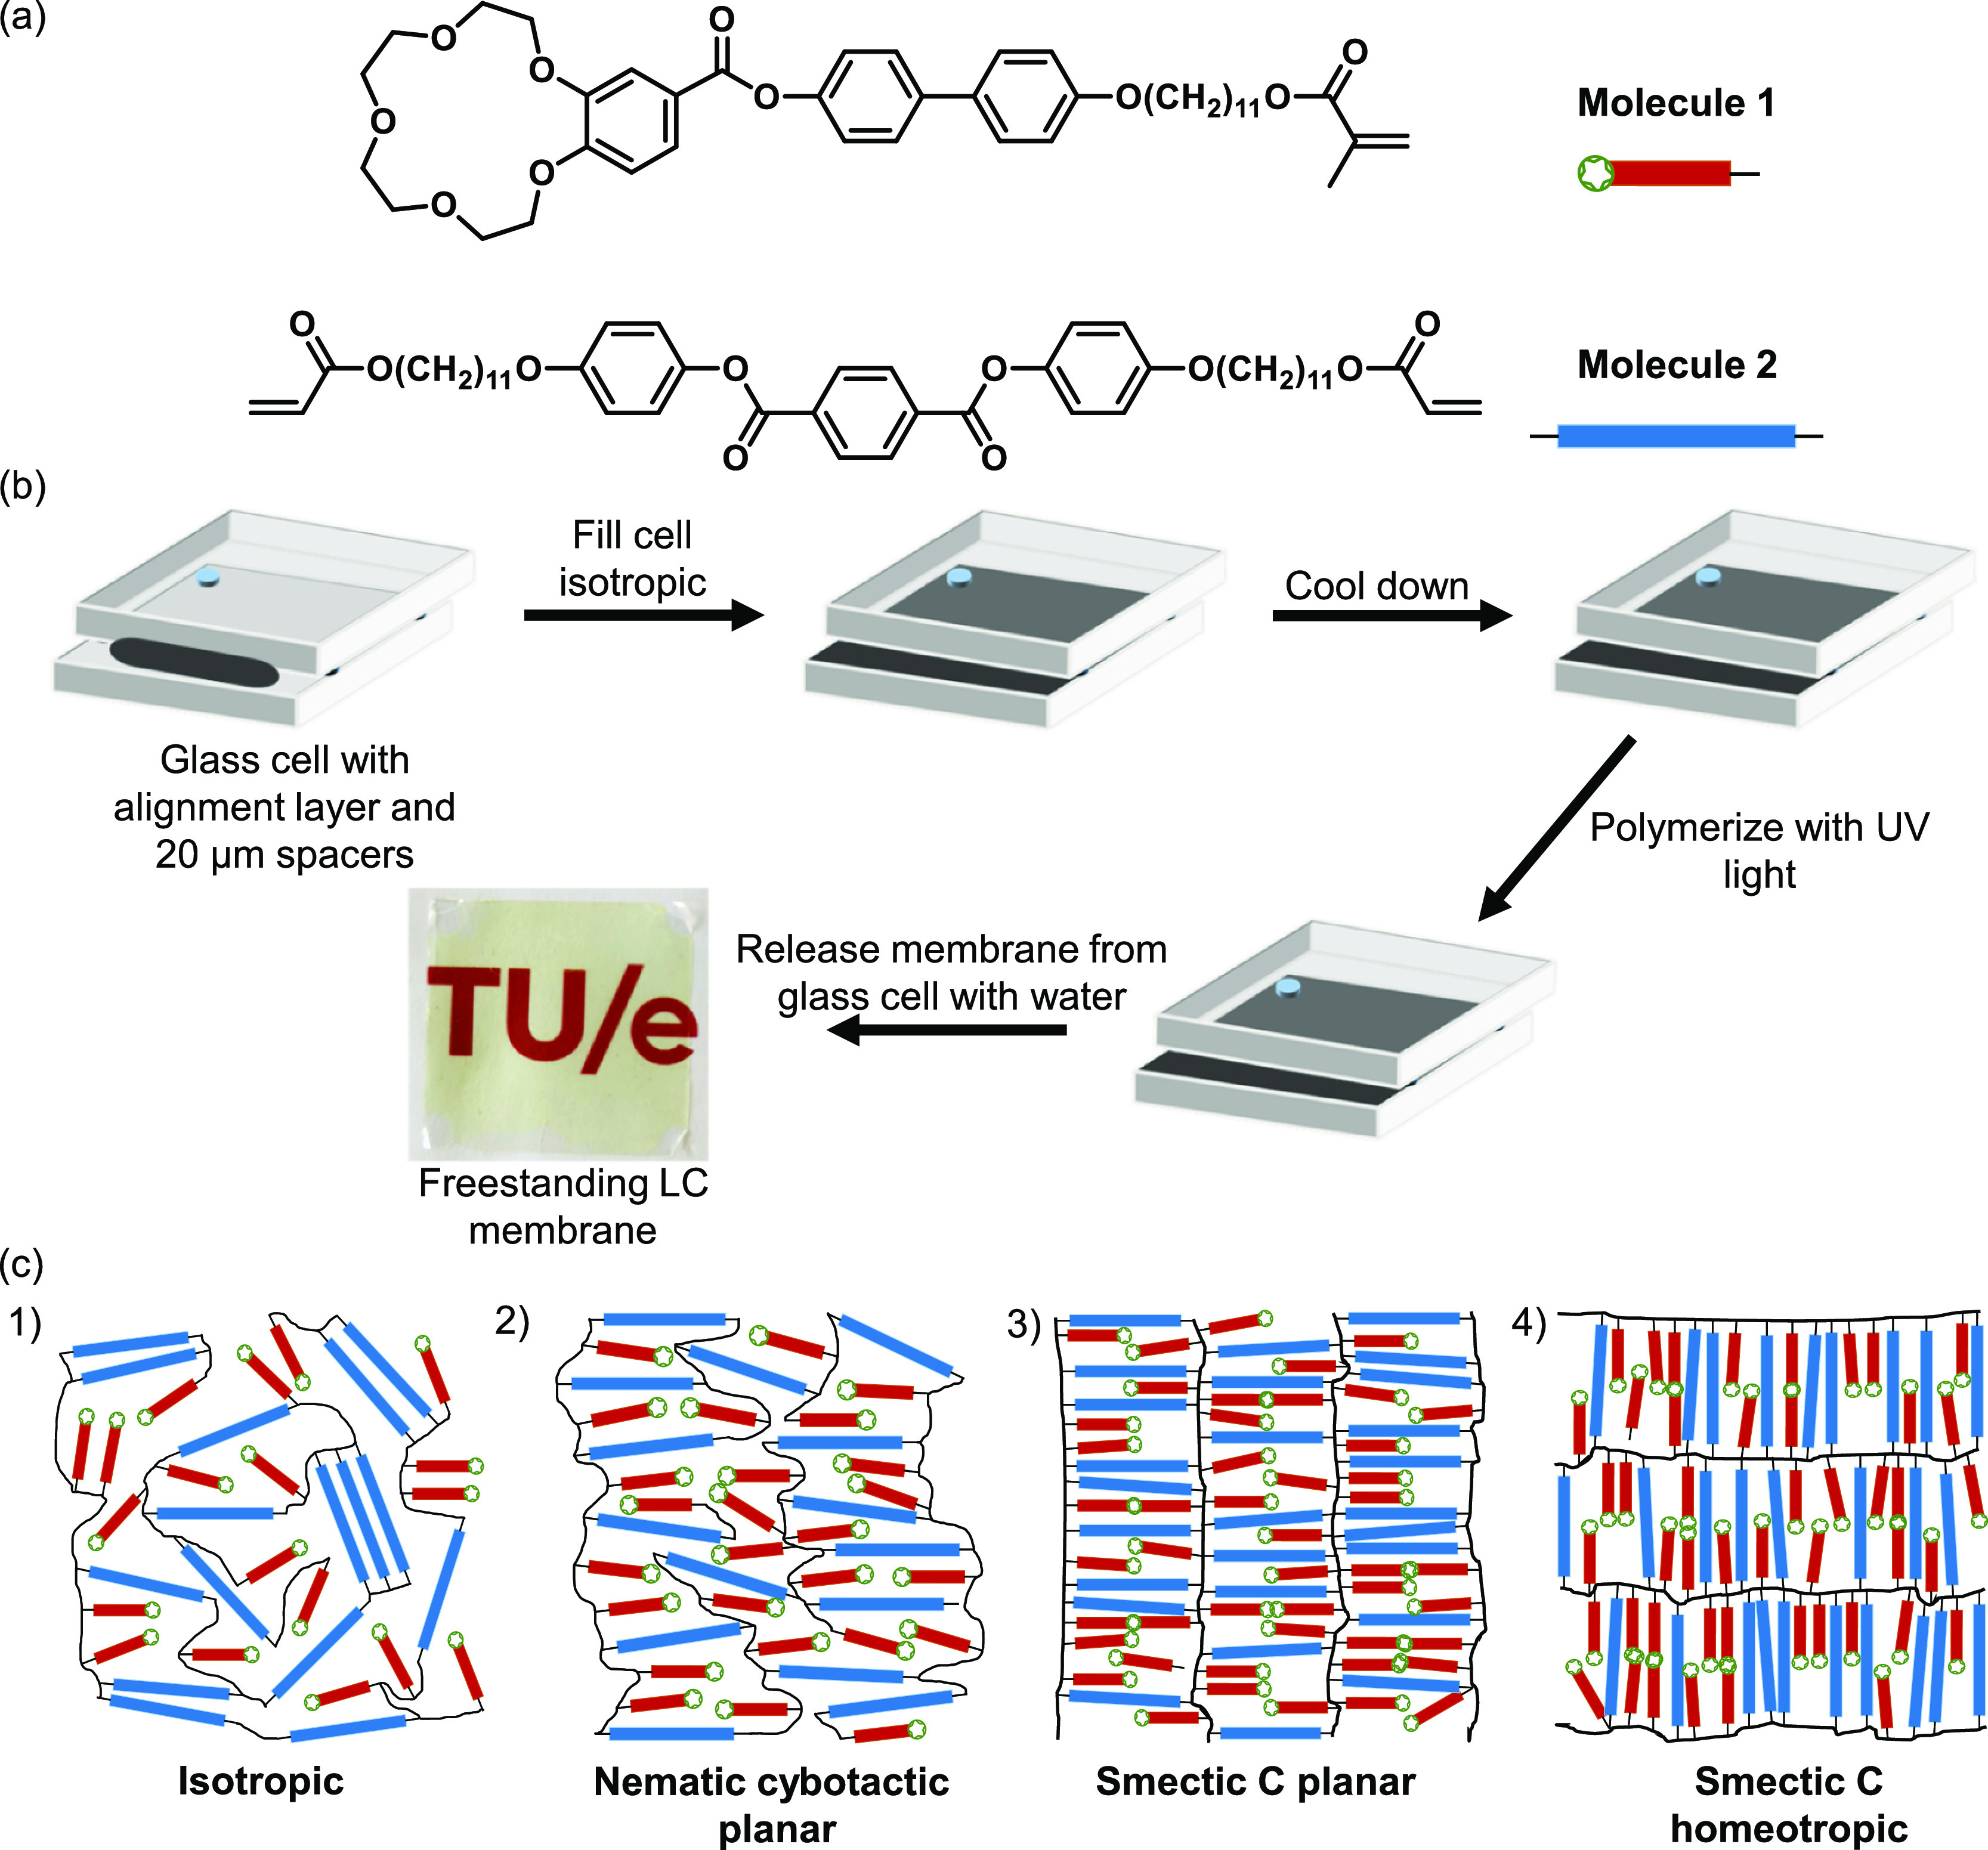
(a) Molecular structures of a monoacrylate crown ether LC (molecule 1, red rods) and diacrylate LC cross-linker (molecule 2, blue rods), which are used in a 1:1 (wt %) ratio for all membranes. (b) Schematic representation of the fabrication process of the LC membranes. (c) Artist impression of freestanding membranes with various morphologies that differ in the degree of molecular order and orientation (cross-sectional area). Note that only the cross section of the freestanding membranes is shown and therefore the smectic C morphology looks similar to a smectic A morphology.
2. Materials and Methods
2.1. Chemicals
11-Bromoundecyl methacrylate30 and 11-(4-hydroxyphenoxy)undecyl acrylate31 were kindly provided by Philips Research. 4,4′-Biphenol, sodium iodide, anhydrous N,N-dimethylformamide, anhydrous chloroform, thionyl chloride, anhydrous tetrahydrofuran (THF), t-butyl-hydroquinone, 4-carboxybenzo-15-crown-5, terephthaloyl chloride, magnesium sulfate, hydrochloric acid (37%), and silica were purchased from Merck Life Science. Potassium carbonate and ethanol were obtained from VWR Chemicals. Chloroform and triethylamine were purchased from Merck KGaA. Dichloromethane and ethyl acetate were obtained from Biosolve. Irgacure 819 was supplied by Ciba. For permeation and sorption measurements, the gasses He (5.0 grade), CO2 (4.5 grade), N2 (5.0 grade), and Ar (5.0 grade) were purchased from Linde gas (the Netherlands). All reagents were used as received, without further purification.
2.2. Synthesis of Molecule 1 and Intermediates
2.2.1. 11-((4′-Hydroxy-[1,1′-biphenyl]-4-yl)oxy)undecyl Methacrylate
Synthesis of 11-((4′-hydroxy-[1,1′-biphenyl]-4-yl)oxy)undecyl methacrylate was based on the methods described before.32 11-Bromoundecyl methacrylate (2.3 g, 7.2 mmol), 4′,4-biphenol (2.5 g, 13.5 mmol), potassium carbonate (3.0 g, 22 mmol), and sodium iodide (0.2 g, 1.4 mmol) were added to a flask with a condenser. The system was dried with three cycles of vacuum/argon, after which the compounds were dissolved in 30 mL of anhydrous N,N-dimethylformamide. The reaction mixture was stirred for 16.5 h at 50 °C, followed by filtration and evaporation of the N,N-dimethylformamide by rotary evaporation. The resulting solid was dissolved in 100 mL of chloroform and filtered. Subsequently, the chloroform of the collected filtrate was evaporated by rotary evaporation and the resulting solid was purified using column chromatography (dry loading, dichloromethane as eluent), yielding the final product as a white solid with a yield of 45%.
1H NMR (400 MHz, chloroform-d) δ 7.45 (d, J = 8.7 Hz, 2H), 7.42 (d, J = 8.6 Hz, 2H), 6.95 (d, J = 8.8 Hz, 2H), 6.89 (d, J = 8.6 Hz, 2H), 6.10 (s, J = 1.4 Hz, 1H), 5.55 (p, J = 1.6 Hz, 1H), 5.05 (s, 1H), 4.14 (t, J = 6.7 Hz, 2H), 4.00 (t, J = 6.6 Hz, 2H), 1.95 (t, J = 1.3 Hz, 3H), 1.79 (m, 2H), 1.69 (m, 2H), 1.48 (m, 2H), 1.41–1.27 (m, 12H). 13C NMR (101 MHz, CDCl3) δ 167.70, 158.26, 154.67, 136.53, 133.70, 133.23, 127.92, 127.66, 125.26, 115.59, 114.76, 68.11, 64.92, 29.55, 29.50 (2C), 29.40, 29.31, 29.25, 28.61, 26.07, 25.99, 18.35.
2.2.2. 4′-Acylchloride-benzo-15-crown-5
Synthesis of 4′-acylchloride-benzo-15-crown-5 was based on the methods described before.41 4-Carboxybenzo-15-crown-5 (0.766 g, 2.45 mmol) was added to a flask and dried with three cycles of vacuum/argon. Subsequently, 15 mL of anhydrous chloroform was added followed by slow addition of thionyl chloride (1.0 mL, 13.8 mmol). The resulting suspension was stirred for 3 h at room temperature, after which the solvent and excess thionyl chloride were removed under vacuum. The conversion of the resulting acylchloride was checked with attenuated total reflection Fourier transform infrared (ATR FT-IR) spectroscopy, showing good conversion. ATR FT-IR (cm–1): 2895 (C–H stretch, Ar.), 1742 (C=O stretch acylchloride), 1586 (C–C stretch Ar.), 1511, 1420, 1350, 1254 (C–O stretch ether), 1131, 747 (C–Cl stretch).
2.2.3. 4-((11-Methacryloylundecan-1-yl)oxy)-4′-(4′-carboxybenzo-15-crown-5)biphenyl (Molecule 1)
Synthesis of 4-((11-methacryloylundecan-1-yl)oxy)-4′-(4′-carboxybenzo-15-crown-5)biphenyl (molecule 1) was based on the methods described before (see Figure 1 for reaction scheme).41 Triethylamine (0.34 mL, 2.35 mmol) was added dropwise over a time span of 5 min to a solution of 4′-acylchloride-benzo-15-crown-5 (1.077 g, 2.35 mmol) and 11-((4′-hydroxy-[1,1′-biphenyl]-4-yl)oxy)undecyl methacrylate (1.0 g, 2.35 mmol) in 5 mL of anhydrous tetrahydrofuran cooled in an ice bath under argon atmosphere. After 1 h, the ice bath was removed and stirring was continued for 16 h at room temperature, after which the THF was evaporated. The remaining product was dissolved in 8 mL of chloroform and subsequently precipitated with 5 mL of ethanol. The precipitate was filtered and dried, yielding molecule 1 as a white powder with a yield of 62%.
Figure 1.

Reaction scheme of 4-((11-methacryloylundecan-1-yl)oxy)-4′-(4′-carboxybenzo-15-crown-5)biphenyl (molecule 1).
1H NMR (400 MHz, chloroform-d) δ 7.85 (dd, J = 8.4, 2.0 Hz, 1H), 7.68 (d, J = 2.1 Hz, 1H), 7.59 (d, J = 8.6 Hz, 2H), 7.50 (d, J = 8.7 Hz, 2H), 7.23 (d, J = 8.6 Hz, 2H), 6.96 (d, J = 8.7 Hz, 2H), 6.94 (d, J = 8.5 Hz, 1H), 6.10 (s, 1H), 5.55 (q, J = 1.7 Hz, 1H), 4.23 (m, 4H), 4.14 (t, J = 6.7 Hz, 2H), 4.00 (t, J = 6.6 Hz, 2H), 3.95 (m, 4H), 3.78 (d, J = 2.6 Hz, 8H), 1.94 (d, J = 1.2 Hz, 3H), 1.81 (m, 2H), 1.69 (m, 2H), 1.47 (p, J = 6.8 Hz, 2H), 1.42–1.25 (m, 12H). 13C NMR (101 MHz, CDCl3) δ 167.57, 165.01, 158.76, 153.78, 149.97, 148.62, 138.59, 136.57, 132.78, 128.10, 127.69, 125.14, 124.80, 122.07, 121.98, 114.96, 114.81, 112.09, 71.20 (2C), 70.42, 70.32, 69.40, 69.26, 69.09, 68.65, 68.10, 64.85, 29.55, 29.50 (2C), 29.40, 29.30, 29.25, 28.62, 26.07, 25.99, 18.35. ATR FT-IR (cm–1): 2900 (C–H stretch), 2345, 1725 (C = O ester), 1597 (C–C stretch Ar.), 1500, 1431, 1277 (C–O stretch), 1205 (C–O stretch), 1143, 1058, 961. HRMS (MALDI-TOF): [M + Na]+ calcd for C42H54O10Na: 741.36; found: 741.30.
2.3. Synthesis of Molecule 2
2.3.1. Bis(4-((11-(acryloyloxy)undecyl)oxy)phenyl)terephthalate (Molecule 2)
Triethylamine (15.2 mL, 110 mmol) was added dropwise to a solution of 11-(4-hydroxyphenoxy)undecyl acrylate (33.1 g, 100 mmol) and terephthaloyl chloride (10.1 g, 50 mmol) in 200 mL of dichloromethane cooled in an ice bath under a nitrogen atmosphere. Stirring was continued for one night at room temperature, after which the solution was extracted subsequently with 100 mL of an aqueous 1M HCl solution and 200 mL of brine and dried over magnesium sulfate. The crude product was obtained after filtration over a thin silica pad followed by evaporation. Molecule 2 (29.1 g, 73% yield) was obtained as white crystals after recrystallization from 300 mL of ethyl acetate (see Figure 2 for reaction scheme).
Figure 2.

Reaction scheme of bis(4-((11-(acryloyloxy)undecyl)oxy)phenyl)terephthalate (molecule 2).
1H NMR (400 MHz, chloroform-d) δ 8.31 (s, 4H), 7.14 (d, J = 9.0 Hz, 4H), 6.94 (d, J = 9.0 Hz, 4H), 6.40 (dd, J = 17.4, 1.5 Hz, 2H), 6.12 (dd, J = 17.3, 10.4 Hz, 2H), 5.81 (dd, J = 10.4, 1.5 Hz, 2H), 4.15 (t, J = 6.7 Hz, 4H), 3.97 (t, J = 6.5 Hz, 4H), 1.79 (m, 4H), 1.67 (m, 4H), 1.46 (m, 4H), 1.41–1.25 (m, 24H). 13C NMR (101 MHz, CDCl3) δ 166.35, 164.69, 157.10, 144.02, 133.96, 130.43, 130.21, 128.66, 122.25, 115.17, 68.44, 64.72, 29.54, 29.50 (2C), 29.38, 29.27, 29.25, 28.63, 26.05, 25.93. HRMS (MALDI-TOF): [M + Na]+ calcd for C48H62O10Na: 821.42; found: 821.48.
2.4. Membrane Preparation
An LC mixture consisting of 49.7 wt % molecule 1, 49.7 wt % molecule 2, 0.5 wt % photoinitiator (Irgacure 819), and 0.1 wt % inhibitor (tert-butylhydroquinone, TBHQ) was prepared by dissolving the compounds in a minimum amount of chloroform and subsequently evaporating the solvent. The membranes with a thickness of 20 μm were prepared by heating the LC mixture to the isotropic phase at 130 °C and performing capillary suction between two glass plates equipped with 20 μm spacers to fill the glass cells. To obtain planar alignment, the glass plates were functionalized with a rubbed polyimide layer (Optimer AL 1254; JSR Corporation, Toyo Japan). After the glass cells were filled, the samples were placed inside a temperature-controlled N2 box, in which the samples were cooled from 130 °C to the desired temperature (130, 114, and 104 °C for isotropic, nematic, and smectic morphologies, respectively) with a cooling rate of 1 °C/min. Subsequently, the samples were polymerized by exposing the samples for 10 min to an unfiltered spectrum of a collimated EXFO Omnicure S2000 UV lamp with a light intensity of 20 mW/cm2 in the range of 320–390 nm. The glass cells were opened by immersing the samples in hot water (80 °C) for 10 min to obtain the freestanding membranes. For homeotropic alignment, Nissan polyimide sunever (Nissan Chemical Industries Ltd.) functionalized glass cells were used and the membranes were similarly processed as the planar aligned membranes described before.
2.5. Characterization
Nuclear magnetic resonance (NMR) spectra were recorded at room temperature on a Bruker FT-NMR spectrometer AVANCE III HD-Nanobay (400 MHz, Bruker Ultrashield magnet, BBFO Probehead, BOSS1 shim assembly) in deuterated chloroform. Chemical shifts are given in ppm with respect to tetramethylsilane (TMS, 0 ppm) as internal standard.
Matrix-assisted laser desorption/ionization time-of-flight mass spectrometry (MALDI-TOF MS) was performed on a Bruker Autoflex Speed MALDI-MS instrument using 2-[(2E)-3-(4-tert-butylphenyl)-2-methylprop-2-enylidene]malononitril (DCTB) as matrix.
Attenuated total reflection Fourier transform infrared (ATR FT-IR) spectra were recorded at room temperature on a Varian Cary 3100 FT-IR spectrometer equipped with a golden gate attenuated total reflectance (ATR) sampling accessory. Scans were taken over a range of 4000–650 cm–1, with a spectral resolution of 4 cm–1 and 50 scans per spectrum.
Polarizing optical microscopy (POM) was performed using a Leica DM 2700M optical microscope equipped with two polarizers that were operated either crossed or parallel to the sample in between a Linkam hot-stage THMS600 with a Linkam TMS94 controller and a Leica DFC420 C camera.
Differential scanning calorimetry (DSC) measurements were recorded in hermetic T-zero aluminum sample pans using a TA Instruments Q2000 DSC equipped with cooling accessory. The DSC measurements were performed with three cycles of heating and cooling at a rate of 1 °C/min with isothermal equilibration for 3 min after each heating or cooling ramp. The transition temperatures were determined from the third heating and cooling cycle using TRIOS DSC software.
Medium- and wide-angle X-ray scattering (MAXS/WAXS) measurements were recorded on a GaneshaLab instrument equipped with a Genix-Cu ultralow divergence source producing X-ray photons of wavelength 1.54 Å and a flux of 108 photons per second. Diffraction patterns were collected on a Pilatus 300 K silicon pixel detector with 487 × 619 pixels of 172 μm2.
2.6. Gas Sorption
Gas sorption of N2 and CO2 was performed at 6 bar and 20 °C for all membranes with a Rubotherm series IsoSORP sorption instrument to determine the solubility coefficient (cm3 STP/(cm3·cmHg)) for both gasses. The equipment uses a magnetically suspended balance to measure the sorbed weight of the gas. Prior to each sorption measurement, a buoyancy measurement with helium was performed to determine the initial sample weight and volume. Here, an assumption was made that the solubility of helium is negligible. With the obtained sample weight and volume from the buoyancy measurement with helium, the measured sorbed weight is corrected using eq 1.
| 1 |
In eq 1, mcorrected is the corrected weight (g), mmeasured is the measured weight (g), ρgas is the density of the measuring gas (g/cm3), and Vsample the sample volume (cm3). With the corrected sorbed weight, the concentration of the measuring gas (N2 or CO2) was calculated at 6 bar and 20 °C using eq 2.
| 2 |
In eq 2, Ci (cm3 (STP)/cm3 polymer) is the concentration of gas in the membrane, ρs (g/cm3) is the density of the membrane, and ρi (STP) (g/cm3) is the density of measuring gas at standard temperature and pressure (STP = 273.15 K and 1.013 bar). The solubility coefficient of N2 and CO2 in the membranes was calculated using eq 3.
| 3 |
In eq 3, S is the gas solubility (cm3 STP/(cm3·cmHg)), Ci is the concentration gas adsorbed (cm3 (STP)/cm3), and P is the pressure (cmHg).
2.7. Single Gas Membrane Performances
Gas permeation experiments using He, Ar, N2, and CO2 were performed in a stainless steel cell with a permeation area of 2.1 cm2. The flat sheet membranes were supported by a Whatman filter paper (Grade 50 with a pore size of 2.7 μm) to provide additional mechanical support. The single gas permeability of the membranes was determined using eq 4, at 20 °C in duplicate by measuring the permeate pressure increase over time in a calibrated volume with a feed pressure of 6 bar and vacuum at the permeate side (ΔP = 7 bar).
| 4 |
In eq 4, Pi is the permeability of gas species i (Barrer), ΔPpermeate is the increase in permeate pressure (Pa) per time interval Δt (s), Vc is the calibrated permeate volume (m3), Vm is the molar volume at STP (cm3/mol), L is the membrane thickness (cm), R is the gas constant (J/K·mol), T is the permeate temperature (K), A is the membrane area (cm2), and ΔP is the transmembrane pressure (cmHg). Before each single gas permeation measurement, the membranes were conditioned for at least 1 h with the gas to be measured. First, He permeation was measured, followed by Ar and N2. CO2 permeation measurements were performed last, since CO2 could induce swelling of the membrane. The ideal selectivity of gas species i with respect to gas species j, αi/j, was calculated with eq 5.
| 5 |
The N2 and CO2 diffusion coefficients of the LC membranes were calculated using eq 6.
| 6 |
In eq 6, D is the diffusion coefficient (cm2/s), P is the permeability (Barrer), and S is the solubility coefficient (cm3 STP/(cm3·cmHg)).
3. Results and Discussion
3.1. Synthesis and Characterization of Molecules 1 and 2
A photopolymerizable nematic monoacrylate (molecule 1) and a smectic diacrylate (molecule 2) were selected and synthesized to fabricate membranes with various morphologies and alignments, while using the same chemical composition (Figure 3a). Molecule 1 was selected for its crown ether moiety, from which it is known that the cyclic oligoethylene oxide segment has favorable interactions with CO2. Molecule 2 was synthesized to improve the mechanical strength of the fabricated membranes, and it was expected that undecyl side chains would enlarge and stabilize the smectic lamellar phase.42
Molecule 1 was synthesized and characterized following a literature procedure (Figure 1 for reaction scheme).41 Intermediate product (4) and molecule 1 were characterized by 1H and 13C nuclear magnetic resonance (NMR) and are in accordance with literature values (Figures S1 and S2). Moreover, mass spectroscopy (MALDI-TOF) and attenuated total reflection Fourier transform infrared (ATR FT-IR) spectroscopy showed the successful synthesis of molecule 1 (Figure S3). The phase behavior of molecule 1 was determined with differential scanning calorimetry (DSC) and polarizing optical microscopy (POM) (Figure S4). DSC revealed upon cooling an isotropization temperature of 117 °C, which is in accordance with the literature (114 °C). Upon further cooling, molecule 1 exhibits a nematic phase at 116 °C and crystallizes at 99 °C.
Molecule 2 was synthesized for the first time by the addition elimination reaction between intermediate terephthaloyl chloride (7) and 11-(4-hydroxyphenoxy)undecyl acrylate (8) (Figure 2 for reaction scheme). Characterization by 1H NMR and 13C NMR and MALDI-TOF confirmed the successful formation of molecule 2 (Figure S5). The phase transitions of molecule 2 were determined with DSC and POM (Figure S6). DSC revealed upon cooling an isotropization temperature of 132 °C. Further cooling shows a nematic phase between 132 and 131 °C, a smectic phase between 131 and 116 °C, and crystallization at 115 °C.
An LC mixture consisting of molecule 1 and molecule 2 (in a set ratio of 1:1 in wt %), a photoinitiator, and an inhibitor was prepared and characterized with DSC and POM to determine the phase transitions (Figure S7). DSC revealed an isotropization temperature of 118 °C. Upon cooling, the LC mixture shows a nematic phase at 117 °C, a smectic phase at 108 °C, and crystallizes at 100 °C, elucidating that this specific LC mixture can be used to prepare membranes with isotropic, nematic, and smectic morphologies.
3.2. Preparation and Characterization of Liquid Crystalline Membranes
Membranes were prepared by incorporating the LC mixture in glass cells having different alignment layers to control the orientation (Figure 3b). The LC mixture was polymerized at 130, 114, and 104 °C for isotropic, nematic, and smectic orders, respectively, and after opening of the cells, freestanding membranes were obtained (see Figure 3c for an artist impression of the freestanding membranes with various morphologies that differ in molecular order and orientations). FT-IR spectra confirmed full conversion of the acrylate moieties (Figure S8).
The alignment and organization of the polymerized membranes were investigated with POM (Figure S9). Membranes with a planar alignment show dark images under parallel conditions and bright images under 45° tilt, revealing birefringent polymer membranes. Homeotropically aligned membranes showed dark gray images for all angles. This indicates that the membranes are well aligned. Wide-angle X-ray scattering (WAXS) and medium-angle X-ray scattering (MAXS) were employed to further investigate the alignment and morphology of the membranes (Figure 4).
Figure 4.

WAXS (top row) and MAXS (bottom row) spectra of membranes with different molecular alignments and orientations. (a, e) Membranes polymerized at 130 °C representing a randomly oriented (isotropic) morphology. (b, f) Membranes polymerized at 114 °C representing a planar aligned nematic cybotactic morphology. (c, g) Membranes polymerized at 104 °C representing a planar aligned smectic C morphology. (d, h) Membranes polymerized at 104 °C representing a homeotropic aligned smectic C morphology. The single arrow shows the alignment direction.
The two-dimensional (2D) WAXS and MAXS spectra (Figure 4a,e) of the membranes that were polymerized at 130 °C show full diffuse circles in the wide- and medium-angle regions. The full circle in the wide-angle region corresponds to randomly oriented LC molecules, which is characteristic for an isotropic morphology. However, the presence of two full circles in the MAXS (Figure 4e) indicates that the isotropic membranes contain randomly oriented layered structures, which corresponds to a smectic morphology. These randomly oriented layered structures were not expected because the membranes were fabricated well above the isotropization temperature. Moreover, POM images of the membranes fabricated at 130 °C show dark images at all angles, indicating an isotropic morphology. Combining the POM and XRD data makes it likely that the membranes fabricated at 130 °C have an isotropic morphology with randomly oriented smectic domains in the nanometer scale that are therefore not visible with POM (Figure 3c1 illustrates the cross section of an isotropic bulk morphology with randomly oriented smectic domains). Figure 4b,f shows the WAXS and MAXS spectra of membranes that were polymerized at 114 °C, respectively. Both WAXS and MAXS contain diffraction spots instead of full circles, which indicates that all molecules are oriented into a common direction. In addition, the MAXS spectrum in Figure 4f shows two spots parallel to the alignment direction, which would correspond to an ordered planar smectic A morphology. However, from the absence of smectic features in the POM, it is concluded that these membranes have an ordered nematic morphology that contains localized, fluctuating regions of smectic domains in the nanometer scale (Figure 3c2 illustrates the cross section of a planar nematic bulk morphology with smectic domains). This so-called nematic cybotactic phase is known to appear close to the nematic–smectic transition.43,44Figure 4g shows the MAXS of membranes that were polymerized in a planar manner at 104 °C. The MAXS shows splitting of the two centered spots, which corresponds to an ordered smectic C morphology that consists of a tilted layered structure with a tilt angle of 23° (Figure 3c3 illustrates the cross section of a planar smectic C morphology). Moreover, a layer spacing of 4.6 nm that corresponds to the distance between two layers was determined. The determined layer spacing is in close approximation with the theoretical layer spacing of molecule 2 (4.99 nm), which is expected to mainly determine the layer spacing as it is connecting the layered structures. The small discrepancy between the experimentally determined and theoretical layer spacing can be explained by the fact that the flexible alkyl chain of molecule 2 can be folded, leading to a slightly lower value. Contrary to the WAXS and MAXS spectra of planar aligned smectic C membranes, homeotropic aligned smectic C membranes in Figure 4d,h show no diffraction spots in the medium-angle region due to the fact that the X-ray beam is parallel to the LC molecules but only show a full diffuse circle in the wide-angle region (Figure 3c4 illustrates the cross section of a homeotropic smectic C morphology).37 The intermolecular spacing that corresponds to the intermolecular stacking of the LC building blocks was found to be 0.43–0.44 nm for all morphologies and orientations. The above confirms the formation of the different nanostructured membranes as presented in Figure 3c.
3.3. Effect of Molecular Order on Single Gas Performances
The effect of molecular order on gas permeation performance was investigated by measuring single gas permeation of He, Ar, N2, and CO2 in membranes with isotropic, planar nematic cybotactic, and planar smectic C morphologies. The permeation data are shown in Figure 5 (see Table S1 for permeation values).
Figure 5.

Single gas permeability (He, CO2, Ar, and N2) of membranes with, respectively, isotropic, nematic cybotactic, and smectic C morphologies at 20 °C and 6 bar feed pressure.
Figure 5 shows that the permeability of all gasses decreases when going from a randomly ordered (isotropic) to a highly ordered smectic C morphology. Helium has the highest permeability for all membranes, while the membranes with isotropic and nematic cybotactic morphologies have relatively similar permeabilities for CO2, Ar, and N2. Oppositely, the permeability of membranes with the smectic C morphology decreases tremendously for Ar and N2 (22-fold for Ar and 67-fold for N2) compared to He and CO2 (3-fold for He and 4-fold for CO2). To visualize the effect of molecular order on gas separation performance, the ideal gas selectivities were calculated from these permeation data, and the selectivities of the three most important gas pairs (He/N2, CO2/N2, and He/CO2) are shown in Figure 6 (see Table S2 for all gas pairs).
Figure 6.

Ideal gas selectivities (CO2/N2, He/CO2, He/N2) of membranes with, respectively, isotropic, nematic cybotactic, and smectic C morphologies at 20 °C.
Figure 6 shows that isotropic membranes exhibit almost no selectivity toward a specific gas species, and only a slight selectivity increase for all gas pairs is observed for the nematic cybotactic morphology. However, selectivities toward He and CO2 increase tremendously (24-fold for He/N2 and 18-fold for CO2/N2) for the highly ordered smectic C morphology. The difference in gas permeability and selectivity between the nematic cybotactic and smectic C membranes is considerable and most likely originates from the difference in molecular order. As shown in Section 3.2, the nematic cybotactic membranes have a less ordered nematic bulk that contains localized, more ordered smectic domains. For gas separation, this means that permeation will mainly occur through the less ordered nematic bulk of these membranes. The smectic C membranes have an ordered smectic C bulk and permeation occurs through the smectic bulk, which results in a lower gas permeability. These permeation results can be further explained by the effect of a combination of parameters being kinetic diameter, molecular weight, critical temperature, free volume, and molecular interactions via the quadrupole moments of the gasses. These parameters are presented in Table 1.45
Table 1. Kinetic Diameter, Molecular Weight, Quadrupole Moment, and Critical Temperature of Various Gas Species45.
| gas species | kinetic diameter [nm] | molecular weight [g/mol] | quadrupole moment [cm2] ×1040 | critical temperature [K] |
|---|---|---|---|---|
| He | 0.26 | 4.00 | 0.00 | 5.19 |
| CO2 | 0.33 | 44.01 | –13.71 | 304.13 |
| Ar | 0.34 | 39.94 | 0.00 | 151.00 |
| N2 | 0.36 | 28.01 | –4.91 | 126.20 |
As the fabricated membranes can be considered dense, the mechanism of permeation is best described by the solution-diffusion model.46 Dense membranes separate gasses via their intrinsic differences in solubility and diffusivity. Irrespective of the molecular structure and orientation of the membrane, some general considerations can be given. Helium has the smallest kinetic diameter and lowest molecular weight of all measured gasses, leading to a higher diffusion rate through the membrane, resulting in the highest permeability of all gasses.47 N2 has a lower molecular weight than CO2 and Ar, but this is accompanied by the largest kinetic diameter of all measured gasses. Combined with its low solubility into the polymer matrix due to its low critical temperature (see Section 2.6 and Table 2), this results in a lower N2 permeability than for He. CO2 and Ar have similar kinetic diameters and molecular weights, but CO2 has a higher critical temperature, which results in a higher solubility into the polymer matrix.48 In addition, the CO2 solubility is expected to be enhanced due to favorable interactions of the quadrupole of CO2 with the dipole moments of the crown ethers.14,48
Table 2. CO2 Permeabilities, Solubility Coefficients Measured at 6 Bar and 20 °C and the Associated Calculated Diffusion Coefficients of LC Membranes with, Respectively, Isotropic, Nematic Cybotactic, and Smectic C Morphologies.
| morphology | P | S | D | ||
|---|---|---|---|---|---|
| isotropic | 3.49 | 0.01204 | 29.00 | ||
| nematic cybotactic planar | 1.46 | 0.01201 | 12.20 | ||
| smectic C planar | 0.37 | 0.01198 | 3.05 |
For both the isotropic and nematic cybotactic LC membranes (Figure 3c1,2), the permeabilities of CO2, Ar, and N2 are relatively equal for the same membranes. This suggests that the differences in solubility and diffusivity between the gasses cancel each other out while permeating the membrane. Based on the high critical temperature and quadrupole moment of CO2 (high solubility and low diffusivity) and the large kinetic diameter of N2 (low solubility and low diffusivity), one would expect a higher CO2 permeability than N2 permeability. Still, both have equal permeabilities, which suggests that either the solubility of CO2 or the effect of the kinetic diameter is lower than expected. By comparing the kinetic diameters and critical temperatures (shown in Table 1) of CO2, N2, and Ar, one can hypothesize if the solubility or diffusivity is dominant for permeation through LC membranes with isotropic and nematic cybotactic morphologies. If the solubility would be the dominant effect, one would expect a higher Ar permeability than N2 permeability because both gasses have similar critical temperatures and therefore comparable solubilities, but Ar has a smaller kinetic diameter than N2. Since both Ar and N2 have equal permeabilities, this suggests that diffusivity is dominant over the solubility and gas permeation through LC membranes with isotropic and nematic cybotactic morphologies mainly depends on diffusion. For membranes with an ordered smectic C morphology, the permeability of Ar and N2 is significantly lower than that of He and CO2, resulting in an increase in He/N2 and CO2/N2 selectivities. In line with the previous discussion, this most probably originates from the increased molecular order. With that, the total free volume within the membranes decreases, which affects the diffusion coefficient and increases the selectivity between gasses with a larger kinetic diameter (Ar and N2) and the gasses with a smaller kinetic diameter (He and CO2). To further investigate the effect of molecular order on the gas permeability of these LC membranes, the gas sorption of CO2 was measured. Subsequently, the diffusion coefficient was calculated using eq 6. Unfortunately, the N2 sorption for all membranes was too low to obtain accurate values. Therefore, Table 2 only presents the permeabilities, solubility coefficients, and diffusion coefficients of CO2 in membranes with, respectively, isotropic, nematic cybotactic, and smectic C morphologies.
Sorption experiments (Table 2) show that the solubility coefficient of CO2 is equal for all morphologies, meaning that the decrease in CO2 permeability with increasing molecular order can be completely attributed to a decrease in the diffusion coefficient. Going from an isotropic to a nematic cybotactic morphology, the diffusion coefficient decreases 2 times while the smectic C morphology compared to the isotropic morphology even shows a 10-fold decrease in the diffusion coefficient. A similar solubility coefficient for all morphologies indicates that the overall free volume in the membrane is equal for all morphologies.49 It is therefore likely that with increasing molecular order, not the total free volume within the LC membranes decreases, but the free volume elements within the membrane decrease in size. A decrease in the size of the free volume elements results in a larger reduction in diffusion coefficients for gasses with larger kinetic diameters (Ar, N2) than gasses with smaller kinetic diameters (He, CO2), inducing selectivity for the membranes with a smectic C morphology.50,51 Contrary to membranes with a smectic C morphology, membranes with an isotropic or nematic cybotactic morphology exhibit far lower selectivities due to their larger free volume elements and therefore higher diffusion coefficients.
3.4. Effect of Molecular Orientation on Single Gas Performances
The effect of molecular orientation was investigated by comparing the single gas performances of planar aligned smectic C membranes versus homeotropic aligned smectic C membranes. In the case of planar aligned membranes, the lamellar structures are oriented in the permeation direction, whereas in the homeotropic membranes, the lamellar structures are perpendicular to the permeation direction. Permeation data and ideal gas selectivities of planar and homeotropic aligned smectic C membranes are shown in Figure 7 (see Tables S1 and S2 for permeability values and ideal selectivities of all gas pairs).
Figure 7.

Gas permeation data and ideal gas selectivities of different molecular orientations. (a) Single gas permeability (He, CO2, Ar and N2), of planar and homeotropic aligned smectic C membranes at 20 °C and 6 bar feed pressure. (b) Ideal gas selectivities (CO2/N2, He/CO2, He/N2) of planar and homeotropic aligned smectic C membranes at 20 °C.
Figure 7a shows that the permeability of all gasses is diminished when going from a planar to homeotropic orientation. This decrease in permeability can be attributed to a hindered gas transport. When the lamellar structures are oriented perpendicular to the permeation direction, the gas molecules have to pass highly cross-linked acrylate areas of the membrane that inhibit diffusion and decrease the permeability. Contrary to the permeability, the ideal selectivities of homeotropic aligned membranes are higher compared to those of planar aligned membranes (Figure 7b). The highly cross-linked areas decrease the diffusion of gasses with a larger kinetic diameter such as CO2, Ar, and N2 more compared to the smaller He, resulting in enhanced He/N2 and He/CO2 selectivities. Surprisingly, the CO2/N2 selectivity of the homeotropic aligned membranes decreases with 20% compared to planar aligned membranes, indicating that CO2 is more retained by the cross-linked areas compared to N2. To study this in more detail, gas sorption of CO2 was measured at 6 bar to determine the gas solubility and calculate the diffusion coefficients (Table 3).
Table 3. CO2 Permeabilities and Solubility Coefficients Measured at 6 Bar and 20 °C and the Associated Calculated Diffusion Coefficients of Planar and Homeotropic Aligned Smectic C Membranes.
| morphology | P | S | D | ||
|---|---|---|---|---|---|
| smectic C planar | 0.37 | 0.01198 | 3.05 | ||
| smectic C homeotropic | 0.13 | 0.01196 | 1.09 |
Sorption measurements (Table 3) show that the solubility coefficient of CO2 is similar for both planar and homeotropic aligned smectic C membranes. This is expected because both orientations have the same chemistry and morphology but only differ in the direction in which the lamellar structures are aligned. Consequently, the decrease in permeability for homeotropic orientations can completely be attributed to a decrease in the diffusion coefficient. The 3-fold decrease of the diffusion coefficient of homeotropic aligned smectic C membranes compared to planar aligned smectic C membranes confirms that the lamellar structures perpendicular to the permeation direction result in increased resistance, which decreases gas diffusion and permeation but favors the increase in selectivity for the smaller components.
4. Conclusions
The effect of molecular order and orientation in freestanding thermotropic liquid crystalline (LC) polymeric membranes on their gas separation performance for He, Ar, N2, and CO2 was studied. An LC mixture, consisting of a monoacrylate with a crown ether moiety and a smectic diacrylate with a set chemical composition, was aligned and polymerized, resulting in robust freestanding membranes with various, distinct morphologies that differ in the type and degree of molecular order and orientation. A combination of POM, DSC, and X-ray scattering measurements confirmed the isotropic, nematic cybotactic, and smectic C morphologies of the LC membranes.
Gas sorption and single gas permeation of He, Ar, N2, and CO2 in membranes with isotropic, planar nematic cybotactic, and planar smectic C morphologies demonstrated that the permeability of all gasses decreases with increasing molecular order, while the ideal gas selectivities toward He and CO2 increased tremendously (36-fold for He/N2 and 21-fold for CO2/N2) when going from randomly ordered to an ordered smectic C morphology. It was found that a decreasing diffusion coefficient with increasing molecular order is responsible for the decreasing permeability, showing that gas permeation through LC membranes mainly depends on diffusion rather than solubility. The effect of molecular orientation has been demonstrated by a 3-fold reduction of the diffusion coefficient of homeotropic aligned smectic C membranes due to hindered gas transport compared to planar aligned smectic C membranes. For homeotropic smectic C membranes, yields of lamellar structures perpendicular to the permeation direction result in increased resistance, which decreases gas diffusion and permeation. Contrary to the permeability, the ideal selectivities of homeotropic oriented membranes are higher compared to those of planar aligned membranes.
Our results highlight the crucial role of molecular order and orientation in LC polymer membranes for gas separation. Further research toward LC chemistry for improved gas polymer matrix interactions and in-depth morphology performance experiments would be a next step to study the role of supramolecular organization on gas separation performance.
Acknowledgments
This research was part of the research program START-UP with project number 740.018.005, which is financed by the Dutch Organization for Scientific Research (NWO). The authors thank Lou Xianwen of the Eindhoven University of Technology for his help with MALDI-TOF measurements.
Supporting Information Available
The Supporting Information is available free of charge at https://pubs.acs.org/doi/10.1021/acs.chemmater.1c02526.
Characterizations of the synthesized compounds and fabricated polymer membranes (NMR, DSC, POM, and IR) and single gas permeation and ideal gas selectivity data (PDF)
Author Contributions
J.K. contributed to conceptualization, methodology, validation, formal analysis, investigation, writing—original draft and review & editing, and visualization. N.J. performed methodology, validation, formal analysis, investigation. M.H. contributed to formal analysis, investigation, and writing—review & editing. A.C. carried out formal analysis and investigation. J.L. performed formal analysis, investigation, and writing—review & editing. Z.B. conducted supervision and writing—review & editing. A.S. was involved in conceptualization and writing—review & editing. K.N. performed conceptualization, supervision, writing—review & editing, project administration, and funding acquisition.
The authors declare no competing financial interest.
Supplementary Material
References
- Collins A.; Galli A.; Hipwood T.; Murthy A. Living within a One Planet Reality: The Contribution of Personal Footprint Calculators. Environ. Res. Lett. 2020, 15, 025008 10.1088/1748-9326/ab5f96. [DOI] [Google Scholar]
- Basu S.; Khan A. L.; Cano-Odena A.; Liu C.; Vankelecom I. F. J. Membrane-Based Technologies for Biogas Separations. Chem. Soc. Rev. 2010, 39, 750–768. 10.1039/b817050a. [DOI] [PubMed] [Google Scholar]
- Bernardo P.; Drioli E.; Golemme G. Membrane Gas Separation: A Review/State of the Art. Ind. Eng. Chem. Res. 2009, 48, 4638–4663. 10.1021/ie8019032. [DOI] [Google Scholar]
- Sanders D. F.; Smith Z. P.; Guo R.; Robeson L. M.; McGrath J. E.; Paul D. R.; Freeman B. D. Energy-Efficient Polymeric Gas Separation Membranes for a Sustainable Future: A Review. Polymer 2013, 54, 4729–4761. 10.1016/j.polymer.2013.05.075. [DOI] [Google Scholar]
- Rufford T. E.; Smart S.; Watson G. C. Y.; Graham B. F.; Boxall J.; Diniz da Costa J. C.; May E. F. The Removal of CO2 and N2 from Natural Gas: A Review of Conventional and Emerging Process Technologies. J. Pet. Sci. Eng. 2012, 94–95, 123–154. 10.1016/j.petrol.2012.06.016. [DOI] [Google Scholar]
- Scholes C. A.; Ghosh U. K. Review of Membranes for Helium Separation and Purification. Membranes 2017, 7, 9 10.3390/membranes7010009. [DOI] [PMC free article] [PubMed] [Google Scholar]
- Akbari A.; Karimi-Sabet J.; Ghoreishi S. M. Intensification of Helium Separation from CH4 and N2 by Size-Reduced Cu-BTC Particles in Matrimid Matrix. Sep. Purif. Technol. 2020, 251, 117317 10.1016/j.seppur.2020.117317. [DOI] [Google Scholar]
- Hamid M. R. A.; Jeong H. K. Recent Advances on Mixed-Matrix Membranes for Gas Separation: Opportunities and Engineering Challenges. Korean J. Chem. Eng. 2018, 35, 1577–1600. 10.1007/s11814-018-0081-1. [DOI] [Google Scholar]
- Zhang Y.; Feng X.; Yuan S.; Zhou J.; Wang B. Challenges and Recent Advances in MOF-Polymer Composite Membranes for Gas Separation. Inorg. Chem. Front. 2016, 3, 896–909. 10.1039/c6qi00042h. [DOI] [Google Scholar]
- Bara J. E.; Kaminski A. K.; Noble R. D.; Gin D. L. Influence of Nanostructure on Light Gas Separations in Cross-Linked Lyotropic Liquid Crystal Membranes. J. Membr. Sci. 2007, 288, 13–19. 10.1016/j.memsci.2006.09.023. [DOI] [Google Scholar]
- Freeman B. D. Basis of Permeability/Selectivity Tradeoff Relations in Polymeric Gas Separation Membranes. Macromolecules 1999, 32, 375–380. 10.1021/ma9814548. [DOI] [Google Scholar]
- Burns R. L.; Steel K. M.; Burns S. D.; Koros W. J. Explanation of a Selectivity Maximum, as a Function of the Material Structure for Organic Gas Separation Membranes. Ind. Eng. Chem. Res. 2004, 43, 5942–5949. 10.1021/ie049800z. [DOI] [Google Scholar]
- Robeson L. M. The Upper Bound Revisited. J. Membr. Sci. 2008, 320, 390–400. 10.1016/j.memsci.2008.04.030. [DOI] [Google Scholar]
- Houben M.; Borneman Z.; Nijmeijer K. Plasticization Behavior of Crown-Ether Containing Polyimide Membranes for the Separation of CO2. Sep. Purif. Technol. 2021, 255, 117307 10.1016/j.seppur.2020.117307. [DOI] [Google Scholar]
- Xiao Y.; Low B. T.; Hosseini S. S.; Chung T. S.; Paul D. R. The Strategies of Molecular Architecture and Modification of Polyimide-Based Membranes for CO2 Removal from Natural Gas-A Review. Prog. Polym. Sci. 2009, 34, 561–580. 10.1016/j.progpolymsci.2008.12.004. [DOI] [Google Scholar]
- Shahid S.; Nijmeijer K. High Pressure Gas Separation Performance of Mixed-Matrix Polymer Membranes Containing Mesoporous Fe(BTC). J. Membr. Sci. 2014, 459, 33–44. 10.1016/j.memsci.2014.02.009. [DOI] [Google Scholar]
- Zhang M.; Deng L.; Xiang D.; Cao B.; Hosseini S. S.; Li P. Approaches to Suppress CO2-Induced Plasticization of Polyimide Membranes in Gas Separation Applications. Processes 2019, 7, 51 10.3390/pr7010051. [DOI] [Google Scholar]
- Buonomenna M. G.; Yave W.; Golemme G. Some Approaches for High Performance Polymer Based Membranes for Gas Separation: Block Copolymers, Carbon Molecular Sieves and Mixed Matrix Membranes. RSC Adv. 2012, 2, 10745–10773. 10.1039/c2ra20748f. [DOI] [Google Scholar]
- Lodge T. P. Block Copolymers: Past Successes and Future Challenges. Macromol. Chem. Phys. 2003, 204, 265–273. 10.1002/macp.200290073. [DOI] [Google Scholar]
- Ruzette A. V.; Leibler L. Block Copolymers in Tomorrow’ s Plastics. Nat. Mater. 2005, 4, 19–31. 10.1038/nmat1295. [DOI] [PubMed] [Google Scholar]
- Park S.; Yavuzcetin O.; Kim B.; Tuominen M. T.; Russell T. P. A Simple Top-down/Bottom-up Approach to Sectored, Ordered Arrays of Nanoscopic Elements Using Block Copolymers. Small 2009, 5, 1064–1069. 10.1002/smll.200801573. [DOI] [PubMed] [Google Scholar]
- Darling S. B. Directing the Self-Assembly of Block Copolymers. Prog. Polym. Sci. 2007, 32, 1152–1204. 10.1016/j.progpolymsci.2007.05.004. [DOI] [Google Scholar]
- Reijerkerk S. R.; Arun A.; Gaymans R. J.; Nijmeijer K.; Wessling M. Tuning of Mass Transport Properties of Multi-Block Copolymers for CO2 Capture Applications. J. Membr. Sci. 2010, 359, 54–63. 10.1016/j.memsci.2009.09.045. [DOI] [Google Scholar]
- Car A.; Stropnik C.; Yave W.; Peinemann K. V. Pebax/Polyethylene Glycol Blend Thin Film Composite Membranes for CO2 Separation: Performance with Mixed Gases. Sep. Purif. Technol. 2008, 62, 110–117. 10.1016/j.seppur.2008.01.001. [DOI] [Google Scholar]
- Reijerkerk S. R.; Ijzer A. C.; Nijmeijer K.; Arun A.; Gaymans R. J.; Wessling M. Subambient Temperature CO2 and Light Gas Permeation through Segmented Block Copolymers with Tailored Soft Phase. ACS Appl. Mater. Interfaces 2010, 2, 551–560. 10.1021/am900754z. [DOI] [PubMed] [Google Scholar]
- Car A.; Stropnik C.; Yave W.; Peinemann K. V. Tailor-Made Polymeric Membranes Based on Segmented Block Copolymers for CO2 Separation. Adv. Funct. Mater. 2008, 18, 2815–2823. 10.1002/adfm.200800436. [DOI] [Google Scholar]
- Zhou M.; Kidd T. J.; Noble R. D.; Gin D. L. Supported Lyotropic Liquid-Crystal Polymer Membranes: Promising Materials for Molecular-Size-Selective Aqueous Nanofiltration. Adv. Mater. 2005, 17, 1850–1853. 10.1002/adma.200500444. [DOI] [Google Scholar]
- Bögels G. M.; Lugger J. A. M.; Goor O. J. G. M.; Sijbesma R. P. Size-Selective Binding of Sodium and Potassium Ions in Nanoporous Thin Films of Polymerized Liquid Crystals. Adv. Funct. Mater. 2016, 26, 8023–8030. 10.1002/adfm.201603408. [DOI] [Google Scholar]
- Henmi M.; Nakatsuji K.; Ichikawa T.; Tomioka H.; Sakamoto T.; Yoshio M.; Kato T. Self-Organized Liquid-Crystalline Nanostructured Membranes for Water Treatment: Selective Permeation of Ions. Adv. Mater. 2012, 24, 2238–2241. 10.1002/adma.201200108. [DOI] [PubMed] [Google Scholar]
- Harris K. D.; Cuypers R.; Scheibe P.; Mol G. N.; Lub J.; Bastiaansen C. W. M.; Broer D. J.. Molecular Orientation Control for Thermal and UV-Driven Polymer MEMS Actuators. In Smart Sensors, Actuators, and MEMS II; International Society for Optics and Photonics, 2005; Vol. 5836, pp 493–503. [Google Scholar]
- Braun C. D.; Lub J. Discotic Liquid Crystalline Crosslinkers and Anisotropic Networks. Liq. Cryst. 1999, 26, 1501–1509. 10.1080/026782999203832. [DOI] [Google Scholar]
- Sasaki T.; Hazato H.; Katsuragi A.; Nakazawa Y. Photorefractive Effect of Photoconductive-Polymer-Stabilized Ferroelectric Liquid Crystals. Mol. Cryst. Liq. Cryst. 2009, 503, 81–98. 10.1080/15421400902841361. [DOI] [Google Scholar]
- Li C.; Cho J.; Yamada K.; Hashizume D.; Araoka F.; Takezoe H.; Aida T.; Ishida Y. Macroscopic Ordering of Helical Pores for Arraying Guest Molecules Noncentrosymmetrically. Nat. Commun. 2015, 6, 8667 10.1038/ncomms9418. [DOI] [PMC free article] [PubMed] [Google Scholar]
- Gupta M.; Suzuki Y.; Sakamoto T.; Yoshio M.; Torii S.; Katayama H.; Kato T. Polymerizable Photocleavable Columnar Liquid Crystals for Nanoporous Water Treatment Membranes. ACS Macro Lett. 2019, 8, 1303–1308. 10.1021/acsmacrolett.9b00513. [DOI] [PubMed] [Google Scholar]
- Sakamoto T.; Ogawa T.; Nada H.; Nakatsuji K.; Mitani M.; Soberats B.; Kawata K.; Yoshio M.; Tomioka H.; Sasaki T.; et al. Development of Nanostructured Water Treatment Membranes Based on Thermotropic Liquid Crystals: Molecular Design of Sub-Nanoporous Materials. Adv. Sci. 2018, 5, 1700405 10.1002/advs.201700405. [DOI] [PMC free article] [PubMed] [Google Scholar]
- Van Kuringen H. P. C.; Eikelboom G. M.; Shishmanova I. K.; Broer D. J.; Schenning A. P. H. J. Responsive Nanoporous Smectic Liquid Crystal Polymer Networks as Efficient and Selective Adsorbents. Adv. Funct. Mater. 2014, 24, 5045–5051. 10.1002/adfm.201400428. [DOI] [Google Scholar]
- Liang T.; Van Kuringen H. P. C.; Mulder D. J.; Tan S.; Wu Y.; Borneman Z.; Nijmeijer K.; Schenning A. P. H. J. Anisotropic Dye Adsorption and Anhydrous Proton Conductivity in Smectic Liquid Crystal Networks: The Role of Cross-Link Density, Order, and Orientation. ACS Appl. Mater. Interfaces 2017, 9, 35218–35225. 10.1021/acsami.7b09386. [DOI] [PMC free article] [PubMed] [Google Scholar]
- Zhou M.; Nemade P. R.; Lu X.; Zeng X.; Hatakeyama E. S.; Noble R. D.; Gin D. L. New Type of Membrane Material for Water Desalination Based on a Cross-Linked Bicontinuous Cubic Lyotropic Liquid Crystal Assembly. J. Am. Chem. Soc. 2007, 129, 9574–9575. 10.1021/ja073067w. [DOI] [PubMed] [Google Scholar]
- Dischinger S. M.; Rosenblum J.; Noble R. D.; Gin D. L.; Linden K. G. Application of a Lyotropic Liquid Crystal Nano Filtration Membrane for Hydraulic Fracturing Flowback Water: Selectivity and Implications for Treatment. J. Membr. Sci. 2017, 543, 319–327. 10.1016/j.memsci.2017.08.028. [DOI] [Google Scholar]
- Marets N.; Kuo D.; Torrey J. R.; Sakamoto T.; Henmi M.; Katayama H.; Kato T. Highly Efficient Virus Rejection with Self-Organized Membranes Based on a Crosslinked Bicontinuous Cubic Liquid Crystal. Adv. Healthcare Mater. 2017, 6, 1700252 10.1002/adhm.201700252. [DOI] [PubMed] [Google Scholar]
- Percec V.; Rodenhouse R. Liquid Crystal Polymers Containing Macroheterocyclic Ligands. 2. Side Chain Liquid Crystal Polysiloxanes and Polymethacrylates Containing 4-(ω-Alkan-l-Yloxy)-4′-(4′-Carboxybenzo-15-Crown-5)Biphenyl Side Groups. Macromolecules 1989, 22, 4408–4412. 10.1021/ma00202a003. [DOI] [Google Scholar]
- Hikmet R. A. M.; Lub J.; Tol A. J. W. Effect of the Orientation of the Ester Bonds on the Properties of Three Isomeric Liquid Crystal Diacrylates before and after Polymerization. Macromolecules 1995, 28, 3313–3327. 10.1021/ma00113a036. [DOI] [Google Scholar]
- McMillan W. L. X-Ray Scattering from Liquid Crystals. I. Cholesteryl Nonanoate and Myristate. Phys. Rev. A 1972, 6, 936–947. 10.1103/PhysRevA.6.936. [DOI] [Google Scholar]
- Nasrin L.; Nasir A. K.; Yoshizawa A.; Ghosh S.; Rahman M. Nematic-Cybotactic Nematic Phase Transition in a Liquid Crystal: A Dielectric Spectroscopic Study. Mater. Res. Express 2019, 6, 115105 10.1088/2053-1591/ab4671. [DOI] [Google Scholar]
- Rallapalli P.; Prasanth K. P.; Patil D.; Somani R. S.; Jasra R. V.; Bajaj H. C. Sorption Studies of CO2, CH4, N2, CO, O2 and Ar on Nanoporous Aluminum Terephthalate [MIL-53(Al)]. J. Porous Mater. 2011, 18, 205–210. 10.1007/s10934-010-9371-7. [DOI] [Google Scholar]
- Wijmans J. G.; Baker R. W. The Solution-Diffusion Model: A Review. J. Membr. Sci. 1995, 107, 1–21. 10.1016/0376-7388(95)00102-I. [DOI] [Google Scholar]
- George S. C.; Thomas S. Transport Phenomena through Polymeric Systems. Prog. Polym. Sci. 2001, 26, 985–1017. 10.1016/S0079-6700(00)00036-8. [DOI] [Google Scholar]
- Wang S.; Li X.; Wu H.; Tian Z.; Xin Q.; He G.; Peng D.; Chen S.; Yin Y.; Jiang Z.; et al. Advances in High Permeability Polymer-Based Membrane Materials for CO2 Separations. Energy Environ. Sci. 2016, 9, 1863–1890. 10.1039/c6ee00811a. [DOI] [Google Scholar]
- Hu C. C.; Chang C. S.; Ruaan R. C.; Lai J. Y. Effect of Free Volume and Sorption on Membrane Gas Transport. J. Membr. Sci. 2003, 226, 51–61. 10.1016/j.memsci.2003.07.010. [DOI] [Google Scholar]
- Haraya K.; Hwang S. T. Permeation of Oxygen, Argon and Nitrogen through Polymer Membranes. J. Membr. Sci. 1992, 71, 13–27. 10.1016/0376-7388(92)85002-Z. [DOI] [Google Scholar]
- Thornton A. W.; Nairn K. M.; Hill A. J.; Hill J. M. New Relation between Diffusion and Free Volume: I. Predicting Gas Diffusion. J. Membr. Sci. 2009, 338, 29–37. 10.1016/j.memsci.2009.03.053. [DOI] [Google Scholar]
Associated Data
This section collects any data citations, data availability statements, or supplementary materials included in this article.