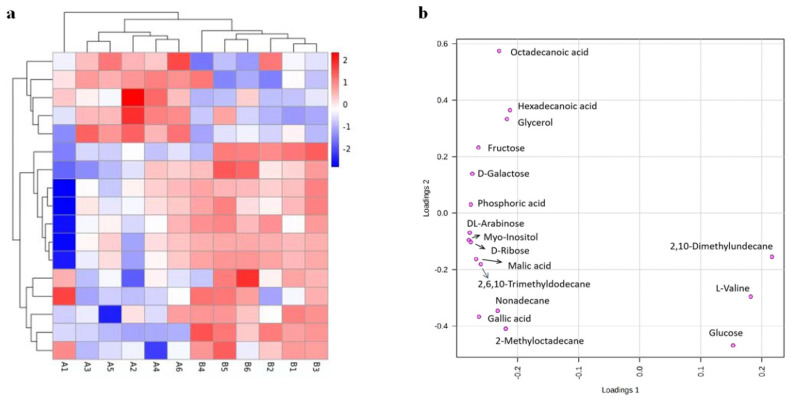
Figure 3.
(a) Heat map of metabolites in tea samples dried by the HA and HR treatments. Group A, Yihong Congou black tea processed by HA drying; Group B, Yihong Congou black tea processed by HR drying. Warm color and cold color indicate increased and decreased expression of the metabolites, respectively. (b) Loading plot of metabolites in tea samples dried by the HA and HR treatments, based on the criteria of VIP > 1, p < 0.05, and match score ≥ 700. D-ribose and gallic acid were considered as the most influential characteristic metabolites.

