

Abstract

Catalyzing capping layers on metal hydrides are employed to enhance the hydrogenation kinetics of metal hydride-based systems such as hydrogen sensors. Here, we use a novel experimental method to study the hydrogenation kinetics of catalyzing capping layers composed of several alloys of Pd and Au as well as Pt, Ni, and Ru, all with and without an additional PTFE polymer protection layer and under the same set of experimental conditions. In particular, we employ a thin Ta film as an optical indicator to study the kinetics of the catalytic layers deposited on top of it and which allows one to determine the absolute hydrogenation rates. Our results demonstrate that doping Pd with Au results in significantly faster hydrogenation kinetics, with response times up to five times shorter than Pd through enhanced diffusion and a reduction in the activation energy. On the other hand, the kinetics of non-Pd-based materials turn out to be significantly slower and mainly limited by the diffusion through the capping layer itself. Surprisingly, the additional PTFE layer was only found to improve the kinetics of Pd-based capping materials and has no significant effect on the kinetics of Pt, Ni, and Ru. Taken together, the experimental results aid in rationally choosing a suitable capping material for the application of metal hydrides and other materials in a hydrogen economy. In addition, the used method can be applied to simultaneously study the hydrogenation kinetics in thin-film materials for a wide set of experimental conditions.
Keywords: metal hydrides, hydrogenation, kinetics, thin films, capping layers, catalytic layers
1. Introduction
Metal hydrides have been projected to play an important role in a green economy in which hydrogen is an important energy vector.1−4 While these materials have traditionally been studied as materials for hydrogen storage,5−7 other applications as in switchable mirrors,8,9 hydrogen-purifying membranes,10−12 fuel cells,13 and especially hydrogen sensors became increasingly prominent over the last years.7,14−19 In all of these applications, fast kinetics are extremely important. However, while the diffusion of hydrogen is in most materials relatively fast at room temperature, the observed kinetics are generally speaking much slower. Therefore, catalyzing layers on top of the active material are often used. These layers promote the dissociation of hydrogen molecules (H2) into atomic hydrogen at their surface and may also protect the layer from, for example, oxidation and poisonous chemical species.
Especially, for metal hydride-based hydrogen sensors, capping layers play an important role to accelerate the kinetics or as additional protection to avoid chemical cross-sensitivity. One of the many different types of metal hydride-based sensors are optical hydrogen sensors with a separate hydrogen dissociation and sensing functionality.7,20−23 In such optical hydrogen sensors, a separate capping layer on top catalyzes the hydrogen dissociation and provides protection against chemical poisoning, while the sensing layer absorbs hydrogen when it is exposed to an environment containing hydrogen. In turn, the absorption of hydrogen by the sensing layer changes the optical properties of this layer. As such, one can determine the hydrogen pressure or concentration in the environment of the sensor by, for example, measuring the reflectivity or transmission of the sensing layer.7,16,19
While in fuel cells, Pt is typically used to catalyze the hydrogen dissociation,24,25 in capping layers, for metal hydride-based hydrogen sensors and in switchable mirrors, Pd is often the material of choice. Pd can readily dissociate hydrogen at room temperature,7,14−17 and the application of a 30 nm polytetrafluoroethylene (PTFE) or other polymeric layers on top of Pd can significantly increase its chemical selectivity and enhance the kinetics. These effects have been assigned to a lower activation energy or to more active sites on the surface remaining available to dissociate the hydrogen.26−28
However, Pd has some major drawbacks as a catalyzing layer. The first-order transition from the dilute α-PdHx to the higher concentration PdHx β phase occurring upon hydrogen sorption renders the optical response highly hysteretic, which is problematic for hydrogen sensors. Most importantly, the high energy barriers associated with the nucleation of domains when the β phase is formed result in relatively long response times. Furthermore, long-term stability issues due to the formation of cracks, buckling, and delamination as a result of the large volumetric expansion upon hydrogenation have been reported for thin layers of Pd.29,30
Capping layers different from Pd are thus required, and in this paper, we consider two approaches to find these alternative capping layers. The first approach is to alloy Pd with other elements such as Au, which suppresses the first-order phase transition for sufficiently large Au concentrations,28,31,32 increases the hydrogen solubility,28,31,32 and decreases the activation energy.33 The second approach is to consider single-element layers made of elements other than Pd as Pt, Ni, and Ru, that is, materials that themselves hardly absorb hydrogen but can catalyze the dissociation and recombination reaction of hydrogen. Albeit it is well-known that these single element layers may catalyze hydrogen absorption, a dedicated and comprehensive study in which a series of capping layers are tested under exactly the same circumstances and under a wide variety of conditions (temperature and pressure) is at present unavailable.
This paper fills this void by experimentally studying the hydrogenation kinetics of various capping layers composed of (i) several alloys of Pd and Au and (ii) single elements Pt, Ni, and Ru, all with and without a PTFE protection layer and under exactly the same experimental conditions. We do this using a newly developed method based on studying the optical transmission of capped films of Ta. Here, the Ta serves as an indicator layer owing to its large changes in the optical properties and high diffusivity of hydrogen. These changes are not only large but also gradual: the optical transmission continuously decreases when the hydrogen pressure is increased, allowing us to assess the kinetics of the capping layers over a wide pressure (and temperature) range.22,23 As such, we can in this way systematically measure the hydrogenation kinetics of many different samples simultaneously and under a wide range of experimental conditions.
The results presented in this paper demonstrate that doping Pd with Au significantly accelerates the hydrogenation kinetics under all probed experimental conditions, with response times up to five times shorter than Pd. These improved kinetics result both from enhanced diffusion and a reduction in the activation energy. From the non-Pd-based capping layers, only Ni turns out to be competitive at room temperature with response times slightly longer than Pd. Surprisingly, PTFE was only found to improve the kinetics of Pd-based capping materials and had no significant effect on the kinetics of Pt, Ni, and Ru. As such, these results aid in rationally selecting a suitable capping material for the application of metal hydrides in a green economy. In a wider perspective, the method developed in this paper can be used to simultaneously study the hydrogenation kinetics in thin-film materials for a wide set of experimental conditions.
2. Experimental Section
2.1. Experimental Method and Sample Composition
To study the hydrogenation kinetics of the catalyzing capping layers, we use a multilayer thin film consisting of a Ti adhesion layer, a Ta indicator layer, and the capping layer of interest. As schematically illustrated in Figure 1, we monitor the changes in optical transmission of the Ta layer inside a hydrogenation chamber as a function of time from which we determine the response time. As previous measurements indicate that the logarithm of the relative change in transmission of Ta is proportional to the hydrogenation of the layer,22 this allows an absolute determination of the hydrogenation rate.
Figure 1.

Schematic illustration of the method used to study the hydrogenation kinetics of the capping layers. In this method, we use a multilayer thin film consisting of a Ti adhesion layer, a Ta indicator layer, and the capping layer of interest (see left inset). The thin film is positioned inside a hydrogenation chamber with controlled temperature, itself located in a temperature-controlled environment. We monitor the time dependence of the changes in optical transmission of the sample with a CMOS camera. Upon a change in hydrogen pressure, the optical transmission of the Ta layer changes, which we use to determine the response time t90 that is here defined as the time to reach 90% of the total signal (see right inset).
The reasons for selecting Ta as our indicator layer are threefold. First, thin-film Ta has a large hydrogen solubility window and gradual hydrogenation over a large partial pressure range without any hysteresis and within one single thermodynamic phase.23 As such, it allows us to examine the (de)hydrogenation kinetics of capping layers over both a large temperature and pressure window without the presence of any sluggish, hysteretic, or irreversible phase transition. Second, the changes in optical transmission of Ta upon exposure to hydrogen are large and proportional to the hydrogenation of the layer over the entire solubility range,22 allowing for high-resolution response time measurements and absolute calibration of the hydrogenation rate. Most importantly, previous measurements indicate that diffusion of hydrogen through body-centered cubic (bcc) Ta thin films is, as for bulk,34 fast,22 occurring at the subsecond time scale, and will thus not influence the total response times. In other words, the limiting factor of the kinetics is the catalyzing layers on top of the Ta indicator layer.
We measure the changes in optical transmission in the same way as in hydrogenography35 using an Imaging Source 1/2.5″ Aptina CMOS 2592 × 1944 pixel monochrome camera equipped with an Edmunds Optics 55–906 lens, that is, the same camera used in ref (36) which has an maximum acquisition frequency of 20 Hz. Five Philips MR16 MASTER LEDs (10/50 W) with a color temperature of 4000 K are used as a light source and provide a white spectrum (Figure S1). The transmission is averaged over an area of 180 × 180 pixels, corresponding to about 80 mm2. A reference sample is used to compensate for fluctuations of the LED white light source. The partial hydrogen pressures of 10–1 < PH2 < 10+6 Pa are obtained using 0.1, 3.5, and 100% H2 in Ar gas mixtures. During the experiments, a minimum gas flow of 20 s.c.c.m. is always maintained.
The response time t90 is defined as the time to reach 90% of the total signal. To measure the hydrogen absorption response times, the pressure was increased from the base pressure of 0.9 mbar total pressure to the pressure of interest (maximum 100 mbar total pressure). As a result of the large partial hydrogen pressure range investigated, three different hydrogen base pressures were used for the three H2 in Ar gas mixtures. The pressure was stepwise increased from PH2 = 0.090 Pa for response times measured for PH2 ≤ 10 Pa, from PH2 = 5 Pa for response times measured for 9 Pa ≤ PH2 ≤ 350 Pa, and from PH2 = 90 Pa (the regions partly overlap) for response times measured for PH2 > 150 Pa. The minimum time required to achieve a stable pressure, that is, the shortest response time that can be reliably detected, was found to be 0.3 s.
2.2. Sample Preparation and Characterization
All samples are produced with magnetron sputtering and composed of a 4 nm Ti adhesion layer, a 40 nm Ta indicator layer that generates the fast majority of the optical contrast, a 10 nm capping layer, and an optional 30 nm PTFE layer. As a capping layer, we consider Pd1–yAuy layers with y = 0, 0.1, 0.2, 0.3, 0.4, and 0.5 and Ni, Pt, and Ru. Direct current (DC) magnetron sputtering of the metallic layers is performed in 0.3 Pa of argon and inside an ultrahigh vacuum chamber (AJA Int.) with a base pressure of 10–10 Pa. The layers were deposited on 10 × 10 mm2 quartz substrates (thickness of 0.5 mm and surface roughness < 0.4 nm) which were rotated to enhance the homogeneity of the deposited layers. Typical deposition rates include 0.11–0.22 nm s–1 (22–50 W DC) for Pd, 0.10 nm s–1 (125 W DC) for Ta, 0.05 nm s–1 (100 W DC) for Ti, 0.11–0.22 nm s–1 (6–25 W DC) for Au, 0.07 nm s–1 (100 W DC) for Ni, 0.12 nm s–1 (50 W DC) for Pt, and 0.13 nm s–1 (100 W DC) for Ru. These rates were determined by sputtering each target independently at a fixed power over a well-defined time interval. Subsequently, X-ray reflectometry (XRR) was used to estimate the layer thickness of this reference sample (see below for the Experimental Section), from which the sputter rate was computed. Different from the other layers, PTFE was deposited by radiofrequency magnetron sputtering in 0.5 Pa of Ar. The thickness of the reference film was in this case measured with a DekTak3 profilometer. While all targets were presputtered for at least 5 min, the Ta target was presputtered for at least 240 min to avoid possible contamination from the tantalum oxide and nitride layers possibly present at the surface of the target.
The structure and thickness of all samples were verified with X-ray diffraction (XRD) and XRR (Figures S2, S4) using a Bruker D8 DISCOVER (Cu Kα λ = 0.1542 nm). The XRR measurements were fitted with GenX337 to obtain estimates for the layer thickness, roughness, and density of the thin films. These fitted parameters are reported in Table S4 and reveal that the deviation of the layer thickness between the different samples is at maximum 3%, that the density of the various layers is consistent with the literature value reported for bulk materials, and that the roughness of the surface of the capping layer is at maximum 1.5 nm. Atomic force microscopy (AFM) measurements (Figure S3) performed with a Bruker Multimode AFM are used to characterize the morphology and confirm the smooth surface and indicate the absence of mesopores or holes in the film. XRD measurements reveal that all capping layers crystallize in a face-centered cubic structure and are textured with the ⟨111⟩—crystallographic direction in the out-of-plane direction. The lattice constants for the Pd1–yAuy samples follow Vergard’s law [Figure S4b].
X-ray photoelectron spectroscopy (XPS) measurements were performed with a ThermoFisher K-Alpha spectrometer equipped with a focused monochromatic Al Kα source (1486.6 eV) anode operating at 36 W (12 kV, 3 mA) and a flood gun operating at 1 V, 100 μA. The pass energy of the analyzer was set to 50 eV, the spot size was approximately 800 × 400 μm2, and the base pressure in the analysis chamber is approximately 2 × 10⁻⁹ mbar. The binding energy BE was corrected for the charge shift relative to the primary C 1s hydrocarbon peak at BE = 284.8 eV, leading to a correction of the BE of max 0.1 eV. The C 1s and F 1s spectra were fitted with Thermo Scientific Avantage Software (Version 5.986) using a pseudo-Voigt with a 70% Gaussian and a 30% Lorentzian contribution (weighted least-squares fitting method) and a nonlinear Shirley-type background. Similar to previous reports,26 the C 1s spectra of the PTFE layer (Figure S5) sputtered on top of the layers indicate the presence of C–C, C–CF, C–F, C–F2, and C–F3 bonds, which is different from bulk PTFE where only CF2 bonds are present. Additional measurements (Figure S6) indicate that the C 1s, O 1s, and F 1s spectra remain unchanged after exposure to hydrogen, indicating that the distribution of bonds within the PTFE layer is largely unaffected by the hydrogenation of the sample.
Before the measurements, we exposed the thin films to three cycles of hydrogen with a maximum pressure of PH2 = 10+6 Pa at T = 28 °C. Reproducible results in terms of both hydrogenation kinetics and the absolute hydrogen solubility are obtained from the second cycle onward. The difference between the first and subsequent cycles is common to thin-film metal hydrides. Generally speaking, a few cycles of exposure to hydrogen are required to show reproducible results due to settling of the microstructure (see also Figure S4). In particular, we note that during the first exposure to hydrogen, the Ni-capped sample only hydrogenated after 12 h of exposure to PH2 = 10+6 Pa at room temperature, while much faster responses were observed for subsequent cycles. This suggests a substantial rearrangement of the microstructure upon first exposure to hydrogen.
3. Results
3.1. Pd-Based Capping Layers
3.1.1. Optical Response and Hydrogenation of the Capping Layer
We start our empirical analysis by studying the hydrogenation(kinetics) of the Pd1–yAuy capping layers. The rationale to partly substitute Pd by Au is threefold. First of all, a previous experimental study by Namba et al. indicates that alloying the Pd(110) surface with Au may significantly increase the hydrogen absorption kinetics through a reduction in the activation energy,33 while Nugroho et al. also report that substitution with Au reduces the apparent activation energy in Pd1–yAuy nanoparticles.28 Second, substitution by Au reduces the hydrogenation of the layer at higher hydrogen pressures and, for sufficiently large Au concentrations (y ≳ 0.2), suppresses the first-order metal-to-metal hydride phase transition from the dilute α-PdHx to the higher concentration PdHx β-phase, that is, thus eliminating the associated hysteresis and the sluggish phase transition.31,32,38−40 This is especially relevant to hydrogen-sensing applications as it ensures that the hydrogenation of the capping layer, and thus the (optical) response, is free of any hysteresis. Furthermore, a limited hydrogenation of the capping layer reduces the volumetric expansion and thus improves the long-term stability of the layer. In addition, a large hydrogenation of the capping layer itself also increases the total amount of hydrogen to be dissociated at the surface and transported to the subsurface, which may result in larger response times. Third, substitution by Au increases the size of the face-centered cubic unit cell (see Figure S4c), which may together with an increased hydrogen solubility at lower pressures accelerate the transport across the capping layer. Indeed, although Au itself does not absorb hydrogen and the substitution of Pd by Au reduces the hydrogenation at larger hydrogen pressures, the increased unit cell results in lower hydrogen pressures in larger hydrogen solubilities of the capping layer, showing a maximum for y ≈ 0.3, and this enhanced solubility may in turn accelerate the hydrogen transport.
These trends
are quantitatively reproduced for the 10 nm capping layers. Figure 2 displays the partial
hydrogen pressure dependence of the optical response of our 10 nm
Pd1–yAuy capping layers at four different temperatures. Neutron reflectometry
measurements32 show that the optical response,
measured as the natural logarithm of the white light optical transmission  relative to
the transmission of the as-prepared
film (
relative to
the transmission of the as-prepared
film ( ), is irrespective of the Au concentration
of the alloy directly proportional to the hydrogenation of Pd1–yAuyHx thin films. Most importantly, no hysteresis
(and sluggish phase transitions) can be discerned for the compositions
with y > 0.2, which together with the strongly
reduced
hydrogenation at high hydrogen pressures and the increased hydrogen
solubility at low hydrogen pressures make these compositions most
suitable as capping layers. On top of that, the reduced hydrogenation
of the capping layer and thus the reduced volumetric/thickness expansion
as well as the increased adhesion of Pd1–yAuy enhance the long-term structural
stability of the film. We note here that the presence of hysteresis
and the hydrogenation of the capping layers may depend on the layer
thickness and adhesion conditions.29,30,32,41−44
), is irrespective of the Au concentration
of the alloy directly proportional to the hydrogenation of Pd1–yAuyHx thin films. Most importantly, no hysteresis
(and sluggish phase transitions) can be discerned for the compositions
with y > 0.2, which together with the strongly
reduced
hydrogenation at high hydrogen pressures and the increased hydrogen
solubility at low hydrogen pressures make these compositions most
suitable as capping layers. On top of that, the reduced hydrogenation
of the capping layer and thus the reduced volumetric/thickness expansion
as well as the increased adhesion of Pd1–yAuy enhance the long-term structural
stability of the film. We note here that the presence of hysteresis
and the hydrogenation of the capping layers may depend on the layer
thickness and adhesion conditions.29,30,32,41−44
Figure 2.

Partial
hydrogen pressure dependence of the optical responses of
10 nm Pd1–yAuy capping layers at (a) T = 28, (b) 60, (c)
90, and (d) 120 °C. The response was measured by stepwise increasing
and decreasing the pressure between PH2 = 1 × 101 and 4 × 10⁵ Pa.
The optical response is measured as the natural logarithm of the changes
in the white light optical transmission  relative to
the transmission of the as-prepared
film (
relative to
the transmission of the as-prepared
film ( ) and has been computed by subtracting the
response of the 4 nm Ti adhesion layer and 40 nm Ta layer as reported
in ref (23) from the
Pd1–yAuy-capped 40 nm Ta thin films with a 4 nm Ti adhesion layer. As the
changes in transmission of the capping layer are relatively small
w.r.t. of the Ta indicator layer and the measurement time was relatively
long, this caused some long-term fluctuations in the determined changes
in transmission of the capping layers. Previous neutron reflectometry
measurements indicate that ln(
) and has been computed by subtracting the
response of the 4 nm Ti adhesion layer and 40 nm Ta layer as reported
in ref (23) from the
Pd1–yAuy-capped 40 nm Ta thin films with a 4 nm Ti adhesion layer. As the
changes in transmission of the capping layer are relatively small
w.r.t. of the Ta indicator layer and the measurement time was relatively
long, this caused some long-term fluctuations in the determined changes
in transmission of the capping layers. Previous neutron reflectometry
measurements indicate that ln( )
is proportional to the hydrogen content x in the
Pd1–yAuyHx layer.32
)
is proportional to the hydrogen content x in the
Pd1–yAuyHx layer.32
3.1.2. Response times
Next, we investigate the room-temperature response times of Pd0.7Au0.3, Pd0.6Au0.4, and Pd0.5Au0.5, that is, the Pd1–yAuy compositions for which we did not find any signs of hysteresis. As a reference, we also consider widely used Pd. In Figure 3, we display the response of these samples to a series of increasing pressure steps between PH2 = 150 and 10,000 Pa without (Figure 3a–d) and with an additional PTFE layer on top of the capping layer (Figure 3e–h).
Figure 3.

Normalized optical transmissions showing the absorption kinetics of a 40 nm Ta thin film with a 4 nm Ti adhesion layer capped with a 10 nm (a,e) Pd, (b,f) Pd0.7Au0.3, (c,g) Pd0.6Au0.4, and (d,h) Pd0.5Au0.5 layer to a series of pressure steps between PH2 = 0.5 102 Pa and the partial hydrogen pressure indicated. The samples in (e–h) are covered with a 30 nm PTFE layer.
The results show three general trends. First of all, we find that the substitution of Pd by Au in the capping layer significantly reduces the response times. The reduction is the largest for Pd0.6Au0.4 (Figure 3c), showing response times that are about five times shorter than those for Pd (Figure 3a). The enhancement of the kinetics is even greater for PH2 > 1000 Pa, where the first-order metal-to-metal hydride transition renders the response of Pd highly hysteretic and for which response times are in the minute time scale (not shown). In stark contrast, Pd0.6Au0.4 has, as a result of the absence of a first-order metal-to-metal hydride transition (Figure 2), response times below 2 s for PH2 > 1000 Pa.
Second, we observe that the presence of the PTFE layer on top of the capping layer significantly reduces the response times. This reduction is the strongest for Pd, for which PTFE reduces the response times by a factor of approximately 15. With increasing Au concentration, the effect of PTFE on the response times is reduced. However, with the reduction of the response times with a factor of about four for Pd0.5Au0.5, the effect remains significant. We note that the diffusion of hydrogen through the PTFE layer is nearly instantaneous as the diffusion constant of H2 in PTFE is of the same order of magnitude as in bulk and thin-film Ta.45
Third, we find that the response times are reduced considerably with increasing pressures. Figure 4a,b displays the pressure dependence of the response time, here defined as the time to reach 90% of the total signal, at room temperature and for PH2 between 0.5 and 10,000 Pa. The variation in response times is considerable: at a pressure of PH2 = 1.0 Pa, the response time of the Pd0.6Au0.4 capping layer with PTFE is about 2.0 × 10² s, while at PH2 = 10,000 Pa, it has reduced to about 0.3 s.
Figure 4.

Hydrogen absorption kinetics of 40 nm Ta thin films capped
with
10 nm Pd1–yAuy at T = 28 °C. Hydrogen pressure dependence
of the response time (a) without and (b) with a 30 nm PTFE layer on
top of the capping layer. The solid lines indicate fits to a power
law ( ). The response
time is defined as the time
to reach 90% of the total signal in Figure 3. (c) Pressure dependence of the hydrogen
absorption rate R computed according to eq 1. The solid lines indicate fits
to a power law (
). The response
time is defined as the time
to reach 90% of the total signal in Figure 3. (c) Pressure dependence of the hydrogen
absorption rate R computed according to eq 1. The solid lines indicate fits
to a power law ( ) for which the exponents γ are reported
in Table 1.
) for which the exponents γ are reported
in Table 1.
To further study the hydrogen absorption kinetics and to identify the rate-limiting step in the hydrogen absorption, we consider the hydrogen sorption rate R instead of the response times in Figure 4c. When the kinetics are purely surface-limited and the hydrogen dissociation and/or the transport of hydrogen from the surface to the subsurface are the rate-limiting step(s), the rate is proportional to the applied pressure (R ∝ PH2), whereas if the kinetics are solely dictated by diffusion, R ∝ PH2 (see, e.g., refs (46)–474849). If the rate is limited by a combination of the two, the exponent will be between 0.5 and 1.0.
We compute the reaction rate from the response times t90, the thickness of the Ta layer d, and the difference in hydrogenation of the TaHx layer Δx obtained from previous neutron reflectometry experiments22 according to
| 1 |
where ρ and M are the experimentally determined density and molar mass of the Ta thin film, respectively.
The exponents of the power law  that are fitted to the data are reported
in Table 1 and take values of γ ≈ 0.7 for Pd and
γ ≈ 0.9 for Pd0.6Au0.4 and Pd0.5Au0.5 at room temperature. From these values,
we conclude that especially for Pd, the hydrogen sorption is limited
both by surface and diffusion effects, whereas especially for the
Pd0.6Au0.4- and Pd0.5Au0.5-capped samples, the rate is limited predominately by surface effects.
As such, the results indicate that the diffusion of hydrogen through
Pd1–yAuy can, possibly as a result of the increased hydrogen solubility at
lower pressures and the increased unit cell, be significantly enhanced
as compared with Pd.
that are fitted to the data are reported
in Table 1 and take values of γ ≈ 0.7 for Pd and
γ ≈ 0.9 for Pd0.6Au0.4 and Pd0.5Au0.5 at room temperature. From these values,
we conclude that especially for Pd, the hydrogen sorption is limited
both by surface and diffusion effects, whereas especially for the
Pd0.6Au0.4- and Pd0.5Au0.5-capped samples, the rate is limited predominately by surface effects.
As such, the results indicate that the diffusion of hydrogen through
Pd1–yAuy can, possibly as a result of the increased hydrogen solubility at
lower pressures and the increased unit cell, be significantly enhanced
as compared with Pd.
Table 1. Fitted Exponents
γ of the Fit
of the Power Law  to the Pressure Dependence of the Hydrogen
Absorption Rate Ra.
to the Pressure Dependence of the Hydrogen
Absorption Rate Ra.
| No PTFE |
PTFE |
|||||||
|---|---|---|---|---|---|---|---|---|
| 28 °C | 60 °C | 90 °C | 120 °C | 28 °C | 60 °C | 90 °C | 120 °C | |
| Pd | 0.71 | 0.89 | 1.00 | 1.02 | 0.74 | 0.98 | 1.05 | 1.17 |
| Pd0.7Au0.3 | 0.84 | 0.86 | 0.99 | 1.09 | 0.73 | 0.93 | 1.04 | 1.14 |
| Pd0.6Au0.4 | 0.91 | 0.90 | 1.07 | 1.12 | 0.73 | 0.90 | 1.04 | 1.14 |
| Pd0.5Au0.5 | 0.87 | 0.87 | 1.02 | 1.10 | 0.63 | 0.79 | 0.98 | 1.12 |
| Ni | 0.67 | 0.63 | 0.78 | 0.88 | 0.66 | 0.65 | 0.87 | 0.97 |
| Pt | 0.75 | 0.53 | 0.63 | 0.64 | 0.70 | 0.51 | 0.63 | 0.65 |
| Ru | 0.64 | 0.64 | ||||||
The kinetics accelerate
at increasing temperatures. Figure 5 shows that the response times
decrease substantially with increasing temperature. Comparing data
at T = 60 °C to that at T =
28 °C, we find for the best-performing sample, Pd0.6Au0.4 with PTFE, and at a pressure PH2 = 250 Pa, a reduction from t90 = 6.9 to 2.4 s. This is reflected in the hydrogen sorption
rates displayed in Figure 6, for which we find an increase of about a factor two per
30 °C for all samples. Also, at elevated temperatures, the pressure
dependence for all samples can be satisfactory described by the power
law  . For all elevated temperatures
of T > 60 °C and all Pd1–yAuy compositions studied,
the exponents
take values of γ ≈ 1 while at T = 120
°C, the values slightly exceed one. As such, it indicates that
the hydrogen uptake is limited by the surface reaction, suggesting
that diffusion is enhanced considerably at elevated temperatures and
is not limiting the sorption rates.
. For all elevated temperatures
of T > 60 °C and all Pd1–yAuy compositions studied,
the exponents
take values of γ ≈ 1 while at T = 120
°C, the values slightly exceed one. As such, it indicates that
the hydrogen uptake is limited by the surface reaction, suggesting
that diffusion is enhanced considerably at elevated temperatures and
is not limiting the sorption rates.
Figure 5.

Hydrogen pressure dependence of the hydrogen
absorption response
times of 40 nm Ta thin films capped with 10 nm Pd1–yAuy at (a,d) T = 60, (b,e) 90, and (c,f) 120 °C (a–c) without
and (d–f) with a 30 nm PTFE layer on top of the capping layer.
The solid lines indicate fits to a power law ( ). The response
time is defined as the time
to reach 90% of the total signal in Figure 3.
). The response
time is defined as the time
to reach 90% of the total signal in Figure 3.
Figure 6.

Hydrogen
pressure dependence of the hydrogen absorption rate of
40 nm Ta thin films capped with 10 nm Pd1–yAuy at (a,d) T = 60, (b,e) 90, and (c,f) 120 °C (a–c) without and (d–f)
with a 30 nm PTFE layer on top of the capping layer. The hydrogen
absorption rate R is computed according to eq 1. The solid lines indicate
fits to a power law ( ) for which the exponents γ are reported
in Table 1.
) for which the exponents γ are reported
in Table 1.
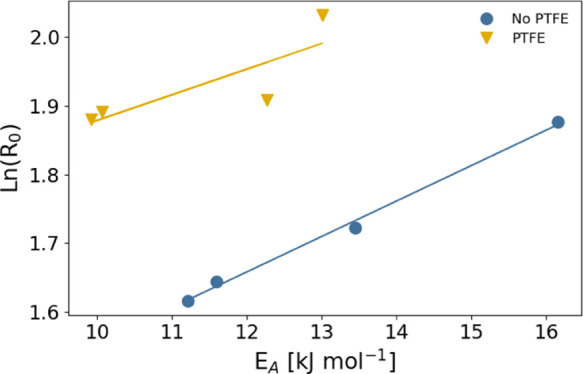
To extract the activation energy barriers from the temperature dependence of the hydrogenation rates, we display in Figure 7 the so-called Arrhenius plots of the absorption rates at a constant hydrogen pressure of PH2 = 700 Pa for the Pd1–yAuy capping layers. The temperature dependence of the rates is well-described using the Arrhenius function
| 2 |
where EA is the apparent activation energy, R0 is a constant, and kB is the Boltzmann’s constant. For bare Pd, we find an apparent activation energy of EA = 16 kJ mol–1, of a similar magnitude as the value reported for Pd nanoparticles deposited on a glass support of 20 kJ mol–1.50
Figure 7.

Arrhenius plots of the hydrogen absorption rate at PH2 = 700 Pa of 40 nm Ta thin films capped with 10 nm Pd1–yAuy (a) without and (b) with a 30 nm PTFE layer on top of the capping layer. The solid lines indicate fits to the Arrhenius equation of eq 2 and the numbers indicate the apparent activation energy obtained from the fits.
The activation energies, tabulated in Table 2, show two important trends. First of all, consistent with previous research,28,33 the activation energy decreases with increasing Au concentration. Compared with Pd, the activation energy is reduced by about 25% to 12 kJ mol–1 for Pd0.6Au0.4 and Pd0.5Au0.5. Second, in accordance with the observation that PTFE can significantly shorten the response times, the activation energy of all layers with PTFE is reduced by about 2 kJ mol–1. Consistent with our previous measurements, the best-performing capping layer Pd0.6Au0.4 with PTFE has the lowest activation energy of only 10 kJ mol–1.
Table 2. Apparent Activation Energy EA and Prefactor R0 Obtained by Fitting the Temperature Dependence of the Hydrogen Absorption Rate R to the Arrhenius Equation of eq 2a.
|
EA [kJ mol–1] |
R0 [atoms nm–2 s–1] |
|||
|---|---|---|---|---|
| No PTFE | PTFE | No PTFE | PTFE | |
| Pd | 16 | 13 | 6.5 | 7.6 |
| Pd0.7Au0.3 | 13 | 10 | 5.6 | 6.6 |
| Pd0.6Au0.4 | 12 | 10 | 5.2 | 6.6 |
| Pd0.5Au0.5 | 12 | 12 | 5.0 | 6.7 |
| Ni | 16 | 16 | 6.5 | 6.6 |
| Pt | 18 | 18 | 5.8 | 5.9 |
The prefactor R0 in the Arrhenius equation also indicates two trends. First of all, it tends to be higher for the PTFE-based layers, which is consistent with the fact that the layers with an additional PTFE layer show higher hydrogenation rates. Second, there seems to be an inverse relation between the apparent activation energy and R0. This implies that a higher apparent activation energy is (partly) compensated by a higher prefactor. This so-called compensation effect has been observed for many systems in catalysis including in metal hydrides48,51−53 and follows the following relation
| 3 |
To further analyze the compensation effect, we plot in Figure 8EA versus ln R0. The data are consistent with the compensation effect for both the samples with and without a PTFE layer; however, given the limited number of data points and the small variation of both R0 and EA, the analysis should be interpreted with the necessary precautions.
Figure 8.
Constable plot to investigate the presence of the compensation effect in 40 nm Ta thin films capped with 10 nm Pd1–yAuy without and with a 30 nm PTFE layer on top of the capping layer. The prefactors ln R0 and apparent activation energies EA are extracted from the Arrhenius fits (eq 2) displayed in Figure 7 and are tabulated in Table 2. The solid lines indicate fits to eq 3.
3.2. Non-Pd-Based Capping Layers
Next, we consider the capping layers that are based on elements different from Pd, that is, Ni, Pt, and Ru, all materials that hardly hydrogenate under moderate conditions. Exemplary response time measurements at room temperature for Ni and Pt with and without a PTFE capping layer are displayed in Figure 9, the corresponding response times in Figure 10, and the computed reaction rates in Figure 11.
Figure 9.

Normalized optical transmissions showing the absorption kinetics of a 40 nm Ta thin film with a 4 nm Ti adhesion layer capped with a 10 nm Ni (a,b) and Pt (c,d) layer to a series of pressure steps between PH2 = 0.5 102 Pa and the partial hydrogen pressure indicated. The samples in (b,d) are covered with a 30 nm PTFE layer.
Figure 10.

Hydrogen
pressure dependence of the hydrogen absorption response
times of 40 nm Ta thin films capped with 10 nm Ni, Pt, Ru, and Pd0.6Au0.4 at (a) T = 28, (b) 60,
(c) 90, and (d) 120 °C without and with a 30 nm PTFE layer on
top of the capping layer. The response time is defined as the time
to reach 90% of the total signal in Figure 3. The solid lines indicate fits to a power
law ( ) for which the exponents γ are reported
in Table 1.
) for which the exponents γ are reported
in Table 1.
Figure 11.

Hydrogen pressure dependence of the hydrogen absorption rate of
40 nm Ta thin films capped with 10 nm Ni, Pt, Ru, and Pd0.6Au0.4 at (a) T = 28, (b) 60, (c) 90,
and (d) 120 °C without and with a 30 nm PTFE layer on top of
the capping layer. The hydrogen absorption rate R is computed according to eq 1. The solid lines indicate fits to a power law ( ) for which the exponents γ are reported
in Table 1.
) for which the exponents γ are reported
in Table 1.
Based on these figures, we draw two important conclusions. First, we find that the response times of Ni, Pt, and Ru are much longer than those for all Pd-based materials. While the room-temperature response times of Ni are about 50–300% longer than Pd, the response times of Pt are about a factor 20 longer (largely depends on pressure), and no complete response was found at room temperature for Ru within 1 h. These trends persist at elevated temperatures. For example, at T = 60 °C and for a pressure of PH2 = 700 Pa, the response times are 30 s, 8 × 10² s, and 2 × 10³ s for Ni, Pt, and Ru, respectively, while the same response is achieved within 5 s for the fastest material studied, Pd0.6Au0.4.
The longer response times of Ni, Pt, and Ru as compared
with the
Pd-based materials may stem from surface effects such as a slower
dissociation of hydrogen and a sluggish transport of hydrogen from
the surface to the subsurface and/or from slower diffusion of hydrogen
through the capping layer. To study this, we consider the pressure
and temperature dependence of the hydrogen absorption rates. The pressure
dependence of the rates can, as for the Pd-based materials, be described
by the power law  . The corresponding fits to the data are
indicated in Figure 11 and the exponents γ are tabulated in Table 1. The most striking observation is that the
exponents are, regardless of temperature, much lower than that for
the Pd-based materials. Indeed, we find exponents at T = 60 °C of about γ ≈ 0.5–0.6, much lower
than γ = 0.9 for Pd and Pd1–yAuy alloys. As the exponents for Ni,
Pt, and Ru are relatively low and reasonably close to 0.5, this indicates
that the kinetics are largely limited by the diffusion of hydrogen
through the capping layer. As such, the long response times of these
materials at room temperature may not come as a complete surprise:
The diffusion constant of hydrogen in Ru of 2 × 10–19 m2 s–1 is at room temperature about
four orders of magnitude smaller than in Pd thin films.54,55 While diffusion data on thin films of Ni are to the best of our
knowledge unknown, the values reported for bulk suggest that they
are of a similar order of magnitude at elevated temperature but that
diffusion is at room temperature in Ni substantially slower than in
Pd.56−59
. The corresponding fits to the data are
indicated in Figure 11 and the exponents γ are tabulated in Table 1. The most striking observation is that the
exponents are, regardless of temperature, much lower than that for
the Pd-based materials. Indeed, we find exponents at T = 60 °C of about γ ≈ 0.5–0.6, much lower
than γ = 0.9 for Pd and Pd1–yAuy alloys. As the exponents for Ni,
Pt, and Ru are relatively low and reasonably close to 0.5, this indicates
that the kinetics are largely limited by the diffusion of hydrogen
through the capping layer. As such, the long response times of these
materials at room temperature may not come as a complete surprise:
The diffusion constant of hydrogen in Ru of 2 × 10–19 m2 s–1 is at room temperature about
four orders of magnitude smaller than in Pd thin films.54,55 While diffusion data on thin films of Ni are to the best of our
knowledge unknown, the values reported for bulk suggest that they
are of a similar order of magnitude at elevated temperature but that
diffusion is at room temperature in Ni substantially slower than in
Pd.56−59
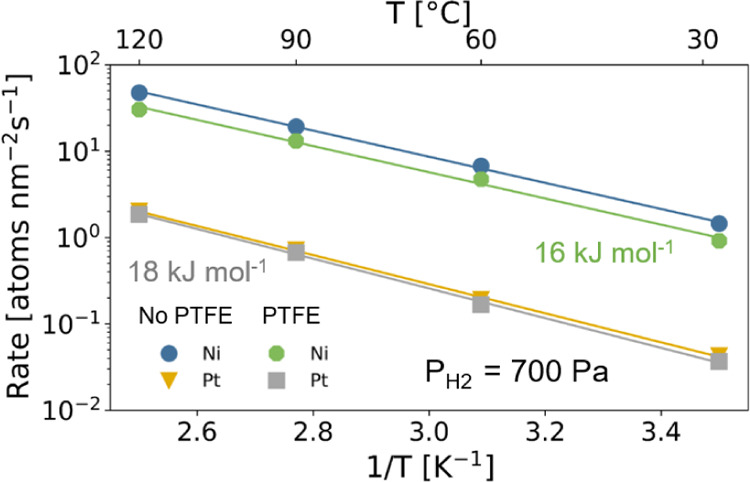
In Figure 12, we display the Arrhenius plots of the absorption rates at a constant hydrogen pressure of PH2 = 700 Pa for Ni and Pt. The temperature dependence of the rates are well-described using the Arrhenius function (eq 2), from which we obtain values of the apparent activation energy of EA = 16 and 18 kJ mol–1 for Ni and Pt, respectively. Thus, the activation energy of Ni is comparable to the activation energy of Pd while the one of Pt is slightly larger. Although the difference in activation energy is small, these results may suggest that the slower kinetics in Pt may thus in part be explained by the larger activation energy of the hydrogen dissociation process or the transport of hydrogen atoms from the surface to the subsurface. Most remarkable is that these activation energies are much smaller than the activation energy of hydrogen diffusion in the bulk metal of around 40 kJ mol–1 for Ni.60,61 This points in the direction that the actual microstructure of the capping layers has a substantial effect, as also hinted by the kinetics of the Ni-capped samples being accelerated substantially after precycling the sample (see the Sample Preparation and Characterization). This calls for further research in this direction.
Figure 12.
Arrhenius plots of the hydrogen absorption rate at PH2 = 700 Pa of 40 nm Ta thin films capped with 10 nm Ni and Pt with and without a 30 nm PTFE layer on top of the capping layer. The solid lines indicate fits to the Arrhenius equation of eq 2 and the numbers indicate the apparent activation energy obtained from the fits.
Second, Figures 9, 10, and 11 show that unlike for the Pd-based capping materials, the PTFE layer hardly affects the response times. Consistently, we find that the activation energies of Ni and Pt are not affected by the presence of PTFE (Figure 12). In the literature, the hydrogenation kinetics enhancing effects of PTFE have been suggested to be due to (i) a lower activation energy of hydrogen dissociation for the diffusion of hydrogen atoms from the surface to subsurface as a result of the formation of Pd–C bonds or (ii) to more active sites on the surface remaining available to dissociate the hydrogen.26−28 Consistent with the first explanation, we find that the activation energy is only reduced for Pd-based capping layers and not for Ni and Pt.
The modifications of the (sub)surface of Pd and Pt by the application of PTFE are confirmed by XPS measurements shown in Figure 13. Consistent with previous reports on PTFE-coated Pd,26,28 a shift in binding energy of the 3d5/2 peak from 335.0 eV for Pd to 335.5 eV for the PTFE-capped sample is observed, which is indicative of the formation of Pd–C bonds.26,28,62 In addition, a second 3d5/2 peak at around EBin ≈ 337.7 eV emerges for the PTFE-capped Pd layer, which indicates the formation of Pd–F bonds.26,63 For Pt, a broad second 4f7/2 peak emerges at EBin ≈ 75 eV, indicative of Pt-halide bonds such as Pt–F.64 Unfortunately, the presence of Pt–C bonds cannot be unambiguously detected owing to the fact that the binding energy of this bond is similar to the one of the metallic states of Pt. In sum, although XPS indicates that the (sub)surface of Pt is altered by the presence of PTFE, the activation energy and response times are not affected.
Figure 13.

XPS results of the 40 nm Ta thin films capped with a 4 nm Ti adhesion layer and capped with a 10 nm capping layer after exposure to hydrogen of (a) Pd and (b) Pt with and without a 30 nm PTFE layer. The counts for the samples with PTFE are multiplied by a factor of 200.
In addition, we find empirical support for the fact that PTFE ensures that more active sites on the surface remain available to dissociate the hydrogen. Our results indicate that the prefactor R0 of the Arrhenius equation of eq 2 as tabulated in Table 2 is for all the Pd-based capping layers about 20% larger for the layers covered with PTFE than the ones without an additional PTFE layer. Consistent with the fact that PTFE does not enhance the kinetics of the Pt- and Ni-capped samples, no effect of the PTFE layer is observed on R0 for these samples. In sum, the result thus indicates that the enhancement of the hydrogenation kinetics is thus both due to the reduction of the activation energy and the effect that PTFE ensures that more active sites remain available.
4. Conclusions
In summary, we systematically studied the hydrogenation kinetics of catalyzing capping layers made of several alloys of Pd and Au as well as single elements Pt, Ni, and Ru by exploiting the profound changes in optical transmission of capped Ta thin films. Our results demonstrate that doping Pd with Au results in significantly faster hydrogenation kinetics, with response times up to five times shorter than Pd through enhanced diffusion and a reduction in the activation energy. Detailed analysis of the pressure and temperature dependence of the reaction rates reveals that the hydrogen dissociation at the surface is the rate-limiting step for the Pd-based materials. The kinetics of non-Pd-based materials turn out to be significantly slower and mainly limited by the diffusion through the capping layer itself. Surprisingly, PTFE was only found to improve the kinetics of Pd-based capping materials and had no significant effect on the kinetics of Pt, Ni, and Ru. As such, these results aid in rationally choosing a suitable capping material for the application of metal hydrides in a green economy. In a wider perspective, the method developed in this paper can be used to simultaneously study the hydrogenation kinetics in thin-film materials for a wide set of experimental conditions.
Acknowledgments
We thank Bernard Dam for fruitful discussions and comments. Marcel Bus is kindly acknowledged for the AFM measurements.
Supporting Information Available
The Supporting Information is available free of charge at https://pubs.acs.org/doi/10.1021/acsami.1c13240.
Spectrum of the LED lights used for the optical measurements, XRR measurements of the as-prepared films, fitted layer thickness, density, and roughness σ of the as-prepared as obtained by XRR measurements, AFM measurements of the as-prepared films, XRD measurements of the as-prepared films, C 1s and F 1s XPS spectra of the PTFE-capped samples, and C 1s, O 1s, and F 1s XPS spectra of a Pd-capped film with a PTFE layer before and after exposure to hydrogen (PDF)
The authors declare no competing financial interest.
Supplementary Material
References
- Brandon N. P.; Kurban Z. Clean Energy and the Hydrogen Economy. Philos. Trans. R. Soc., A 2017, 375, 20160400. 10.1098/rsta.2016.0400. [DOI] [PMC free article] [PubMed] [Google Scholar]
- Hydrogen to the Rescue. Nat. Mater. 2020, 17, 565. 10.1038/s41563-018-0129-y [DOI] [PubMed] [Google Scholar]
- Abe J. O.; Popoola A. P. I.; Ajenifuja E.; Popoola O. M. Hydrogen Energy, Economy and Storage: Review and Recommendation. Int. J. Hydrogen Energy 2019, 44, 15072–15086. 10.1016/j.ijhydene.2019.04.068. [DOI] [Google Scholar]
- Glenk G.; Reichelstein S. Economics of Converting Renewable Power to Hydrogen. Nat. Energy 2019, 4, 216–222. 10.1038/s41560-019-0326-1. [DOI] [Google Scholar]
- Rusman N. A. A.; Dahari M. A Review on the Current Progress of Metal Hydrides Material for Solid-State Hydrogen Storage Applications. Int. J. Hydrogen Energy 2016, 41, 12108–12126. 10.1016/j.ijhydene.2016.05.244. [DOI] [Google Scholar]
- Schneemann A.; White J. L.; Kang S.; Jeong S.; Wan L. F.; Cho E. S.; Heo T. W.; Prendergast D.; Urban J. J.; Wood B. C.; Allendorf M. D.; Stavila V. Nanostructured Metal Hydrides for Hydrogen Storage. Chem. Rev. 2018, 118, 10775–10839. 10.1021/acs.chemrev.8b00313. [DOI] [PubMed] [Google Scholar]
- Bannenberg L. J.; et al. Metal (boro-) Hydrides for High Energy Density Storage and Relevant Emerging Technologies. Int. J. Hydrogen Energy 2020, 45, 33687–33730. 10.1016/j.ijhydene.2020.08.119. [DOI] [Google Scholar]
- Huiberts J. N.; Griessen R.; Rector J. H.; Wijngaarden R. J.; Dekker J. P.; De Groot D. G.; Koeman N. J. Yttrium and Lanthanum Hydride Films with Switchable Optical Properties. Nature 1996, 380, 231–234. 10.1038/380231a0. [DOI] [Google Scholar]
- Maiorov V. A. Metal Hydride Switchable Mirrors (Review). Opt Spectrosc. 2020, 128, 148–165. 10.1134/s0030400x20010154. [DOI] [Google Scholar]
- Nishimura C.; Komaki M.; Hwang S.; Amano M. V-Ni alloy membranes for hydrogen purification. J. Alloys Compd. 2002, 330–332, 902–906. 10.1016/s0925-8388(01)01648-6. [DOI] [Google Scholar]
- Dolan M. D.; Viano D. M.; Langley M. J.; Lamb K. E. Tubular Vanadium Membranes for Hydrogen Purification. J. Membr. Sci. 2018, 549, 306–311. 10.1016/j.memsci.2017.12.031. [DOI] [Google Scholar]
- Zhao M.; Sloof W. G.; Böttger A. J. Modelling of Surface Segregation for Palladium Alloys in Vacuum and Gas Environments. Int. J. Hydrogen Energy 2018, 43, 2212–2223. 10.1016/j.ijhydene.2017.12.039. [DOI] [Google Scholar]
- Lototskyy M. V.; Tolj I.; Pickering L.; Sita C.; Barbir F.; Yartys V. The Use of Metal Hydrides in Fuel Cell Applications. Prog. Nat. Sci.: Mater. Int. 2017, 27, 3–20. 10.1016/j.pnsc.2017.01.008. [DOI] [Google Scholar]
- Hübert T.; Boon-Brett L.; Black G.; Banach U. Hydrogen Sensors–a Review. Sens. Actuators, B 2011, 157, 329–352. 10.1016/j.snb.2011.04.070. [DOI] [Google Scholar]
- Wadell C.; Syrenova S.; Langhammer C. Plasmonic Hydrogen Sensing with Nanostructured Metal Hydrides. ACS Nano 2014, 8, 11925–11940. 10.1021/nn505804f. [DOI] [PubMed] [Google Scholar]
- Bannenberg L. J.; Boelsma C.; Asano K.; Schreuders H.; Dam B. Metal Hydride Based Optical Hydrogen Sensors. J. Phys. Soc. Jpn. 2020, 89, 051003. 10.7566/jpsj.89.051003. [DOI] [Google Scholar]
- Darmadi I.; Nugroho F. A. A.; Langhammer C. High-Performance Nanostructured Palladium-Based Hydrogen Sensors—Current Limitations and Strategies for Their Mitigation. ACS Sens. 2020, 5, 3306–3327. 10.1021/acssensors.0c02019. [DOI] [PMC free article] [PubMed] [Google Scholar]
- Koo W.-T.; Cho H.-J.; Kim D.-H.; Kim Y. H.; Shin H.; Penner R. M.; Kim I.-D. Chemiresistive Hydrogen Sensors: Fundamentals, Recent Advances, and Challenges. ACS Nano 2020, 14, 14284–14322. 10.1021/acsnano.0c05307. [DOI] [PubMed] [Google Scholar]
- Chen K.; Yuan D.; Zhao Y. Review of Optical Hydrogen Sensors Based on Metal Hydrides: Recent Developments and Challenges. Opt Laser. Technol. 2021, 137, 106808. 10.1016/j.optlastec.2020.106808. [DOI] [Google Scholar]
- Slaman M.; Dam B.; Pasturel M.; Borsa D. M.; Schreuders H.; Rector J. H.; Griessen R. Fiber Optic Hydrogen Detectors Containing Mg-Based Metal Hydrides. Sens. Actuators, B 2007, 123, 538–545. 10.1016/j.snb.2006.09.058. [DOI] [Google Scholar]
- Boelsma C.; Bannenberg L. J.; van Setten M. J.; Steinke N.-J.; Van Well A. A.; Dam B. Hafnium—an Optical Hydrogen Sensor Spanning Six Orders in Pressure. Nat. Commun. 2017, 8, 15718. 10.1038/ncomms15718. [DOI] [PMC free article] [PubMed] [Google Scholar]
- Bannenberg L. J.; Boelsma C.; Schreuders H.; Francke S.; Steinke N. J.; Van Well A. A.; Dam B. Optical Hydrogen Sensing Beyond Palladium: Hafnium and Tantalum as Effective Sensing Materials. Sens. Actuators, B 2019, 283, 538–548. 10.1016/j.snb.2018.12.029. [DOI] [Google Scholar]
- Bannenberg L.; Schreuders H.; Dam B. Tantalum-Palladium: Hysteresis-Free Optical Hydrogen Sensor over 7 Orders of Magnitude in Pressure with Sub-Second Response. Adv. Funct. Mater. 2021, 31, 2010483. 10.1002/adfm.202010483. [DOI] [Google Scholar]
- Antolini E. Palladium in Fuel Cell Catalysis. Energy Environ. Sci. 2009, 2, 915–931. 10.1039/b820837a. [DOI] [Google Scholar]
- Holton O. T.; Stevenson J. W. The Role of Platinum in Proton Exchange Membrane Fuel Cells. Platin. Met. Rev. 2013, 57, 259–271. 10.1595/147106713x671222. [DOI] [Google Scholar]
- Ngene P.; Westerwaal R. J.; Sachdeva S.; Haije W.; de Smet L. C. P. M.; Dam B. Polymer-Induced Surface Modifications of Pd-based Thin Films Leading to Improved Kinetics in Hydrogen Sensing and Energy Storage Applications. Angew. Chem., Int. Ed. 2014, 53, 12081–12085. 10.1002/anie.201406911. [DOI] [PubMed] [Google Scholar]
- Delmelle R.; Ngene P.; Dam B.; Bleiner D.; Borgschulte A. Promotion of Hydrogen Desorption from Palladium Surfaces by Fluoropolymer Coating. ChemCatChem 2016, 8, 1646–1650. 10.1002/cctc.201600168. [DOI] [Google Scholar]
- Nugroho F. A. A.; Darmadi I.; Cusinato L.; Susarrey-Arce A.; Schreuders H.; Bannenberg L. J.; da Silva Fanta A. B.; Kadkhodazadeh S.; Wagner J. B.; Antosiewicz T. J.; Hellman A.; Zhdanov V. P.; Dam B.; Langhammer C. Metal-Polymer Hybrid Nanomaterials for Plasmonic Ultrafast Hydrogen Detection. Nat. Mater. 2019, 18, 489–495. 10.1038/s41563-019-0325-4. [DOI] [PubMed] [Google Scholar]
- Pivak Y.; Gremaud R.; Gross K.; Gonzalezsilveira M.; Walton A.; Book D.; Schreuders H.; Dam B.; Griessen R. Effect of the Substrate on the Thermodynamic Properties of PdHx Films Studied by Hydrogenography. Scr. Mater. 2009, 60, 348–351. 10.1016/j.scriptamat.2008.11.012. [DOI] [Google Scholar]
- Pivak Y.; Schreuders H.; Slaman M.; Griessen R.; Dam B. Thermodynamics, Stress Release and Hysteresis Behavior in Highly Adhesive Pd–H Films. Int. J. Hydrogen Energy 2011, 36, 4056–4067. 10.1016/j.ijhydene.2010.12.063. [DOI] [Google Scholar]
- Luo S.; Wang D.; Flanagan T. B. Thermodynamics of Hydrogen in Fcc Pd-Au Alloys. J. Phys. Chem. B 2010, 114, 6117–6125. 10.1021/jp100858r. [DOI] [PubMed] [Google Scholar]
- Bannenberg L. J.; Nugroho F. A. A.; Schreuders H.; Norder B.; Trinh T. T.; Steinke N.-J.; Van Well A. A.; Langhammer C.; Dam B. Direct Comparison of PdAu Alloy Thin Films and Nanoparticles upon Hydrogen Exposure. ACS Appl. Mater. Interfaces 2019, 11, 15489–15497. 10.1021/acsami.8b22455. [DOI] [PMC free article] [PubMed] [Google Scholar]
- Namba K.; Ogura S.; Ohno S.; Di W.; Kato K.; Wilde M.; Pletikosić I.; Pervan P.; Milun M.; Fukutani K. Acceleration of Hydrogen Absorption by Palladium through Surface Alloying with Gold. Proc. Natl. Acad. Sci. U.S.A. 2018, 115, 7896–7900. 10.1073/pnas.1800412115. [DOI] [PMC free article] [PubMed] [Google Scholar]
- Fukai Y.The Metal-Hydrogen System: Basic Bulk Properties; Springer Science & Business Media, 2006; Vol. 21. [Google Scholar]
- Gremaud R.; Broedersz C. P.; Borsa D. M.; Borgschulte A.; Mauron P.; Schreuders H.; Rector J. H.; Dam B.; Griessen R. Hydrogenography: An Optical Combinatorial Method To Find New Light-Weight Hydrogen-Storage Materials. Adv. Mater. 2007, 19, 2813–2817. 10.1002/adma.200602560. [DOI] [Google Scholar]
- Bannenberg L. J.; Schreuders H.; van Eijck L.; Heringa J. R.; Steinke N.-J.; Dalgliesh R.; Dam B.; Mulder F. M.; van Well A. A. Impact of Nanostructuring on the Phase Behavior of Insertion Materials: The Hydrogenation Kinetics of a Magnesium Thin Film. J. Phys. Chem. C 2016, 120, 10185–10191. 10.1021/acs.jpcc.6b02302. [DOI] [Google Scholar]
- Björck M.; Andersson G. GenX: an Extensible X-ray Reflectivity Refinement Program Utilizing Differential Evolution. J. Appl. Crystallogr. 2007, 40, 1174–1178. 10.1107/s0021889807045086. [DOI] [Google Scholar]
- Westerwaal R. J.; Rooijmans J. S. A.; Leclercq L.; Gheorghe D. G.; Radeva T.; Mooij L.; Mak T.; Polak L.; Slaman M.; Dam B.; Rasing T. Nanostructured Pd-Au Based Fiber Optic Sensors for Probing Hydrogen Concentrations in Gas Mixtures. Int. J. Hydrogen Energy 2013, 38, 4201–4212. 10.1016/j.ijhydene.2012.12.146. [DOI] [Google Scholar]
- Wadell C.; Nugroho F. A. A.; Lidström E.; Iandolo B.; Wagner J. B.; Langhammer C. Hysteresis-Free Nanoplasmonic Pd–Au Alloy Hydrogen Sensors. Nano Lett. 2015, 15, 3563–3570. 10.1021/acs.nanolett.5b01053. [DOI] [PubMed] [Google Scholar]
- Nugroho F. A. A.; Darmadi I.; Zhdanov V. P.; Langhammer C. Universal Scaling and Design Rules of Hydrogen Induced Optical Properties in Pd and Pd-Alloy Nanoparticles. ACS Nano 2018, 12, 9903–9912. 10.1021/acsnano.8b02835. [DOI] [PubMed] [Google Scholar]
- Feenstra R.; de Bruin-Hordijk G. J.; Bakker H. L. M.; Griessen R.; de Groot D. G. Critical Point Lowering in Thin PdHx Films. J. Phys. F Met. Phys. 1983, 13, L13. 10.1088/0305-4608/13/2/001. [DOI] [Google Scholar]
- Pundt A.; Kirchheim R. Hydrogen in Metals: Microstructural Aspects. Annu. Rev. Mater. Res. 2006, 36, 555–608. 10.1146/annurev.matsci.36.090804.094451. [DOI] [Google Scholar]
- Wagner S.; Pundt A. Quasi-Thermodynamic Model on Hydride Formation in Palladium–Hydrogen Thin Films: Impact of Elastic and Microstructural Constraints. Int. J. Hydrogen Energy 2016, 41, 2727–2738. 10.1016/j.ijhydene.2015.11.063. [DOI] [Google Scholar]
- Burlaka V.; Wagner S.; Hamm M.; Pundt A. Suppression of Phase Transformation in Nb–H Thin Films below Switchover Thickness. Nano Lett. 2016, 16, 6207–6212. 10.1021/acs.nanolett.6b02467. [DOI] [PubMed] [Google Scholar]
- Sebők B.; Schülke M.; Réti F.; Kiss G. Diffusivity, Permeability and Solubility of H2, Ar, N2, and CO2 in Poly(tetrafluoroethylene) between Room Temperature and 180 C. Polym. Test. 2016, 49, 66–72. 10.1016/j.polymertesting.2015.10.016. [DOI] [Google Scholar]
- Uchida H.; Fromm E. Kinetics of Hydrogen Absorption of Titanium/Metal (Vanadium, Chromium, Manganese, Iron, Nickel) Sandwich Films with and without Oxygen Precoverage at 300 K. J. Less Common. Met. 1987, 131, 125–132. 10.1016/0022-5088(87)90508-x. [DOI] [Google Scholar]
- Schweppe F.; Martin M.; Fromm E. Model on Hydride Formation Describing Surface Control, Diffusion Control and Transition Regions. J. Alloys Compd. 1997, 261, 254–258. 10.1016/s0925-8388(97)00192-8. [DOI] [Google Scholar]
- Borgschulte A.; Westerwaal R.; Rector J.; Schreuders H.; Dam B.; Griessen R. Catalytic Activity of Noble Metals Promoting Hydrogen Uptake. J. Catal. 2006, 239, 263–271. 10.1016/j.jcat.2006.01.031. [DOI] [Google Scholar]
- Borgschulte A.; Gremaud R. F. A.; Griessen R. P. Interplay of Diffusion and Dissociation Mechanisms during Hydrogen Absorption in Metals. Phys. Rev. B: Condens. Matter Mater. Phys. 2008, 78, 094106. 10.1103/physrevb.78.094106. [DOI] [Google Scholar]
- Stolaś A.; Darmadi I.; Nugroho F. A. A.; Moth-Poulsen K.; Langhammer C. Impact of Surfactants and Stabilizers on Palladium Nanoparticle–Hydrogen Interaction Kinetics: Implications for Hydrogen Sensors. ACS Appl. Nano Mater. 2020, 3, 2647–2653. 10.1021/acsanm.0c00020. [DOI] [Google Scholar]
- Constable F. H. The Mechanism of Catalytic Decomposition. Proc. R. Soc. Lond.–Ser. A Contain. Pap. a Math. Phys. Character 1925, 108, 355–378. 10.1098/rspa.1925.0081. [DOI] [Google Scholar]
- Lynggaard H.; Andreasen A.; Stegelmann C.; Stoltze P. Analysis of Simple Kinetic Models in Heterogeneous Catalysis. Prog. Surf. Sci. 2004, 77, 71–137. 10.1016/j.progsurf.2004.09.001. [DOI] [Google Scholar]
- Andreasen A.; Vegge T.; Pedersen A. S. Compensation Effect in the Hydrogenation/Dehydrogenation Kinetics of Metal Hydrides. J. Phys. Chem. B 2005, 109, 3340–3344. 10.1021/jp0458755. [DOI] [PubMed] [Google Scholar]
- Li Y.; Cheng Y.-T. Hydrogen Diffusion and Solubility in Palladium Thin Films. Int. J. Hydrogen Energy 1996, 21, 281–291. 10.1016/0360-3199(95)00094-1. [DOI] [Google Scholar]
- Soroka O.; Sturm J. M.; Lee C. J.; Schreuders H.; Dam B.; Bijkerk F. Hydrogen Diffusion through Ru Thin Films. Int. J. Hydrogen Energy 2020, 45, 15003–15010. 10.1016/j.ijhydene.2020.03.201. [DOI] [Google Scholar]
- Devanathan M. A. V.; Stachurski Z. The Adsorption and Diffusion of Electrolytic Hydrogen in Palladium. Proc. R. Soc. A 1962, 270, 90–102. 10.1098/rspa.1962.0205. [DOI] [Google Scholar]
- Ebisuzaki Y.; Kass W. J.; O’keeffe M. Solubility and Diffusion of Hydrogen and Deuterium in Platinum. J. Chem. Phys. 1968, 49, 3329–3332. 10.1063/1.1670604. [DOI] [Google Scholar]
- Holleck G. L. Diffusion and Solubility of Hydrogen in Palladium and Palladium–Silver alloys. J. Phys. Chem. 1970, 74, 503–511. 10.1021/j100698a005. [DOI] [Google Scholar]
- Louthan M. R. Jr.; Donovan J. A.; Caskey G. R. Jr. Hydrogen Diffusion and Trapping in Nickel. Acta Metall. 1975, 23, 745–749. 10.1016/0001-6160(75)90057-7. [DOI] [Google Scholar]
- Fukai Y.; Sugimoto H. Diffusion of Hydrogen in Metals. Adv. Phys. 1985, 34, 263–326. 10.1080/00018738500101751. [DOI] [Google Scholar]
- Wipf H.Diffusion of Hydrogen in Metals. Hydrogen in metals III; Springer, 1997; Vol. 51–91. [Google Scholar]
- Seriani N.; Mittendorfer F.; Kresse G. Carbon in Palladium Catalysts: A Metastable Carbide. J. Chem. Phys. 2010, 132, 024711. 10.1063/1.3290813. [DOI] [PubMed] [Google Scholar]
- Tressaud A.; Khairoun S.; Touhara H.; Watanabe N. X-ray Photoelectron Spectroscopy of Palladium Fluorides. Z. Anorg. Allg. Chem. 1986, 540, 291–299. 10.1002/zaac.19865400932. [DOI] [Google Scholar]
- Chastain J.; King R. C. Jr. Handbook of X-ray Photoelectron Spectroscopy; Perkin-Elmer Corporation, 1992; Vol. 40, p 221. [Google Scholar]
Associated Data
This section collects any data citations, data availability statements, or supplementary materials included in this article.