

Abstract
Charge detection mass spectrometry is a single particle technique where the masses of individual ions are determined from simultaneous measurements of each ion’s m/z ratio and charge. The ions pass through a conducting cylinder, and the charge induced on the cylinder is detected. The cylinder is usually placed inside an electrostatic linear ion trap so that the ions oscillate back and forth through the cylinder. The resulting time domain signal is analyzed by fast Fourier transformation; the oscillation frequency yields the m/z, and the charge is determined from the magnitudes. The mass resolving power depends on the uncertainties in both quantities. In previous work, the mass resolving power was modest, around 30–40. In this work we report around an order of magnitude improvement. The improvement was achieved by coupling high-accuracy charge measurements (obtained with dynamic calibration) with higher resolution m/z measurements. The performance was benchmarked by monitoring the assembly of the hepatitis B virus (HBV) capsid. The HBV capsid assembly reaction can result in a heterogeneous mixture of intermediates extending from the capsid protein dimer to the icosahedral T = 4 capsid with 120 dimers. Intermediates of all possible sizes were resolved, as well as some overgrown species. Despite the improved mass resolving power, the measured peak widths are still dominated by instrumental resolution. Heterogeneity makes only a small contribution. Resonances were observed in some of the m/z spectra. They result from ions with different masses and charges having similar m/z values. Analogous resonances are expected whenever the sample is a heterogeneous mixture assembled from a common building block.
Graphical Abstract
For more than 50 years there has been an enduring effort to increase the size of the highest molecular weight ions that can be analyzed by mass spectrometry (MS). The development of electrospray and MALDI (matrix-assisted laser desorption/ionization) in the 1980s1,2 opened the door and facilitated studies of large biomolecular complexes.3–8 High molecular weight ions generated by electrospray are highly charged, and in conventional MS, where only the m/z is measured, the charge must be deduced from the charge state envelope in the m/z spectrum. The upper mass limit for conventional MS is realistically less than a megadalton for a typical heterogeneous sample. A number of special cases have been reported where low-heterogeneity, higher molecular weight samples have been analyzed.9–13 In some of these cases, the charge state assignments are aided by prior knowledge of the mass. In other words, the expected mass is used to assign the charge states which are then used to calculate the mass from the m/z. This approach cannot be used when the mass is unknown or for heterogeneous samples. In addition, there are many cases where accurate mass information would be valuable for objects with masses much larger than a megadalton, perhaps even up to a gigadalton and beyond. Examples include viruses, nanoparticles, protein complexes, lipoproteins, exosomes, vaccines, and protein aggregates. To access this high mass regime, several MS-based approaches have been developed where masses are determined for individual ions instead of the ensemble approach of conventional MS.14 These methods fall into two main categories: charge shifting where the m/z is determined for a single ion, the charge is shifted through interaction with a laser beam or a chemical reagent, and then the m/z is remeasured.15–21 These approaches are not well suited to mass measurements for the thousands of ions needed to construct a mass distribution. In the other category, the m/z and charge of each ion are measured simultaneously. The masses are then obtained from the product of the m/z and charge.22–29 Charge detection mass spectrometry (CDMS) is perhaps the most well-known of this second category.30–50
In CDMS, ions pass through a detection cylinder, and while inside they induce a charge on the cylinder that is detected by a charge sensitive amplifier.30 If the cylinder is long enough, the induced charge is independent of the ion’s trajectory through the cylinder, and an accurate measure of the charge can be obtained.51,52 In single pass CDMS, the ions travel through the cylinder once.31 The m/z is determined from the flight time through the cylinder, and the charge is determined from the amplitude of the induced signal. The induced signal is small (equal to the charge on the ion) and inherently noisy. The noise is the main source of uncertainty in the charge measurements. The single pass approach is restricted to highly charged ions, and the mass resolving power is usually in the single digits because of high uncertainties in the charge and m/z measurements, both of which contribute to the uncertainty in the mass.
The performance of CDMS can be improved by placing the detection cylinder in an electrostatic linear ion trap (ELIT) so that the ions oscillate back and forth through the cylinder many times.32 The resulting time domain signal is analyzed by fast Fourier transforms; the oscillation frequency provides the m/z, and the magnitude provides the charge.39 While this approach provides a significant improvement over single pass CDMS, the mass resolving power has still been poor, in the 30–40 range.
Historically, the resolving power of CDMS has been limited by the uncertainty in the charge measurement. However, the charge is quantized, and if the charge can be measured with enough accuracy that the ion can be assigned, with a low error rate, to a specific charge state, the uncertainty in the charge becomes very small and no longer limiting. To assign an ion to a specific charge state there must be well-resolved peaks in the charge spectrum which require an uncertainty (RMSD) in the charge measurement of around 0.2 e (elementary charges). We recently reported studies where this goal had been achieved for ions with up to 500 charges.53 When charge states can be assigned with a low error rate, the mass resolving power is determined almost entirely by the uncertainty in the m/z.
The m/z resolving power achieved with CDMS ELITs has been relatively low. In addition to applications in CDMS, ELITs have been employed as conventional mass spectrometers where the m/z ratios are determined.54–62 In this application, bunches of ions are injected into the trap, and the signal intensity reflects the number of charges in the bunch rather than the charge of single ions. Two configurations have been employed: multireflectron time-of-flight where the ions exit the trap for detection58–60,62 and an approach where a ring detector is used to pick up the induced charge from the oscillating ion bunch.55–57,61 In both cases, very high m/z resolving powers, in excess of 100 000, have been reported.55,58–60 Such high m/z resolving powers have not yet been achieved in CDMS, partly because the design considerations for these two applications are different. In CDMS, the ELITs are designed for efficient trapping so that single ions can be trapped for long times and the charge can be determined accurately. This leads to designs where ions with off-axis trajectories remain trapped even though their oscillation frequencies differ slightly from those of the on-axis ions. In the ELITs designed for ion bunches, efficient trapping is less important, and ions with trajectories that move slightly off-axis can be lost and hence not degrade the resolving power. In addition, self-bunching (through ion—ion interactions) can reduce the effects of the ions’ energy distribution.55,63,64 Self-bunching cannot occur in CDMS; the ion density is too low, and ion—ion interactions are thought to be detrimental.65 Efforts to improve the m/z resolving power of CDMS ELITs have focused on reducing the dependence of the ion’s oscillation frequency on the ion energy and the ion’s radial offset and angular divergence.66
In this manuscript we describe studies where recent improvements in the accuracy of the charge measurements in CDMS53 are combined with higher resolution m/z measurements66 to obtain a mass resolving power almost an order of magnitude better than that achieved in previous CDMS measurements. The improved resolution is demonstrated by monitoring the assembly reaction of hepatitis B virus (HBV) capsids under different initial assembly conditions. The high-resolution mass measurements allow all the trapped assembly intermediates to be resolved and their masses accurately determined. The ability to resolve all the assembly intermediates enables a better understanding of the HBV capsid assembly reaction (as we will discuss in detail elsewhere).
Substantial improvements in the mass resolving power have always led to new research opportunities. Higher resolution CDMS is expected to follow the established precedent. There are many cases where the improvements outlined here will enable studies that are not possible with a mass resolving power of 30–40. In addition to characterizing the assembly and disassembly of capsids and other structures, a topic highlighted here, applications we are exploring include the binding of smaller species (such as drugs, proteins, and antibodies) to a larger species (such as a virus or protein complex). We have found that even in cases where heterogeneity inhibits the ability to resolve subcomponents, the improved resolving power allows the underlying distribution to be better characterized.
CDMS INSTRUMENT AND EXPERIMENTAL METHODS
All measurements were made on our second generation CDMS instrument that incorporates an ELIT designed for improved m/z resolution and charge accuracy.66 A schematic diagram of the main components is given in Supporting Information Figure S1. Ions are generated by nanoelectrospray and enter the instrument through a metal capillary. They pass through several differential pumped regions before entering the ELIT. The first region contains a FUNPET (an ion funnel—ion carpet hybrid) designed to optimize transmission over a broad mass range.67 The second region contains an RF hexapole with a DC offset that sets the ion energy. The hexapole is followed by a segmented RF quadrupole. Ions that exit the quadrupole are focused into a dual hemispherical deflection energy analyzer (HDA) which selects a narrow band of ion kinetic energies. Ions that are transmitted by the HDA enter the fifth differentially pumped region that houses the ELIT. The pressure in this region is around 10−9 mbar.
The ELIT consists of two end-caps, each composed of three electrodes, that can be switched between transmission and reflection mode. With both end-caps in reflection mode, ions oscillate back and forth through a metal cylinder located between the end-caps. When ions are in the cylinder, they induce a charge which is detected by a charge sensitive amplifier. The voltage output from the charge sensitive amplifier is amplified, digitized, and sent to a computer. The time domain signals are analyzed in real time by a Fortran program which uses a Gaussian window function and fast Fourier transforms to determine the m/z and charge of the trapped ions.39,68 Trapping events are discarded if the ions are not trapped for the full trapping time or if the m/z or charge values are not stable. Large fluctuations in the measured charge can result from two ions oscillating almost in phase. Sudden shifts in the m/z or charge can arise from mass and/or charge loss.69
The charge sensitive amplifier employed in this work is a recently described custom design70 based on the approach of Bertuccio and co-workers71 where the feedback resistor is removed and the input JFET (junction field effect transistor) is biased by its gate leakage current. Cryogenically cooling the input JFET significantly reduces the noise, and the cooled JFET is temperature regulated to better than 0.1 K.70
To compensate for a small drift in the amplifier gain (around 1%), the amplifier is dynamically calibrated.53 A small antenna that penetrates through the grounded shield of the ELIT is used to irradiate the detection cylinder with calibration and compensation signals. The compensation signal substantially reduces the transients induced by switching the end-cap potentials from transmission mode to trapping mode. This avoids the long deadtime during which the output of the charge sensitive amplifier recovers and allows data analysis to begin shortly after the end-caps are switched. The RF calibration signal (129 kHz) is derived from a function generator (Agilent Technologies, 33220A). The amplitude of the signal is monitored by a high-precision (61/2 Digit) RMS voltmeter (Keithley 2000 Multimeter). The compensation and calibration signals are combined in a mixer, and the resulting signal is applied to the antenna. The resulting signals are picked up on the detection cylinder and measured by the charge sensitive amplifier in the same fashion as the signal from an oscillating ion. The amplitude of the RF reference signal is simultaneously determined by the same program that analyzes the time domain signals to obtain the oscillation frequency (m/z) and amplitude (charge) for trapped ions. The measured amplitudes of the reference signal are averaged over a predetermined number of trapping events, and then the average amplitude is used to correct the measured charge.
As noted above, the mass resolution in CDMS is determined by the uncertainties (RMSD) in the charge and m/z measurements for individual ions. However, the uncertainty in the average masses determined by CDMS depends on the absolute uncertainties in the charge and m/z measurements. The procedure used to perform an absolute charge calibration has been described elsewhere.53 Because charge states are resolved, we have very high confidence in the charge state assignments. Thus, the uncertainty in the m/z calibration is the main source of uncertainty in the average masses determined in this work. The relationship between the ion’s oscillation frequency, f, and the m/z is39
| (1) |
where the constant C depends on the ion energy and ELIT geometry. An initial value for the constant C was obtained from Simion simulations. The value was then refined by comparison to m/z measurements for ubiquitin. We use a small protein to provide the m/z calibration because there is no ambiguity about its mass (i.e., adducts due to the addition of salt molecules and solvent can be resolved). The instrumental m/z resolving power is around 330, so peaks in the m/z spectrum should have a relative width (fwhm) of 0.003. For a Gaussian peak it is easy to determine the peak center with a precision that is better than one-tenth of the peak width. Thus, we estimate that the relative uncertainty in the m/z determination is 0.001. Because the charge is measured accurately enough to assign charge states, this is also the relative uncertainty in the average masses.
Note that we do not employ collisional activation in these studies. Collisional activation is often used in conventional MS studies of high molecular weight species to improve the resolution of m/z peaks by removing residual solvent and salt adducts. However, collisional activation could also lead to the dissociation of weakly bound species, such as some of the HBV assembly intermediates studies here.
RESULTS AND DISCUSSION
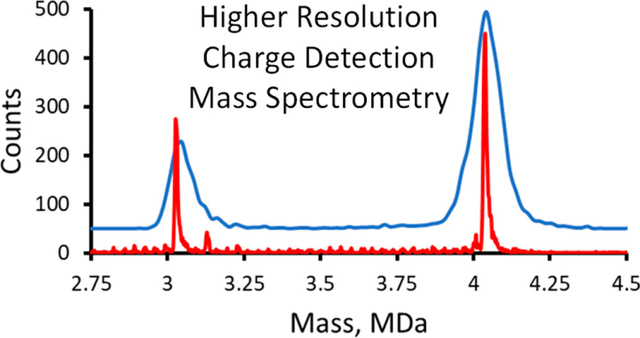
Figure 1 shows the mass distribution recorded for an HBV assembly reaction performed in ammonium acetate. Assembly was initiated by mixing equal volumes of 1 M ammonium acetate and 10 μM truncated HBV capsid protein (Cp 149) in 20 mM ammonium acetate. After 19 h, the assembly reaction was diluted to an ammonium acetate concentration of 200 mM, and an aliquot was immediately loaded into the electrospray source for CDMS measurements. The two main peaks in the spectrum in Figure 1 are centered on 3.03 and 4.04 MDa. They are attributed to the icosahedral T = 3 capsid with 90 capsid protein dimers and the T = 4 capsid with 120 dimers. The results for these peaks are summarized in Table 1.
Figure 1.

Higher resolving power CDMS mass spectrum measured for an HBV Cp149 assembly reaction. There are prominent peaks attributable to the icosahedral T = 3 and T = 4 capsids. The bin size is 2.5 kDa.
Table 1.
Properties of the Two Main Peaks Observed in the Mass Spectrum Shown in Figure 1
| T = 3 | T = 4 | |
|---|---|---|
| measured mass, Da | 3028310 | 4038350 |
| expected mass, Da | 3018670 | 4024900 |
| deviation, Da | 9640 | 13450 |
| peak fwhm, Da | 9375 | 13377 |
| resolving power | 323 | 302 |
The measured masses given in the table and the peak full widths at half-maximum (fwhm) were obtained by fitting Gaussians to the measured peaks. The expected masses are based on the calculated and measured Cp149 dimer mass of 33 541 Da. This small difference (around 0.3%) between the measured and expected masses is attributed to counterions, residual solvent and salt molecules, and other adducts. It is common in native MS measurements for the measured mass to be slightly higher than the expected for this reason. The results shown in Figure 1 and the table are representative. Both the deviation from the expected mass and the peak fwhm fluctuated by around 1 kDa day to day for the same sample. Larger variations were found sample to sample. In addition to the two main peaks in the spectrum, there are several smaller peaks which are due to trapped intermediates containing different numbers of dimers. Trapped intermediates were observed in our previous low-resolution CDMS studies of the HBV capsid assembly.40,72,73 However, peaks due to intermediates with a specific number of dimers were not resolved in that work.
There are two main contributions to the widths of the mass peaks: the instrumental resolution and the distribution of counterions, residual solvent, and other adducts. Assuming that these contributions are not correlated, the measured peak width is given by
| (2) |
where Wres is the contribution from the instrumental resolution and Wadd is the contribution from counterions, residual solvent, and other adducts. The resolving power obtained here (see Table 1) is close to the best we have achieved with this ELIT with smaller ions (around 330).66 This indicates that the contribution to the resolving power from the distribution of counterions, residual solvent, and other adducts, Wadd, is relatively small. The adduct distribution is expected to follow a Poisson distribution where the probability that n events occur is
| (3) |
and λ is the average number of events (in this case the average number of adducts). For large n, the Poisson distribution approaches a Gaussian distribution with a mean of λ and a standard deviation of λ1/2. The average number of adducts is
| (4) |
where mdiff is the difference between the measured and expected masses and madd is the average mass of an adduct. Using the mass difference (mdiff) for the T = 4 peak (13 450 Da) and a mass of 77 Da (ammonium acetate) for madd yields λ = 175. With this relatively large λ, the adduct mass distribution is expected to be Gaussian with a fwhm given by
| (5) |
The fwhm obtained from this expression is around 2400 Da, which is consistent with the expectation from above that Wadd is relatively small and that the measured peak width is limited mainly by the m/z resolution. Thus, heterogeneity makes only a small contribution to the measured peak width, and further improvements in the mass resolving power should be realizable.
Figure 2a shows the composite CDMS spectrum measured for another HBV Cp149 capsid assembly reaction. In this case, the truncated HBV capsid protein (Cp 149) was assembled overnight in 100 mM sodium chloride and then dialyzed into 100 mM ammonium acetate. The spectrum was measured 15 days after the assembly reaction was initiated (i.e., long after equilibrium should have been established). A broad distribution of trapped intermediates was detected. Starting with the capsid protein dimer which has a mass of 33.5 kDa, peaks were detected for every oligomer size all the way up to the T = 4 capsid with 120 dimers. Figure 2b shows an expanded view of the higher mass region. In addition to peaks due to oligomers up to the T = 4 capsid, there are overgrown capsids with more than 120 dimers. There are prominent peaks at 121, 125, and 132 dimers.
Figure 2.

Higher resolving power CDMS mass spectrum measured for another HBV Cp149 assembly reaction. In this case, there appear to be many trapped intermediates between the dimer at 33.54 kDa and the T = 4 capsid at 4.04 MDa and beyond. (a) Full composite spectrum assembled from three overlapping spectra covering the low-mass region (0–200 kDa), middle -mass region (200–2000 kDa), and high-mass region (2–5 MDa). (b) Expanded view of the high-mass regime. The bin size is 2.5 kDa.
The broad distribution of trapped intermediates observed in Figures 2a and b is unusual but not unique. The HBV assembly reaction usually leads to a size distribution more like that shown in Figure 1 with peaks due to dimer and small aggregates at lower masses. The factors that lead to the broad distribution of trapped intermediates in Figure 2a are not well understood. CDMS measurements were performed for this sample several times. The results were similar to those shown in Figure 2a, though it appeared that the distribution continued to evolve slowly toward capsid formation with time.
The charge spectrum for the assembly reaction shown in Figures 2 is given in Supporting Information Figure S2. All peaks in the charge spectrum are baseline resolved, so there is little ambiguity in assigning the ions to specific charge states. The uncertainty (RMSD) in the charge measurements was 0.188 e. This uncertainty allows the charge to be assigned to the nearest integer charge with an error rate of 1 in 120. In other words, 157 ions out of the 18 841 ions in the spectrum are expected to be mis-assigned. As we have discussed elsewhere,74 the error rate can be reduced by discarding some of the ions near to the halfway point between integer charges (these are the ions that are most likely to be misassigned). This strategy was not adopted here because the charge uncertainty was so low that discarding some of the ions did not lead to a discernible improvement to the spectra.
Figure 3 shows the m/z spectrum measured by CDMS for this assembly reaction. We consider the m/z spectrum here because it is measured in conventional MS and so it is of general interest. At low m/z values (<5000 Da) there are sharp peaks suggesting that charge states are resolved. Charge states are not resolved for large m/z values (>20 000 Da). For intermediate m/z values, there appear to be narrow windows where charge states are resolved. For example, there are prominent peaks in the m/z spectrum at around 16 000–17 000 Da. As we show below, these features are resonances that result from ions with different charges and masses having similar m/z values.
Figure 3.

m/z spectrum corresponding to the mass distribution in Figure 2. The bin size is 20 Da. The red and blue scales mark the expected positions of resonances due to ions with different masses and charges having the same m/z values (see text).
Figure 4 shows a scatter plot of charge versus m/z. The corresponding charge versus mass scatter plot is given in Supporting Information Figure S3. Each point in these plots represents a measurement for a single ion. The inset in the upper left corner of Figure 4 shows an expanded view of a portion of the charge versus m/z scatter plot. The points are clustered together, and each cluster is a resolved m/z charge state. The charge states are not resolved in the m/z spectrum because there are too many and they overlap. However, they can be resolved when they are dispersed by their charge. In the lower left corner of the plot, the clusters of points are arranged into a series of gently curved lines that correspond to lines of constant mass in a charge versus m/z plot. The red line in the figure tracks a series of points that correspond to the m/z and charge values that contribute to the mass peak for 22 dimers. The clusters of points that fall on this line make up the m/z spectrum for the (dimer)22 oligomer.
Figure 4.

Charge versus m/z scatter plot for the mass distribution shown in Figure 2. Each ion is represented by a point. The points fall into clusters that are resolved m/z charge states. The insert is an expanded view of a portion of the scatter plot to show the resolved m/z charge states more clearly. The red line shows a line of constant mass corresponding to the (dimer)22 oligomer. The clusters of points falling on this line make up the m/z envelope for this oligomer mass.
Figure 5 shows an expanded view of a portion of the m/z spectrum (15 000–19 000 Da) that contains features that appear to be resolved charge states. The charge versus m/z scatter plot for this portion of the m/z spectrum is overlaid. It can be seen from Figure 5 that the resolved features in the m/z spectrum result because ions with different masses and charges have the same, or at least very similar, m/z values. Thus, in the charge versus m/z scatter plot, clusters of ions with different m/z values and charges line up vertically leading to resonances in the m/z spectrum. Resonances are expected to occur at m/z values given by
| (6) |
where Δm is the mass difference and Δz is the difference in the charge state. In this particular case, Δm is the mass difference between neighboring oligomers (i.e., the mass of the dimer, 33 541 Da), and Δz can have values of 1, 2, 3, 4, .... For Δz = 2 a resonance is expected at an m/z value of 16 770 Da, which is the resonance shown in Figure 5. Close inspection of the overlaid charge versus m/z scatter plot in Figure 5 reveals that this resonance results from the vertical stacking of m/z charge states that differ in charge by two elementary charges. In other words, it arises because (dimer)2+, (dimer)24+, (dimer)36+, ..., (dimer)n2n+ all have identical m/z values. For Δm equal to the mass of the dimer, additional resonances are expected at 11 180 Da (Δz = 3), 8 385 (Δz = 4), and so on. The red scale on the top of Figure 3 shows the expected locations of this series of resonances. Other series of resonances are possible. For example, setting Δm to equal twice the dimer mass (67 082 Da) and Δz = 3, 5, 7, ... leads to a new series of resonances with m/z values of 22 361 Da (2mD/3), 13 416 Da (2mD/5), 9 583 Da (2mD/7), ..., where mD is the dimer mass. The even-numbered Δz values lead to resonances that are degenerate with the first series mentioned above. The locations of the odd-numbered resonances are shown by the blue scale in Figure 3. While there does not seem to be a feature in the m/z spectrum that corresponds to the expected resonance at 22 361 Da, there are resonances in the m/z spectrum at 13 416 and 9 583 Da. Many other resonances can exist in addition to the ones discussed above. In general, resonances are expected for all
| (7) |
with integer values of n and Δz.
Figure 5.

Expanded view of a portion on the m/z spectrum in Figure 3 showing the resonance centered on around 16 770 Da (black line). The bin size is 20 Da. The m/z spectrum is overlaid with a portion of the charge versus m/z scatter plot from Figure 4 (blue points). Note how the clusters of ions in the m/z scatter plot align vertically to generate the resonances in the m/z spectrum.
The resonances result because ions with different charges and masses have identical or very similar m/z values. This will occur whenever the m/z spectrum is measured for a heterogeneous mixture made up of components assembled from the same building block (in this case the capsid protein dimer). Similar resonances are expected to occur for other heterogeneous mixtures composed of different numbers of the same building block such as protein aggregates, polymers, and nanoparticles. In these cases, interpretation of the m/z spectrum is impossible without accurate information on each ion’s charge.
Finally, Figure 6 shows a plot of the mass deviations (measured mass minus expected mass) as a function of oligomer size. Below around 60 dimers, the mass deviation increases close to linearly at around 100 Da/dimer (see the red line in Figure 6). Above around 60 dimers the mass deviation again increases close to linearly but at a rate around three times higher (340 Da/dimer) (see the green line in Figure 6). The mass deviation of the icosahedral T = 3 capsid (90 dimers) does not stand out. The mass deviations of 100 and 340 Da/dimer correspond to about 1–4 ammonium acetate molecules per dimer or 6 and 18 water molecules per dimer. This result suggests a structural basis for retaining salt or water molecules and a fundamental structural difference between small oligomers and larger complexes. Furthermore, there does appear to be a discontinuity just below the T = 4 capsid (120 dimers) where the mass deviation briefly levels off and then starts to increase again.
Figure 6.

Plot of the mass deviation (measured mass minus expected mass using a dimer mass of 33 541 Da) against the number of capsid protein dimers. The red and green lines are guides showing regions where the mass deviation shows a close to linear increase. Below around 60 dimers the rate of increase is 100 Da/dimer. Above around 60 dimers the rate of increase is 340 Da/dimer.
CONCLUSIONS
The mass resolving power in CDMS depends on the uncertainties in the m/z and charge measurements for each ion. The recent development of dynamic calibration has enabled charge state resolution to be achieved for large ions (up to 500 charges). With charge state resolution, each ion can be assigned to an integer charge, and the mass resolving power becomes limited by the m/z resolving power. Recent improvements in ELIT designs for CDMS have increased the m/z resolving power. In this work we have combined these two advances to provide almost an order of magnitude improvement in the mass resolving power achieved by CDMS. The results presented here indicate that the measured peak widths are still dominated by instrumental resolution, with sample heterogeneity (i.e., the distribution of adducts) making a minor contribution. This indicates that additional improvements in m/z resolving power are worth pursuing, even in the absence of reduced sample heterogeneity. The main factor limiting the m/z resolving power is the frequency differences that occur for ions with different kinetic energies and entrance conditions (radial offset and angular divergence). ELIT designs that further reduce the dependence on these parameters are being developed. The measurements reported here were performed without intentional collisional activation, which may reduce heterogeneity but could also dissociate weakly bound complexes, biasing the results.
The analysis of trapped intermediates in the assembly of the HBV capsid was used in this work to demonstrate the performance of higher resolution CDMS. All possible assembly intermediates were resolved. Resonances were identified in the m/z spectrum of the assembly reaction that result from ions with different masses and charges having similar m/z values. Analogous resonances are expected whenever the mass spectrum contains a heterogeneous mixture assembled from the same building block. The order of magnitude improvement in the CDMS resolving power achieved here is expected to enable new classes of measurements for high mass ions. Of particular importance are problems where small species (i.e., drugs and proteins) are bound to much larger species (i.e., capsids and protein complexes). The advances described here will enable the resolution of individual binding events.
Supplementary Material
ACKNOWLEDGMENTS
Research reported in this publication was supported by the National Institutes of Health under award number R01GM131100 (to M.F.J.) and R01AI118933 (to A.Z.). The instrumentation employed was supported by the National Science Foundation under grant number CHE–1531823 (to M.F.J.). We thank IU Chemistry Department Electronic Instrument Services and Mechanical Instrument Services for their valuable contributions.
Footnotes
The authors declare the following competing financial interest(s): The authors, except A.Z. and M.F.J., declare no competing financial interest. A.Z. is associated with a company that is developing antiviral compounds. M.F.J. is associated with a company developing charge detection mass spectrometry.
ASSOCIATED CONTENT
Supporting Information
The Supporting Information is available free of charge at https://pubs.acs.org/doi/10.1021/acs.analchem.0c02133.
Diagram of the main components of the second generation CDMS instrument; charge spectrum and charge versus mass scatter plot for the mass distribution in Figure 2 (PDF)
Contributor Information
Aaron R. Todd, Chemistry Department, Indiana University, Bloomington, Indiana 47405, United States
Lauren F. Barnes, Chemistry Department, Indiana University, Bloomington, Indiana 47405, United States
Kim Young, Molecular and Cellular Biochemistry Department, Indiana University, Bloomington, Indiana 47405, United States.
Adam Zlotnick, Molecular and Cellular Biochemistry Department, Indiana University, Bloomington, Indiana 47405, United States.
Martin F. Jarrold, Chemistry Department, Indiana University, Bloomington, Indiana 47405, United States.
REFERENCES
- (1).Yamashita M; Fenn JB J. Phys. Chem. 1984, 88, 4451–4459. [Google Scholar]
- (2).Tanaka K; Waki H; Ido Y; Akita S; Yoshida Y; Yoshida T; Matsuo T Rapid Commun. Mass Spectrom. 1988, 2, 151–153. [Google Scholar]
- (3).Loo JA Mass Spectrom. Rev. 1997, 16, 1–23. [DOI] [PubMed] [Google Scholar]
- (4).van den Heuvel RHH; Heck AJ R. Curr. Opin. Chem. Biol. 2004, 8, 519–526. [DOI] [PubMed] [Google Scholar]
- (5).Pukala TL; Ruotolo BT; Zhou M; Politis A; Stefanescu R; Leary JA; Robinson CV Structure 2009, 17, 1235–1243. [DOI] [PubMed] [Google Scholar]
- (6).Peng W-P; Chou S-W; Patil AA Analyst 2014, 139, 3507–3523. [DOI] [PubMed] [Google Scholar]
- (7).Keifer DZ; Pierson EE; Jarrold MF Analyst 2017, 142, 1654–1671. [DOI] [PubMed] [Google Scholar]
- (8).Sugai T Mass Spectrom. 2017, 6, S0074. [DOI] [PMC free article] [PubMed] [Google Scholar]
- (9).Tito MA; Tars K; Valegard K; Hajdu J; Robinson CV J. Am. Chem. Soc. 2000, 122, 3550–3551. [Google Scholar]
- (10).Uetrecht C; Versluis C; Watts NR; Roos WH; Wuite GJL; Wingfield PT; Steven AC; Heck AJ R. Proc. Natl. Acad. Sci. U. S. A. 2008, 105, 9216–9220. [DOI] [PMC free article] [PubMed] [Google Scholar]
- (11).Snijder J; Rose RJ; Veesler D; Johnson JE; Heck AJ R. Angew. Chem., Int. Ed. 2013, 52, 4020–4023. [DOI] [PMC free article] [PubMed] [Google Scholar]
- (12).Snijder J; van de Waterbeemd M; Damoc E; Denisov E; Grinfeld D; Bennett A; Agbandje-McKenna M; Makarov A; Heck AJ R. J. Am. Chem. Soc. 2014, 136, 7295–7299. [DOI] [PMC free article] [PubMed] [Google Scholar]
- (13).van de Waterbeemd M; Snijder J; Tsvetkova IB; Dragnea BG; Cornelissen JJ; Heck AJ R. J. Am. Soc. Mass Spectrom. 2016, 27, 1000–1009. [DOI] [PMC free article] [PubMed] [Google Scholar]
- (14).Keifer DZ; Jarrold MF Mass Spectrom. Rev. 2017, 36, 715–733. [DOI] [PubMed] [Google Scholar]
- (15).Philip MA; Gelbard F; Arnold SJ Colloid Interface Sci. 1983, 91, 507–515. [Google Scholar]
- (16).Hars G; Tass ZJ Appl. Phys. 1995, 77, 4245–4250. [Google Scholar]
- (17).Bruce JE; Cheng X; Bakhtiar R; Wu Q; Hofstadler SA; Anderson GA; Smith RD J. Am. Chem. Soc. 1994, 116, 7839–7847. [Google Scholar]
- (18).Schlemmer S; Illemann J; Wellert S; Gerlich DJ Appl. Phys. 2001, 90, 5410–5418. [Google Scholar]
- (19).Peng W-P; Yang Y-C; Kang M-W; Lee YT; Chang HC J. Am. Chem. Soc. 2004, 126, 11766–11767. [DOI] [PubMed] [Google Scholar]
- (20).Peng W-P; Yang Y-C; Lin C-W; Chang H-C Anal. Chem. 2005, 77, 7084–7089. [DOI] [PubMed] [Google Scholar]
- (21).Howder CR; Long BA; Bell DM; Furakawa KH; Johnson RC; Fang Z; Anderson SL ACS Nano 2014, 8, 12534–12548. [DOI] [PubMed] [Google Scholar]
- (22).Chen R; Wu Q; Mitchell DW; Hofstadler SA; Rockwood AL; Smith RD Anal. Chem. 1994, 66, 3964–3969. [Google Scholar]
- (23).Frank M; Labov SE; Westmacott G; Benner WH Mass Spectrom. Rev. 1999, 18, 155–186. [DOI] [PubMed] [Google Scholar]
- (24).Rabin MW; Hilton GC; Martinis JM IEEE Trans. Appl. Supercond. 2001, 11, 242–247. [Google Scholar]
- (25).Wenzel RJ; Matter U; Schultheis L; Zenobi R Anal. Chem. 2005, 77, 4329–4337. [DOI] [PubMed] [Google Scholar]
- (26).Nie Z; Cui F; Chu M; Chen C-H; Chang H-C; Cai Y Int. J. Mass Spectrom. 2008, 270, 8–15. [Google Scholar]
- (27).Makarov A; Denisov EJ Am. Soc. Mass Spectrom. 2009, 20, 1486–1495. [DOI] [PubMed] [Google Scholar]
- (28).Plath LD; Ozdemir A; Aksenov AA; Bier ME Anal. Chem. 2015, 87, 8985–8993. [DOI] [PubMed] [Google Scholar]
- (29).Kafader JO; Beu SC; Early BP; Melani RD; Durbin KR; Zabrouskov V; Makarov AA; Maze JT; Shinholt DL; Yip PF; Kelleher NL; Compton PD; Senko MW J. Am. Soc. Mass Spectrom. 2019, 30, 2200–2203. [DOI] [PMC free article] [PubMed] [Google Scholar]
- (30).Shelton H; Hendricks CD; Wuerker RF J. Appl. Phys. 1960, 31, 1243–1246. [Google Scholar]
- (31).Fuerstenau SD; Benner HW Rapid Commun. Mass Spectrom. 1995, 9, 1528–1538. [DOI] [PubMed] [Google Scholar]
- (32).Benner WH Anal. Chem. 1997, 69, 4162–4168. [Google Scholar]
- (33).Maze JT; Jones TC; Jarrold MF J. Phys. Chem. A 2006, 110, 12607–12612. [DOI] [PubMed] [Google Scholar]
- (34).Mabbett SR; Zilch LW; Maze JT; Smith JW; Jarrold MF Anal. Chem. 2007, 79, 8431–8439. [DOI] [PubMed] [Google Scholar]
- (35).Gamero-Castaño M Rev. Sci. Instrum. 2007, 78, 043301. [DOI] [PubMed] [Google Scholar]
- (36).Gamero-Castaño M Rev. Sci. Instrum. 2009, 80, 053301. [DOI] [PubMed] [Google Scholar]
- (37).Smith JW; Siegel EE; Maze JT; Jarrold MF Anal. Chem. 2011, 83, 950–956. [DOI] [PubMed] [Google Scholar]
- (38).Doussineau T; Bao CY; Clavier C; Dagany X; Kerleroux M; Antoine R; Dugourd P Rev. Sci. Instrum. 2011, 82, 084104. [DOI] [PubMed] [Google Scholar]
- (39).Contino NC; Jarrold MF Int. J. Mass Spectrom. 2013, 345–347, 153–159. [Google Scholar]
- (40).Pierson EE; Keifer DZ; Selzer L; Lee LS; Contino NC; Wang JC; Zlotnick A; Jarrold MF J. Am. Chem. Soc. 2014, 136, 3536–3541. [DOI] [PMC free article] [PubMed] [Google Scholar]
- (41).Doussineau T; Desert A; Lambert O; Taveau J-C; Lansalot M; Dugourd P; Bourgeat-Lami E; Ravaine S; Duguet E; Antoine R J. Phys. Chem. C 2015, 119, 10844–10849. [Google Scholar]
- (42).Keifer DZ; Motwani T; Teschke CM; Jarrold MF Rapid Commun. Mass Spectrom. 2016, 30, 1957–1962. [DOI] [PMC free article] [PubMed] [Google Scholar]
- (43).Pierson EE; Keifer DZ; Kukreja AA; Wang JC-Y; Zlotnick A; Jarrold MF J. Mol. Biol. 2016, 428, 292–300. [DOI] [PMC free article] [PubMed] [Google Scholar]
- (44).Pierson EE; Keifer DZ; Asokan A; Jarrold MF Anal. Chem. 2016, 88, 6718–6725. [DOI] [PMC free article] [PubMed] [Google Scholar]
- (45).Doussineau T; Mathevon C; Altamura L; Vendrely C; Dugourd P; Forge V; Antoine R Angew. Chem., Int. Ed. 2016, 55, 2340–2344. [DOI] [PubMed] [Google Scholar]
- (46).Elliott AG; Harper CC; Lin H-W; Susa AC; Xia Z; Williams ER Anal. Chem. 2017, 89, 7701–7708. [DOI] [PubMed] [Google Scholar]
- (47).Elliott AG; Harper CC; Lin H-W; Williams ER Analyst 2017, 142, 2760–2769. [DOI] [PMC free article] [PubMed] [Google Scholar]
- (48).Dunbar CA; Callaway HM; Parrish CR; Jarrold MF J. Am. Chem. Soc. 2018, 140, 15701–15711. [DOI] [PubMed] [Google Scholar]
- (49).Dunbar CA; Rayaprolu V; Wang JC-Y; Brown CJ; Leishman E; Jones-Burrage S; Trinidad JC; Bradshaw HB; Clemmer DE; Mukhopadhyay S; Jarrold MF ACS Infect. Dis. 2019, 5, 892–902. [DOI] [PMC free article] [PubMed] [Google Scholar]
- (50).Brown BA; Zeng X; Todd AR; Barnes LF; Winstone JMA; Trinidad JC; Novotny MV; Jarrold MF; Clemmer DE Anal. Chem. 2020, 92, 3285–3292. [DOI] [PMC free article] [PubMed] [Google Scholar]
- (51).Shockley WJ Appl. Phys. 1938, 9, 635–636. [Google Scholar]
- (52).Weinheimer AJ J. Atmos. Oceanic Technol. 1988, 5, 298–304. [Google Scholar]
- (53).Todd AR; Jarrold MF J. Am. Soc. Mass Spectrom. 2020, 31, 1241–1248. [DOI] [PubMed] [Google Scholar]
- (54).Wollnik H; Przewloka M Int. J. Mass Spectrom. Ion Processes 1990, 96, 267–274. [Google Scholar]
- (55).Zajfman D; Rudich Y; Sagi I; Strasser D; Savin DW; Goldberg S; Rappaport M; Heber O Int. J. Mass Spectrom. 2003, 229, 55–60. [Google Scholar]
- (56).Hilger RT; Santini RE; McLuckey SA Anal. Chem. 2013, 85, 5226–5232. [DOI] [PubMed] [Google Scholar]
- (57).Hilger RT; Dziekonski ET; Santini RE; McLuckey SA Int. J. Mass Spectrom. 2015, 378, 281–287. [Google Scholar]
- (58).Yavor MI; Plaβ WR; Dickel T; Geissel H; Scheidenberger C Int. J. Mass Spectrom. 2015, 381–382, 1–9. [Google Scholar]
- (59).Tian YL; Wang YS; Wang JY; Zhou XH; Huang WX Int. J. Mass Spectrom. 2016, 408, 28–32. [Google Scholar]
- (60).Dickel T; Yavor MI; Lang J; Plaβ WR; Lippert W; Geissel H; Scheidenberger C Int. J. Mass Spectrom. 2017, 412, 1–7. [DOI] [PubMed] [Google Scholar]
- (61).Johnson JT; Lee KW; Bhanot JS; McLuckey SA J. Am. Soc. Mass Spectrom. 2019, 30, 588–594. [DOI] [PubMed] [Google Scholar]
- (62).Fischer P; Schweikhard L Rev. Sci. Instrum. 2020, 91, 023201. [DOI] [PubMed] [Google Scholar]
- (63).Pedersen HB; Strasser D; Ring S; Heber O; Rappaport ML; Rudich Y; Sagi I; Zajfman D Phys. Rev. Lett. 2001, 87, 055001. [DOI] [PubMed] [Google Scholar]
- (64).Pedersen HB; Strasser D; Amarant B; Heber O; Rappaport ML; Zajfman D Phys. Rev. A: At., Mol., Opt. Phys. 2002, 65, 042704. [DOI] [PubMed] [Google Scholar]
- (65).Botamanenko DY; Jarrold MF J. Am. Soc. Mass Spectrom. 2019, 30, 2741–2749. [DOI] [PMC free article] [PubMed] [Google Scholar]
- (66).Hogan JA; Jarrold MF J. Am. Soc. Mass Spectrom. 2018, 29, 2086–2095. [DOI] [PubMed] [Google Scholar]
- (67).Draper BE; Anthony SN; Jarrold MF J. Am. Soc. Mass Spectrom. 2018, 29, 2160–2172 [DOI] [PubMed] [Google Scholar]
- (68).Draper BE; Jarrold MF J. Am. Soc. Mass Spectrom. 2019, 30, 898–904. [DOI] [PubMed] [Google Scholar]
- (69).Keifer DZ; Alexander AW; Jarrold MF J. Am. Soc. Mass Spectrom. 2017, 28, 498–506. [DOI] [PubMed] [Google Scholar]
- (70).Todd AR; Alexander AW; Jarrold MF J. Am. Soc. Mass Spectrom. 2020, 31, 146–154. [DOI] [PubMed] [Google Scholar]
- (71).Bertuccio G; Rehak P; Xi DM Nucl. Instrum. Methods Phys. Res., Sect. A 1993, 326, 71–76. [Google Scholar]
- (72).Lutomski CA; Lyktey NA; Zhao Z; Pierson EE; Zlotnick A; Jarrold MF J. Am. Chem. Soc. 2017, 139, 16932–16938. [DOI] [PMC free article] [PubMed] [Google Scholar]
- (73).Lutomski CA; Lyktey NA; Pierson EE; Zhao Z; Zlotnick A; Jarrold MF J. Am. Chem. Soc. 2018, 140, 5784–5790. [DOI] [PMC free article] [PubMed] [Google Scholar]
- (74).Keifer DZ; Shinholt DL; Jarrold MF Anal. Chem. 2015, 87, 10330–10337. [DOI] [PubMed] [Google Scholar]
Associated Data
This section collects any data citations, data availability statements, or supplementary materials included in this article.