

Abstract
The aim of this exploratory study was to examine whether the kurtosis metric can contribute to investigations of the effects of combined exposure to noise and solvents on human hearing thresholds. Twenty factory workers exposed to noise and solvents along with 20 workers of similar age exposed only to noise in eastern China were investigated using pure-tone audiometry (1000-8000 Hz). Exposure histories and shift-long noise recording files were obtained for each participant. The data was used in the calculation of their Cumulative Noise Exposure (CNE) and CNE adjusted by the kurtosis metric. Passive samplers were used to measure solvent concentrations for each worker exposed to solvents over their full work shift. Results showed an interaction between noise exposure and solvents for the hearing threshold at 6000 Hz. This effect was observed only when the CNE level was adjusted by the kurtosis metric.
Introduction
In today’s complex industrial environments, noise and chemicals such as solvents are found in many workplaces and are part of the daily life of numerous workers. Studies conducted with experimental animals provide robust evidence that solvents such as toluene, styrene, xylene, and ethyl benzene, can affect the auditory function through their toxic action on the organ of Corti, auditory pathways, as well as on the middle-ear reflex (Venet et al., 2011; Wathier et al., 2016). In addition, aromatic solvents can interact synergistically with noise. Previous studies, also on experimental animals, elucidated mechanisms and dose-effect relationships between agents and effects on the auditory function (for a review see Johnson & Morata, 2010 and Campo et al., 2013). Human studies have shown that workers exposed to solvents and noise exhibit a higher prevalence of hearing loss in comparison to noise-exposed or non-exposed control subjects, as well as an association between solvent exposure, audiometric thresholds and central auditory dysfunction (for a review see Johnson & Morata, 2010; Rawool, 2016).
Noise exposures often vary in the temporal pattern in many work environments. Jobs involving maintenance work, metalwork, and power tools such as impact wrenches and nail guns provide examples of complex noise environments. Typically, as the temporal distribution of these noise environments is not normal or Gaussian (G), they may be described as “complex non-Gaussian (non-G)” noise (Hamernik et al., 2003). Non-G noise is very common in factories where it is comprised of a background G noise along with embedded high-level transients (impacts or noise bursts). Evidence that noise exposures including impulse or impact noise produce greater traumatic effects to the peripheral auditory receptor than the expected damage estimated by the equal-energy hypothesis is available from studies with both animals (Lei et al., 1994; Hamernik & Qiu, 2001) and humans (Thierry & Meyer-Bisch, 1988). Thus, it is evident that an energy metric alone is not sufficient to characterize a non-G noise for the assessment of the effects of noise exposure. Results from animal experiments and human epidemiological studies (e.g. Hamernik et al., 2003; Zhao et al., 2010) have shown that the kurtosis of the amplitude distribution, a statistical metric that is sensitive to the peak and temporal characteristics of a noise, could be a very good descriptor of the resulting auditory damage induced by complex noise exposures.
More recently, the effects of exposure to styrene along with two different types of noise with the same spectral composition were compared in experimental studies. The first study was a 6-hour continuous noise of 85 dB SPL and the second was an 80-dB complex noise consisting of series of sound bursts at 112 dB. The latter combination (chemicals and noise) was more harmful to the rat cochlea both for styrene and carbon disulfide (Campo et al., 2014; Carreres-Pons et al., 2017). The mechanism behind this specific interaction involves an effect of solvents on acoustic reflexes. The middle-ear acoustic reflex is driven by a cholinergic efferent system and in vivo studies have shown that it can be affected by solvents (Maguin, et al., 2009; Venet et al, 2011). A dysfunction of this reflex would increase the risk for hearing loss by allowing higher acoustic energy levels (at least 5 dB) to penetrate the inner ear (Campo et al., 2014; Carreres-Pons et al., 2017). Thus, the combined exposure to noise and solvents may be particularly harmful to the human auditory system in the presence of non-G noise.
In the current exploratory study, we examined the effects of combined exposure to solvents and complex noise on hearing thresholds of workers from eastern China, using a kurtosis metric that takes into consideration the temporal structure of the noise. The ultimate goal was to investigate whether the kurtosis metric is appropriate to study combined effects.
Methods
Study Population
Initially, an occupational hygienist at the Zhejiang Provincial Center for Disease Control and Prevention of China administered a questionnaire to each worker in order to collect information regarding occupational history (type of factory, worksite, job description, length of employment, duration of daily noise exposure, and history of use of hearing protectors). Also, through this questionnaire a medical history for each worker was obtained. The characteristics of the study population (n = 40) regarding their age, tenure, and exposures to noise and solvents are shown in Table 1.
Table 1.
Characterization of the study population (n = 40). Mean values, range and standard deviation (within parenthesis) for the variables of age, tenure, current time-weighted noise and solvent exposures, and estimated cumulative noise exposures (CNE).
| Variable | Noise (n = 20) |
Noise and solvents (n = 20) |
|---|---|---|
| Age (years) | 35.8 (27–49, SD 6.6) | 36.7 (25-47, SD 6.7) |
| Gender | 17 males, 3 females | 17 males, 3 females |
| Tenure (years) | 7.1 (3-16, SD 3.3) | 5.9 (2–16, SD 4.2) |
| Exposures | ||
| LAeq (in dBA) | 87 (81-93.8, SD 3.7) | 86.6 (82-91.5, SD 3) |
| Kurtosis | 30 (5.2-214, SD 44) | 26.7 (7-102, SD 22) |
| CNE (dBA by year) | 95 (88-103.8) | 94.4 (88-103.6) |
| Solvent Mixture dose (%) |
N.A. | 6 to 93% |
| Acetone (ppm) | N.A. | TWA <0.1-2.4 |
| Ethyl Acetate (ppm) | N.A. | TWA <0.07-1.85 |
| Methyl Ethyl Ketone (MEK) (ppm) | N.A. | TWA <0.04-0.15 |
| Benzene (ppm) | N.A. | TWA <0.03 |
| Toluene (ppm) | N.A. | TWA 0.07-12.4 |
| Butyl Acetate (ppm) | N.A. | TWA 0.94-6.9 |
| Xylenes (ppm) | N.A. | TWA <0.06-9.8 |
| Styrene (ppm) | N.A. | (<0.03-8.2) |
Workers exposed to solvents and noise (n=20) were recruited from two furniture-making factories located in Wenzhou, China. They were exposed to a mixture of solvents including acetone, ethyl acetate, methyl ethyl ketone (MEK), benzene, toluene, butyl acetate, ethyl benzene, xylene and styrene. These workers mainly performed duties that involved painting. Noise-exposed workers (n=20) were selected from five manufacturing factories from Hangzhou, China. These workers were mainly involved in assembly and tandem rolling duties. For both groups of workers, noise exposure levels varied throughout their work shift. The same was true for solvent exposure levels (for workers exposed to both agents). Workers from all factories mentioned above had not been offered hearing protection for most of their working history. Painting workers wore half mask respirators (Hangzhou Lantian Labor Protective Equipment Factory, Model 2102) when they painted the furniture. Similarly to hearing protection, the effectiveness of half mask respirators is dependent on the adequacy of their use. This information was not available during data collection.
Participants reported no history of ear disease, treatment with ototoxic drugs, hypertension, diabetes, or head injury. Their job history showed that this is a very stable population, in terms of remaining in one company for a long tenure. All participants provided signed consent forms approved by the Ethics Committee of Zhejiang Provincial Centers for Disease Control and Prevention of China prior to testing, and research was conducted in compliance with the principles of the World Medical Association Declaration of Helsinki (World Medical Association, 2013).
Audiological assessment
The audiometric testing was conducted in a double-walled, sound-treated room. An Interacoustics AC33 clinical audiometer with TDH-39P headphones was used for pure-tone audiometry (PTA). Tympanometry was carried out with an Interacoustics AZ7 middle-ear analyzer. Air-conduction pure-tone thresholds were tested from 1000 to 8000 Hz and from 1000 to 4000 Hz for bone conduction. Workers were tested prior the commencement of their work shift in the early morning.
Noise exposure assessment
Shift-long noise recording files were obtained for each study participant using a digital noise dosimeter/recorder (ASV5910-R, Hangzhou Aihua Instruments Co. Ltd., Hangzhou, P.R. China) operating continuously at a 48 kHz sampling rate. The recorder was equipped with a ¼ inch microphone, having a flat frequency response ranging from 10 Hz to 20 kHz, and a measurement range of 40-141 dBA. The device was easily worn on the worker’s shoulder just like a typical noise dosimeter. Immediately after recording the noise exposure, the data were transferred from the recorder to a hard disk drive for subsequent analyses. The recorder was calibrated before and after each sampling period using a sound level calibrator (Hangzhou Aihua Instruments, AWA6221B) according to the manufacturer’s instructions.
The kurtosis of the recorded noise signal was computed for consecutive 40-second time windows over the full shift using MATLAB software. A window of 40 seconds was chosen as a compromise that allowed for computational efficiency and reflected the dynamic features of complex noise. The mean kurtosis of these 40-second windows was calculated and used as the kurtosis value for the entire shift. Both energy and duration of noise exposure should be taken into account in the evaluation of noise-induced hearing loss to an individual worker. Thus, a composite noise exposure index, the cumulative noise exposure (CNE), was used to quantify the noise exposure for each subject (Zhao et al., 2010). The CNE is defined as:
| (1) |
where LAeq,8h is the equivalent continuous A-weighted noise exposure level normalized to an 8-hour working day, in decibels, occurring over the time interval T in years. To evaluate the effects of non-Gaussian noise, a kurtosis-adjusted CNE is calculated based on the equation above. The new term, kurtosis-adjust CNE or CNE(β) is defined as:
| (2) |
where K = ln(β) + 1.9 (Zhao et al., 2010). The introduction of the kurtosis variable into the temporal component of the CNE calculation allows us to quantify the deviation of the non-G noise environment from the G noise environment.
Solvent exposure assessment
Passive samplers (SKC 575-001, SKC Inc.) were used to measure solvent concentrations for each worker exposed to solvents over the full work shift. To determine the level of exposure, a personal, full-shift, time-weighted average (TWA) exposure evaluation was conducted for all the workers. The solvents measured included: acetone, ethyl acetate, methyl ethyl ketone (MEK), benzene, toluene, butyl acetate, ethylbenzene, xylene and styrene, and was expressed as a TWA in ppm for each individual component. To evaluate the exposure to the solvent mixture we used the web-tool Mixie created by the University of Montreal and the Institut de Recherche Robert-Sauvé en Santé et en Sécurité du Travail (IRSST) (Vyskocil & Droled, 2010; Vyskocil et al., 2007). It is aimed at assessing the risks associated with exposure to a mixture of airborne chemical substances in the workplace. Toxicological effects are considered additive and the multiple exposure index (Rm, see formula below) is used for assessing the risk encountered by people exposed to several substances present in the workplace.
The sum of the fractions of measured individual exposure concentrations and their Time-Weighted Average Exposure Value (TWAEV) for each substance results in a percentage of the recommended dose of the mixture. A percentage of 100 indicated that exposures are at their recommended exposure limit (according to Canadian TLVs).
Statistical analyses
Hearing thresholds (dB HL) at each single test frequency from 1000 to 8000 Hz were used in the statistical analyses to examine differences in hearing thresholds between workers exposed to noise only and workers exposed to noise and solvents. Considering that workers between both groups were matched by age, gender, noise exposure level and length of employment, the models were not adjusted by these variables, as in this case it could have affected the precision of the estimates. Additionally, a possible association between the hearing threshold at individual frequencies from 1000 to 8000 Hz and CNE as well as CNE(β ) was explored in the whole group of subjects (n = 40). The explained variance was estimated for each model.
For all the models created, the assumption of homoscedasticity was evaluated through the Breusch-Pagan (Breusch & Pagan, 1979) and Cook-Weisberg (Cook, 1983) tests. This assumption was not found for the majority of the models and thus, an estimator of robust variance (Huber Sandwich Estimator) was used (Huber & Ronchetti, 2009; White, 1980). Due to the small sample size, the standard errors were estimated through Bootstrapping (10,000 replications). The 95% confidence intervals were obtained through a bias-corrected and accelerated (BCa) method (Efron, 1987) which has shown the least capacity for a coverage error.
Then, interaction terms between CNE and CNE(β), and exposure group (noise only, noise and solvents) were created and included in new models. The predictions from the models were separated by exposure group and then graphically represented. The change in slope for the relationship between CNE and CNE(β) and hearing thresholds in each exposure group, as well as the significance of the interaction term, were the most important contributing aspects in concluding whether there was a multiplying effect in the interaction. The statistical program STATA version 13 was used (StataCorp, 2013).
Results
Figure 1 displays hearing thresholds for the better and worse ears for both groups of workers. Five workers exposed to solvents and noise exhibited significant threshold differences (greater than 10 dB) between the right and left ears. Considering that these differences are difficult to explain solely on their work exposures, we took the conservative approach to focus the rest of the data analyses on the results of their better ear. Workers exposed to solvents and noise exhibited a significantly worse hearing threshold for the better ear than workers exposed only to noise at 6000 Hz (see Table 2).
Figure 1.
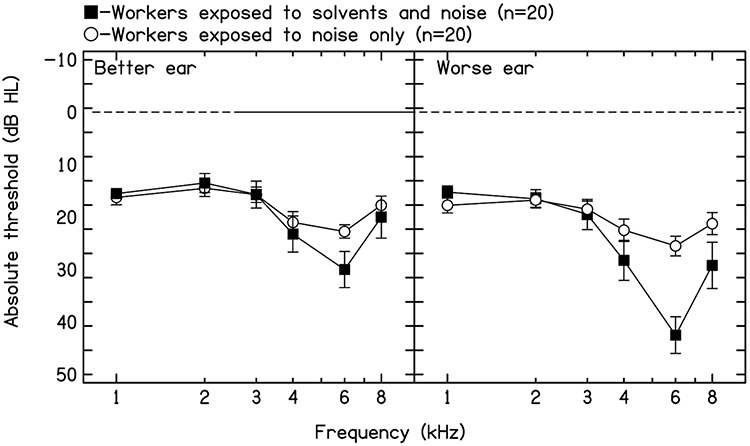
Mean pure-tone thresholds and standard errors for the better and worse ear for both groups of workers.
Table 2.
Differences in hearing thresholds for the better ear between workers exposed to noise only and workers exposed to noise and solvents (*p < 0.05).
| Frequency (better ear) | Robust estimation of the variance. Differences in hearing thresholds (95% CI) |
Bootstraping (BCA method) (95% CI) |
Explained variance |
|---|---|---|---|
| 1000 Hz | −0.75 (−4.10 – 2.60) | −3.9 – 2.63 | 0.50 |
| 2000 Hz | −1.00 (−5.87 – 3.87) | −5.42 – 4.0 | 0.50 |
| 3000 Hz | 0.00 (−5.99 – 5.99) | −5.13 – 6.25 | 0.00 |
| 4000 Hz | 2.25 (−5.86 – 10.36) | −5.0 – 10.60 | 0.82 |
| 6000 Hz | 7.25 (−0.22 – 14.72) | 0.56 – 15.07* | 9.22 |
| 8000 Hz | 2.25 (−6.58 – 11.08) | −4.82 – 12.60 | 0.70 |
Reference group: workers exposed to noise only
A statistically significant association between CNE and hearing thresholds (for the better ear) at 6000 and 8000 Hz was found. The variance explained by these relationships was 13.3 and 8.9, respectively. When the CNE was adjusted by kurtosis, the variance explained by the combined metrics CNE(β) and hearing thresholds at 6000 and 8000 Hz increased to 15.49 and 12.82, respectively (see Table 3).
Table 3.
Association between cumulative noise exposure (adjusted and not adjusted by kurtosis) and the hearing threshold for the better ear in the range from 1000 to 8000 Hz (n = 40) (* p < 0.05).
| Cumulative noise exposure -CNE | |||
|---|---|---|---|
| Frequency (better ear) | Robust estimation of variance. Differences in hearing thresholds (CI 95%) |
Bootstraping (BCa method) (CI 95%) |
Explained variance |
| 1000 Hz | 0.24 (−0.12 – 0.59) | −0.11 – 0.60 | 3.66 |
| 2000 Hz | 0.24 (−0.39 – 0.86) | −0.33 – 0.86 | 1.72 |
| 3000 Hz | 0.46 (−0.33 – 1.24) | −0.35 – 1.15 | 4.20 |
| 4000 Hz | 0.76 (−0.43 – 1.96) | −0.47 – 1.81 | 6.38 |
| 6000 Hz | 1.06 (0.17 – 1.96)* | 0.19 – 1.95* | 13.36 |
| 8000 Hz | 0.98 (−0.03 – 2.00) | 0.05 – 2.05* | 8.95 |
| Kurtosis adjusted cumulative noise exposure – CNE (β) | |||
| Frequency (better ear) | Robust estimation of variance. Differences in hearing thresholds (CI 95%) |
Bootstraping (BCa method) (CI 95%) |
Explained variance |
| 1000 Hz | 0.16 (−0.07 – 0.39) | −0.08 – 0.39 | 3.37 |
| 2000 Hz | 0.24 (−0.19 – 0.66) | −0.14 – 0.69 | 3.55 |
| 3000 Hz | 0.40 (−0.13 – 0.93) | −0.14 – 0.88 | 6.60 |
| 4000 Hz | 0.72 (−0.08 – 1.52) | −0.07 – 1.48 | 11.68 |
| 6000 Hz | 0.80 (0.14 – 1.45)* | 0.19 – 1.45* | 15.49 |
| 8000 Hz | 0.82 (0.12 – 1.52)* | 0.22 – 1.59* | 12.82 |
Since CNE and CNE(β) were significantly associated with hearing thresholds at 6000 and 8000 Hz, a further analysis was carried with the aim to determine a possible interaction between CNE and solvent exposure. The interaction term between CNE and exposure group on hearing thresholds (1000 to 8000 Hz) was not statistically significant. However, the interaction term between CNE(β) and exposure group showed a statistically significant effect for 6000 Hz. Thus, the predictions for this model were separately estimated for each group and then graphically represented (see Figure 2c,d). As a comparison, the model for 4000 Hz is also included (see Figure 2a,b).
Figure 2.
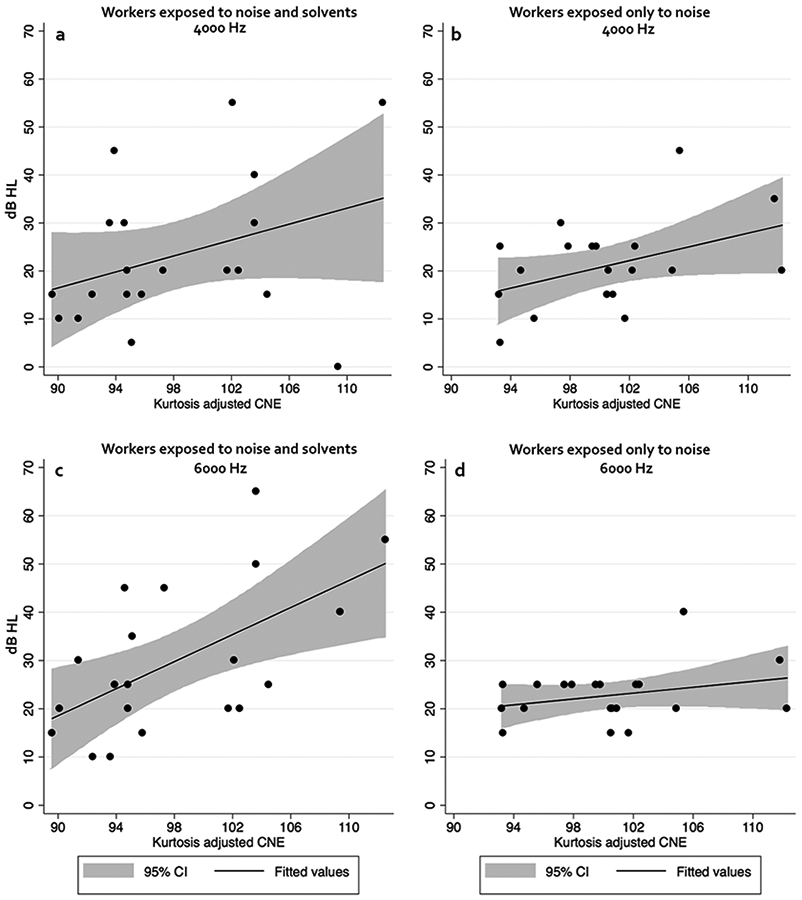
Predicted hearing thresholds for 4000 Hz (panels a and b) and 6000 Hz (panels c and d) for workers exposed to noise and solvents (panels a and c) and workers exposed only to noise (panels b and d).
Discussion
In this study, a kurtosis metric was used to evaluate the effects of noise and solvent exposures on the hearing thresholds of industrial workers. The initial comparison of the bilateral hearing thresholds showed a large between-ear threshold differences. This raises the question on whether non-occupational exposures (such as fireworks, commonly used in China) might explain the unilateral losses. However, all five workers presenting with asymmetrical losses were exposed to solvents and noise. Previous reports have found that ototoxins such as opioids may induce asymmetrical hearing loss (e.g. Rawool and Dhluhy, 2011). Thus, it may be hypothesized that solvents may induce a similar effect. However, no evidence supporting this hypothesis is currently available. So, while work exposures might have contributed to the losses in both ears, we decided to complete the analysis only considering the better ear.
Results showed that workers exposed to non-Gaussian noise and solvents presented a significantly worse hearing threshold at 6000 Hz for the better ear than workers exposed only to non-Gaussian noise. Further analyses showed an interaction effect between noise and solvent exposure at 6000 Hz but only when CNE was adjusted by kurtosis. Estimations for hearing thresholds were obtained for each group separately (noise only/noise and solvents) and graphically represented (Figure 2). The estimations should run parallel for both groups (as observed for 4000 Hz, Figure 2a,b), but this is lost for 6000 Hz (Figure 2c,d), thereby serving as an indicator of interaction. As it can be observed on Figure 2c,d, the slope for predicted hearing thresholds at 6000 Hz is much more pronounced among workers exposed to noise and solvents than workers only exposed to noise. The change in slope for the relationship between cumulative noise exposure level adjusted by kurtosis and hearing thresholds in each exposure group, as well as the significance of the interaction term, were the most important contributing findings in concluding there was an effect modification from the solvent exposure. The change in slope in addition to the significant interaction term observed, suggest that an interaction between noise and solvent exposure did occur at 6000 Hz. To the best of our knowledge this is the first study which shows the temporal parameter of noise exposure and the modification of their auditory effects, by solvents, in humans. The results should however be taken with caution due to the limited number of workers investigated.
The evaluation of chemical exposure in this current study was very limited and the exposure levels varied widely. The solvent exposures of the studied group varied from very low levels during most of their work shift, to a few periods of high concentrations. Research conducted to date does not offer answers on whether the solvent effects observed in humans are caused by long-term exposure to low-level background solvent levels or if they are triggered by few peaks of high solvent concentration. Are the peaks of solvent exposure more damaging than continuous low levels of the same 8-hour TWA, as it has been shown to happen with noise? Perhaps this question can be answered in an investigation with a larger sample size and detailed chemical exposure assessments.
Regarding the interaction between noise and solvents, Campo et al., 2014 observed that the temporal structure of noise exposure (continuous versus impulsive) modified the ototoxicity of styrene in experimental animals. A moderate concentration of styrene potentiated the cochlear damage caused by impulse noise, but it reduced the damage caused by continuous noise. The explanation offered for this paradox was that the natural protective mechanisms of the middle-ear acoustic reflex (MER) is modified by solvent exposure by lowering the threshold that triggers it. In addition, the MER amplitude is modified by solvent exposure. While an exposure to continuous noise can be attenuated by the MER, the same does not hold true for exposures to impulse noise, as the acoustic energy of this type of noise is dissipated into the cochlea before the MER is triggered (Borg et al., 1984). Also for repetitive impulse types of stimuli, depending on stimulus level, in approximately 5 to 10% of people the reflex decays. In such people, the reflex does not offer protection for repetitive impulses (Rawool, 1996). The protective role of the MER therefore can become insignificant for impulse noises, resulting in a difference between noises even when the LAeq8 are similar. This argument could also explain why co-exposure to noise and solvents can modify the effects of noise on individuals' hearing. From a preventive point of view, (a) the use of the equal energy principle over an 8-hour workday (LAeq) is not enough to estimate risk of hearing loss in complex noise environments, and (b) co-exposures to ototoxic agents, if present, should be taken into account.
This small-scale study aimed to investigate whether the kurtosis metric is applicable for predicting risk from combined exposures to noise and solvents. Our findings suggest that it is the case and that the potential interaction of solvents and impulse noise merits further investigation. Ideally, one would measure exposure ranges and peaks levels for solvent exposure. Other audiological tests that evaluate central auditory functions should also be considered, given the limitations of the information provided by pure-tone audiometry.
In conclusion, this study provides evidence that using a metric that incorporates the impulsiveness of noise combined with solvent exposure can allow the detection of interactive effects on hearing threshold.
NIOSH Disclaimer:
The findings and conclusions in this paper are those of the authors and do not represent the views of the National Institute for Occupational Safety and Health. Mention of any company or product does not constitute endorsement by NIOSH.
References
- Borg E, Counter SA, & Röster G (1984). Theories of Middle-Ear Muscle Functions. In Silman S (Ed.), The Acoustic Reflex: Basic Principles and Clinical Applications (pp. 63–101). Orlando, FL: Academic Press Inc. [Google Scholar]
- Breusch TS, Pagan AR (1979). “A simple test for heteroscedasticity and random coefficient variation”, Econometrica, 47, 1287–1294. [Google Scholar]
- Campo P, Morata TC, Hong O (2013). “Chemical exposure and hearing loss”. Dis. Mon 59(4), 119–138. [DOI] [PMC free article] [PubMed] [Google Scholar]
- Campo P, Venet T, Thomas A, Cour C, Brochard C, and Cosnier F (2014). “Neuropharmacological and cochleotoxic effects of styrene. Consequences on noise exposures”, Neurotoxicol. Teratol 44, 113–120. [DOI] [PubMed] [Google Scholar]
- Carreres Pons M, Chalansonnet M, Venet T, Thomas A, Nunge H, Merlen L, Cosnier F, Llorens J, Campo P (2017). “Carbon disulfide potentiates the effects of impulse noise on the organ of Corti”. Neurotoxicology. 59, 79–87. [DOI] [PubMed] [Google Scholar]
- Cook RD, Weisberg S (1983). “Diagnostics for heteroscedasticity in regression”, Biometrika, 70, 1–10. [Google Scholar]
- Efron B (1987). Better bootstrap confidence intervals. J Am Stat Assoc, 82(397), 171–185. [Google Scholar]
- Hamernik RP, and Qiu W (2001). “Energy-independent factors influencing noise-induced hearing loss in the chinchilla model”, J. Acoust. Soc. Am 110(6), 3163–3168. [DOI] [PubMed] [Google Scholar]
- Hamernik RR, Qiu W, and Davis B (2003). “The effects of the amplitude distribution of equal energy exposures on noise-induced hearing loss: The kurtosis metric”, J. Acoust. Soc. Am 114(1), 386–395. [DOI] [PubMed] [Google Scholar]
- Huber PJ, Ronchetti EM (2009). Robust Statistics (2 edition). New Jersey, NJ: Wiley. [Google Scholar]
- Johnson AC and Morata TC (2010). “Occupational exposure to chemicals and hearing impairment. The Nordic Expert Group for Criteria Documentation of Health Risks from Chemicals”. Nordic Expert Group. Gothenburg.Arbete och Hälsa. [Google Scholar]
- Lei SF, Ahroon WA, Hamernik RP (1994). “The application of frequency and time domain kurtosis to the assessment of hazardous noise exposures”, J. Acoust. Soc. Am 96(3), 1435–1444. [DOI] [PubMed] [Google Scholar]
- Maguin K, Campo P, and Parietti-Winkler C (2009). “Toluene can perturb the neuronal voltage-dependent Ca2+ channels involved in the middle-ear reflex”, Toxicol. Sci 107, 473–481. [DOI] [PubMed] [Google Scholar]
- Rawool VW (1996). “Acoustic reflex monitoring during the presentation of 1000 clicks at high repetition rates”, Scandinavian audiology, 25(4), 239–245 [DOI] [PubMed] [Google Scholar]
- Rawool VW (2016). Auditory processing deficits due to exposure to Ototoxins. In Rawool VW (Ed). Auditory Processing Deficits New York, NY: Thieme; (pp. 430–437). [Google Scholar]
- Rawool VW, abd Dluhy C (2011). “Auditory sensitivity in opiate addicts with and without a history of noise exposure”, Noise & Health. 13(54), 356–363. [DOI] [PubMed] [Google Scholar]
- StataCorp. (2013). Stata Statistical Software: Release 13. College Station, TX: StataCorp LP. [Google Scholar]
- Thiery L, and Meyer-Bisch C (1988). “Hearing loss due to partly impulsive industrial noise exposure at levels between 87 and 90 dB(A)”, J. Acoust. Soc. Am 84(2), 651–659. [DOI] [PubMed] [Google Scholar]
- Venet T, Rumeau C, Campo P, Rieger B, Thomas A, and Cour C (2011). “Neuronal circuits involved in the middle-ear acoustic reflex”, Tox. Sci 119, 146–155. [DOI] [PubMed] [Google Scholar]
- Vyskocil A, & Droled D (2010). Mixie: Mixtures of Substances in the Workplace: Computer-Based Tool for Evaluating the Chemical Risk (Calculation of the Rm). IRSST. Retrieved from http://www.irsst.qc.ca/mixie/?en [Google Scholar]
- Vyskocil A, Drolet D, Viau C, Lemay F, Lapointe G, Tardif R, Gerin M (2007). A web tool for the identification of potential interactive effects of chemical mixtures. J Occup Environ Hyg, 4(4), 281–287. doi: 10.1080/15459620701225103 [DOI] [PubMed] [Google Scholar]
- Wathier L, Venet T, Thomas A, Nunge H, Bonfanti E, Cosnier F, Parietti-Winkler C, Campo P, Tsan P, Bouguet-Bonnet S, and Gansmüller A (2016). “Membrane fluidity does not explain how solvents act on the middle-ear reflex”. Neurotoxicology. 57, 13–21. [DOI] [PubMed] [Google Scholar]
- White H (1980). “A heteroskedasticity-consistent covariance matrix estimator and a direct test for heteroskedasticity”, Econometrica, 48, 817–838. [Google Scholar]
- World Medical Association. (2013). World Medical Association Declaration of Helsinki: ethical principles for medical research involving human subjects. JAMA, 310(20), 2191–2194. [DOI] [PubMed] [Google Scholar]
- Zhao YM, Qiu W, Zeng L, Chen SS, Cheng XR, Davis RI, and Hamernik RP (2010). “Application of the kurtosis statistic to the evaluation of the risk of hearing loss in workers exposed to high-level complex noise” Ear. Hear 31, 527–532. [DOI] [PubMed] [Google Scholar]