

Abstract
Background:
Exposure to small confined spaces evokes physiological responses such as increased heart rate in claustrophobic patients. However, little is known about electrocortical activity while these people are functionally exposed to such phobic situations. The aim of this study was to examine possible changes in electrocortical activity in this population.
Method:
Two highly affected patients with claustrophobia and two healthy controls participated in this in vivo study during which electroencephalographic (EEG) activity was continuously recorded. Relative power spectral density (rPSD) was compared between two situations of being relaxed in a well-lit open area, and sitting in a relaxed chair in a small (90 cm × 180 cm × 155 cm) chamber with a dim light. This comparison of rPSDs in five frequency bands of EEG was intended to investigate possible patterns of change in electrical activity during fear-related situation. This possible change was also compared between claustrophobic patients and healthy controls in all cortical areas.
Results:
Statistical models showed that there is a significant interaction between groups of participants and experimental situations in all frequency bands (P < 0.01). In other words, claustrophobic patients showed significantly different changes in electrical activity while going from rest to the test situation. Clear differences were observed in alpha and theta bands. In the theta band, while healthy controls showed an increase in rPSD, claustrophobic patients showed an opposite decrease in the power of electrical activity when entering the confined chamber. In alpha band, both groups showed an increase in rPSD, though this increase was significantly higher for claustrophobic patients.
Conclusion:
The effect of in vivo exposure to confined environments on EEG activity is different in claustrophobic patients than in healthy controls. Most of this contrast is observed in central and parietal areas of the cortex, and in the alpha and theta bands.
Keywords: Claustrophobia, electroencephalography, in vivo study, relative power spectral density
Introduction
Claustrophobia, being one of the specific phobias, is an anxiety disorder and the third most common among phobias in terms of prevalence.[1,2] It is exhibited as fear of being restricted or confined to one area or small enclosed spaces. Anxiety disorders negatively affect the ability to live a normal life.[3,4,5] For instance, a claustrophobic person avoids small and enclosed places that can set off fear, such as elevators, magnetic resonance imaging (MRI), airplanes, subway trains, tunnels, and car washes.[6,7] Fear of restriction and fear of suffocation are the two separate but related prominent components of claustrophobia.[8] The severity of fear can vary, like many other anxieties, and cause variable ranges of nervousness and panic in different people.[7] Symptoms of this phobia can include shortness of breath, fast heartbeat, dry mouth, and distress. These people are often very frightened even if there is not any real danger in the confined area. In fact, a claustrophobic person is frightened of what might happen in the enclosed space rather than of the enclosed space itself.[9]
In recent years, brain mapping and electroencephalography (EEG) have been used to develop a better understanding of the human brain functionality.[10,11,12] EEG signals have been investigated in mental health and anxiety disorders[13,14] such as social phobia, snake phobia, etc. Techniques such as feature extraction, analysis of specific frequency bands, power in the signals, and network analysis or connectivity have been utilized. It seems that the application of EEG as an examination tool in claustrophobia disorder is missing, and it is possible to explore this brain signal for developing a better understanding of this anxiety.
There are a few studies about clinical analysis of claustrophobia[15] and about this anxiety in MRI procedures.[6] EEG mapping is a common tool in examining different phobias. For example, such a mapping revealed that patients with social phobia have significant differences compared to normal controls suggesting hyperarousal as an important factor of anxiety. Statistical analysis of patients with social phobia demonstrated a decrease in absolute and relative delta, and theta power, an increase in absolute and relative intermediate beta power.[16] In another study of EEG mapping in spider phobia, only relative right parietal hyperactivation was found to be related to higher pretreatment spider phobia scores.[17] Also in specific phobias, results show that during phobic stimulation, a significant increase of EEG relative power happens in the gamma band.[18] Although a handful of researchers have studied EEG activity in people with different phobias, such as social phobia,[16,19] dental phobia,[20] spider phobia,[21] snake phobia,[22] specific phobia,[18] and space phobia,[23] there is almost none performed on claustrophobic patients.
The aim of this study is to compare EEG activity changes in the standard frequency bands (delta, theta, alpha, beta, and gamma), and different regions of the cortex in rest and claustrophobic state (which will be called test state hereafter). The main challenge in studies that expose participants to real situations (in vivo studies) is control of the brain activity during the experiment and noise level specifically. In this study, we have utilized the multitaper method to calculate relative power spectral density (rPSD) which is relatively immune to the noise. This is due to high-frequency resolution and low variance compared to other methods. In this study, the objective was to find a pattern of change in rPSD in different frequency bands in various regions of the cortex while exposed to the phobic environment compared to being at the rest situation. To the best of our knowledge, this study should be among the first investigations of claustrophobia with EEG modality. The outcomes of such studies could be of interest to rehabilitative paradigms.
The remainder of this paper is organized as follows: Section 2 in addition to experimental materials explains EEG data acquisition and preprocessing. Section 3 provides analysis methods including relative power spectrum density extraction and statistical analysis. Section 4 presents results and discussion. Finally, conclusions are discussed in Section 5.
Methods: Experimental Design and Electroencephalography Recording
Participates
Two female university students who classified themselves as claustrophobics volunteered to participate in this study (25 and 26 years of age). Two healthy controls of around the same age (25 and 24 years of age) were also recruited as a reference for comparisons. Subjects were chosen of the same sex to avoid gender differences that are frequently mentioned in the literature.[20] Participants were given oral explanations of the experimental procedure involving their brain activity recording and provided informed consent letter. It was explained that during the experiment, at any stage, if they feel uncomfortable, they can ask the procedure to be stopped immediately. Participants were all nonsmokers, right handed, and with no history of neurological illnesses. They were also asked to withheld taking any medication before the experiment session. This study was approved by the research ethics committee of Tabriz University of Medical Sciences (IR.TBZMED.REC.1398.690).
Design of study
This experiment was designed to compare the change in EEG activity between two claustrophobic patients and two healthy controls. An in vivo design was chosen for this experiment in which all participants would enter a real-life situation that would most probably invoke phobia. This setup would be basically different from experiments in which a visual stimulation is provided to the participant during EEG recording, and each would have their advantages or shortcomings.[24,25]
Before the recording of the EEG signal, the participants were provided with the claustrophobia questionnaire[7] which evaluates the severity of their conditions. Furthermore, they were asked to evaluate themselves as claustrophobic or not. The first part of the experiment was performed in a well-lit large room. After putting on the cap with electrodes and preparing it, the participants were asked to sit in a relaxed position with eyes open on a chair. They were asked to remain relaxed and avoid making extra body or eye movements. During this first part, EEG signals were recorded for 5 min. Parts of this collected data would be removed due to preprocessing and a minimum of 280 s of data would be available for each participant. In the second experiment, the subjects were asked to sit on a similar chair in a confined wooden room with dimensions of 90 cm × 180 cm × 155 cm (width × length × height). There was enough light in this area and the duration of EEG recording was similarly 5 min. To inhibit artifacts, the subject's ongoing EEGs were continuously monitored by experimenters during both experiments.
Electroencephalography data acquisition and preprocessing
EEG signals were recorded according to international standard 10–20 system from 31 channels (Mitsar, 24 bit A/D, 2000 Hz/channel sampling rate). Figure 1 shows the positions of the EEG electrodes on the scalp. The EEG data were stored online at a sampling rate of 500 Hz. Also, all channels were band-stop filtered between 48 and 52 Hz for the elimination of line power noise. While preparing the electrodes, impedances below 10 K ohms for each electrode site were considered acceptable. The electrodes in both the right and left hemispheres were referenced to the average potential of earlobes ([A1 + A2]/2) and with the ground at the A2 (right) earlobe.
Figure 1.
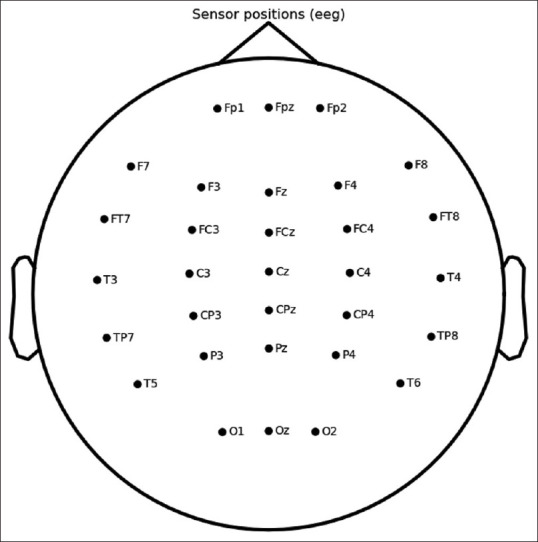
(Original) Electrode placement (10–20 standard). In this standard, electrodes are numbered from frontal (Fp1) to Occipital (Oz)
In order to eliminate artifacts, all data were visually inspected offline and interpolated for bad channels using MNE 0.20.3 Package in python (Open-source Python package for exploring, visualizing, and analyzing human neurophysiological data). To obtain reference-free EEG recordings, data were then transformed into common average reference. Eye movement, blink, and heartbeat artifacts were removed by independent components analysis (ICA; using the Infomax algorithm, MNE 0.20.03 package, python). Before the ICA step, all EEG signals were filtered with a band-pass filter with cutoff frequencies (0.5 Hz–45 Hz) that eliminates both low-frequency artifacts and high-frequency noise caused by muscle artifacts.
Statistical Analysis
Since the purpose was to explore brain activity as a result of being exposed to the claustrophobic situation, the EEG data in the rest situation (called rest state) were used as a base of comparison to the claustrophobic situation (called test state). Preprocessed EEG data, in each channel, are first divided into three nonoverlapping segments for spectral analysis. Then, the power spectral density (PSD) calculations on each segment were performed using the multitaper technique, due to high-frequency resolution and low variance. The reason for the division of the signal into three parts is to capture the dynamic state of signals which may change during the 5-min exposure to the rest or test state. This variation would be otherwise lost in PSD calculations. The multitaper method, first developed by Thomson in 1982,[26] performs very well in presence of noise and provides a more robust spectral estimation than Welch's periodograms and other classical methods, and has the advantages of both methods.[27]
After calculating the PSD spectrum in each channel and for each segment, the value of the area under the curve for delta (0.5–4 Hz), theta (4.0–8.0 Hz), alpha (8.0–13.0 Hz), beta (13.0–30.0 Hz), and gamma (30.0–45.0) frequency bands were obtained. Figure 2 shows such area for participant P1 and the first segment of the collected data in the rest state, and for the first channel (Fp1), calculated for the theta band. In order to approximate the area under this spectrum, composite Simpson's rule is commonly utilized. In this method, the area is decomposed into several parabolas whose total sum is easily calculated.
Figure 2.

(Original) Area under power spectral density (estimated with the tapered method) for participant P1. Data are taken from the first segment of the rest state from channel Fp1 and highlighted for the theta band
To calculate rPSD in each band, which will be called rPSD hereafter, the resulting area was normalized afterward with respect to the total area in the spectrum[24,25] as follows:

Finally, to assess the effect of exposure to the claustrophobic situation, we performed two statistical comparisons. First, to assess this effect on different areas of the cortex, for each frequency band of EEG, for each channel, rPSDs of segmented data were computed for two claustrophobic participants (3 segments × 2 participants) for each state (of Rest and Test). The same calculations were repeated for the two healthy controls. Repeated measures multivariate analysis of variance model was used to estimate the effect of these variables (31 channels × 5 bands × 2 states) on the relative power of EEG.
Finally, to compare the two groups of participants (claustrophobics versus controls) while exposed to phobic state (rest versus test) on the whole cortex, a two-way multivariate analysis of variance model was utilized on rPSDs (5 bands × 2 states × 2 groups). P < 0.01 was considered as statistically significant.
Results and Discussion
Questionnaire data revealed self-rated overall severity of claustrophobia to be 61, and 64 (out of 104) for claustrophobic patients #1 and #2, and 42 and 27 for the two healthy controls (#1 and #2), respectively. The effect of exposure to the phobic environment on EEG signal power separated by channels (areas of the brain) is shown in Figure 3 for each of the five bands of interest only for the two claustrophobic patients. Multivariate test results revealed that band has a significant effect on rPSD level (P < 0.01). As can be seen, exposure to the phobic environment (claustrophobic patients) clearly decreased average rPSDs for two bands (delta and theta), increased average rPSDs for two bands (alpha and beta), and caused a decrease of rPSD in the gamma band for most areas in the cortex.
Figure 3.

(Original) relative power spectral densities separated into 5 subplots for frequency bands of interest. In each band, mean relative power spectral densities (6 data points) are presented for each of 31 channels between two experimental conditions of rest/test only for claustrophobic patients
With two participants in each group, we do not have enough statistical power to examine the effect of exposure to the claustrophobic situation in different areas of the cortex. However, if we ignore the effect of multiple comparisons on α inflation, we could simplistically compare rPSDs in each band and each electrode's signal. Only for alpha band such comparisons are shown for the two groups of participants in Figure 4a and b. This could hypothetically highlight the areas of the cortex in which the effects of exposure are significant. For example, these comparisons could acknowledge that claustrophobia, like many other anxiety disorders, causes a significant change in the alpha band in parietal areas.[21,28,29,30,31]
Figure 4.

(Original) Average of relative power spectral density under rest and test states for alpha band, for (a) Claustrophobic Patients, and (b) Healthy Controls. (n.s. – Nonsignificant difference; *P < 0.05, **P < 0.01, ***P < 0.001)
The aggregate effect over the whole cortex area due to exposure to the phobic state is shown in Figure 5. To display the individual differences between the subjects, the effect of phobia on the rPSDs for each of the bands is first demonstrated for the claustrophobic patients and the two healthy controls [Figure 5, the first two rows] separately. The multivariate model that evaluates the effect of exposure revealed that there was a significant interaction between exposure (rest vs. test) to the phobic state and groups of study (claustrophobic versus control). The two-way multivariate analysis of variance showed a significant interaction between the two factors affecting the rPSDs in the electrical activity of the whole brain. The overall effect of exposure is shown in Figure 5 (rows 3–4 for each of the groups) in which patterns for each band look different between healthy controls and claustrophobic patients. Table 1 summarizes the results of interaction between situation and group while performing tests of between-subjects effect. The two bands of interest in the study of phobias were theta and alpha bands. In the theta band, being placed in the confined chamber increased electrical activity for the healthy controls, whereas it caused a clear decrease for the claustrophobic patients. In the alpha band, although this exposure to the phobic state increased electrical activity for both groups, this increase was obviously amplified for the claustrophobic patients. The most distinct change is in the alpha band (partial eta squared showed that alpha and theta accounted for 45% and 37% of the variance in the model respectively for claustrophobic patients).
Figure 5.

(Original) Comparison of average relative power spectral densities, between rest and test states separated into 5 frequency bands of interest for claustrophobic patients #1–2, and healthy controls #1–2. Aggregate values for claustrophobic patients and healthy controls are presented in 3rd and 4th rows, respectively
Table 1.
Results of statistical analysis presented as the level of significance showing interaction between experimental situations (rest/test) and groups of participants (claustrophobic patients/healthy controls) on relative power spectral density in 5 different bands of electroencephalographic activity
| Frequency band Group situation* | Sum of squares | df | Mean square | F | Significance |
|---|---|---|---|---|---|
| Delta | 0.326 | 1 | 0.326 | 19.988 | 0.000 |
| Theta | 0.215 | 1 | 0.215 | 132.281 | 0.000 |
| Alpha | 0.349 | 1 | 0.349 | 57.621 | 0.000 |
| Beta | 0.027 | 1 | 0.027 | 16.975 | 0.000 |
| Gamma | 0.077 | 1 | 0.077 | 95.732 | 0.000 |
All significance values are <.001
Conclusion
The two claustrophobic participants in this study were chosen according to the total scores of their claustrophobia questionnaire which were well above the cutoff score. Being exposed to a claustrophobic environment (compared to the rest state) clearly altered the power of EEG in most areas of the cortex. However, the number of participants in this study did not allow us to separate the areas in which this alteration was significant. Furthermore, such exposure to phobic state created a different effect in different frequency bands of cortical activity. In other words, for claustrophobic patients, rPSDs increased in alpha and beta bands, whereas they decreased in delta, theta, and gamma bands.
When compared to healthy controls, the statistical analysis revealed that there is a significant interaction between the experimental situation and groups of study in all frequency bands. In other words, the way exposure to the phobic situation affects electrical activity in the brain, definitely depends on the group of study. Hence, the claustrophobic brain reacts very differently than the otherwise healthy control brain.
Finally, most of this clear change in the alpha band in claustrophobic patients comes from the change of activity in central and parietal areas of the cortex [Figure 4a] which is in accordance with the literature.[20,21,28,29,32] To provide more reliable model of change in EEG activity in claustrophobia, there is a clear need for more comprehensive study.
Ethical standards
The study was conducted in accordance with the ethical guidelines of the Research Ethics Committee of Tabriz University of Medical Sciences (IR.TBZMED. REC.1398.690). Informed consent was obtained from both groups of participants included in the study
Financial support and sponsorship
None.
Conflicts of interest
There are no conflicts of interest.
Acknowledgment
The authors would like to thank and convey their appreciation of the time and efforts that participants put into this study. Thanks to Dr. Maryam Moghadam Salimi for support and sharing the environment of the Brain and Cognition Laboratory, Department of Rehabilitation Science, Tabriz University of Medical Sciences, Tabriz, Iran.
References
- 1.Ost LG. The claustrophobia scale: A psychometric evaluation. Behav Res Ther. 2007;45:1053–64. doi: 10.1016/j.brat.2004.10.004. [DOI] [PubMed] [Google Scholar]
- 2.Albini M, Morano A, Fattouch J, Fanella M, Avorio F, Basili LM, et al. Anxiety as the only manifestation of focal non-convulsive status epilepticus: Case report and review of the literature. Neurocase. 2020;26:98–102. doi: 10.1080/13554794.2020.1741647. [DOI] [PubMed] [Google Scholar]
- 3.Andrews G. Anxiety, personality and anxiety disorders. Int Rev Psychiatry. 1991;3:293–302. [Google Scholar]
- 4.Gothelf D, Aharonovsky O, Horesh N, Carty T, Apter A. Life events and personality factors in children and adolescents with obsessive-compulsive disorder and other anxiety disorders. Compr Psychiatry. 2004;45:192–8. doi: 10.1016/j.comppsych.2004.02.010. [DOI] [PubMed] [Google Scholar]
- 5.Coelho CM, Gonçalves-Bradley D, Zsido AN. Who worries about specific phobias. A population-based study of risk factors? J Psychiatr Res. 2020;126:67–72. doi: 10.1016/j.jpsychires.2020.05.001. [DOI] [PubMed] [Google Scholar]
- 6.Eshed I, Althoff CE, Hamm B, Hermann KG. Claustrophobia and premature termination of magnetic resonance imaging examinations. J Magn Reson Imaging. 2007;26:401–4. doi: 10.1002/jmri.21012. [DOI] [PubMed] [Google Scholar]
- 7.Radomsky AS, Rachman S, Thordarson DS, McIsaac HK, Teachman BA. The claustrophobia questionnaire. J Anxiety Disord. 2001;15:287–97. doi: 10.1016/s0887-6185(01)00064-0. [DOI] [PubMed] [Google Scholar]
- 8.Booth R, Rachman S. The reduction of claustrophobia—I. Behav Res Ther. 1992;30:207–21. doi: 10.1016/0005-7967(92)90067-q. [DOI] [PubMed] [Google Scholar]
- 9.Van Diest I, Smits D, Decremer D, Maes L, Claes L. The Dutch claustrophobia questionnaire: Psychometric properties and predictive validity. J Anxiety Disord. 2010;24:715–22. doi: 10.1016/j.janxdis.2010.05.003. [DOI] [PubMed] [Google Scholar]
- 10.Asadzadeh S, Rezaii TY, Beheshti S, Delpak A, Meshgini S. Systematic review of EEG source localization techniques and their applications on diagnosis of brain abnormalities. J Neurosci Methods. 2019;339:1–21. doi: 10.1016/j.jneumeth.2020.108740. [DOI] [PubMed] [Google Scholar]
- 11.Horrobin SL, McNair NA, Kirk IJ, Waldie KE. Dexamphetamine normalises electrophysiological activity in attention deficit-hyperactivity disorder during the Stroop task. Neurocase. 2007;13:301–10. doi: 10.1080/13554790701770850. [DOI] [PubMed] [Google Scholar]
- 12.Osumi M, Sano Y, Ichinose A, Wake N, Yozu A, Kumagaya SI, et al. Direct evidence of EEG coherence in alleviating phantom limb pain by virtual referred sensation: Case report. Neurocase. 2020;26:55–9. doi: 10.1080/13554794.2019.1696368. [DOI] [PubMed] [Google Scholar]
- 13.Livint Popa L, Dragos H, Pantelemon C, Verisezan Rosu O, Strilciuc S. The role of quantitative EEG in the diagnosis of neuropsychiatric disorders. J Med Life. 2020;13:8–15. doi: 10.25122/jml-2019-0085. [DOI] [PMC free article] [PubMed] [Google Scholar]
- 14.Binks S, Chan D, Medford N. Abolition of lifelong specific phobia: A novel therapeutic consequence of left mesial temporal lobectomy. Neurocase. 2015;21:79–84. doi: 10.1080/13554794.2013.873056. [DOI] [PubMed] [Google Scholar]
- 15.Rachman S, Taylor S. Analyses of claustrophobia. J Anxiety Disord. 1993;7:281–91. [Google Scholar]
- 16.Moscovitch DA, Santesso DL, Miskovic V, McCabe RE, Antony MM, Schmidt LA. Frontal EEG asymmetry and symptom response to cognitive behavioral therapy in patients with social anxiety disorder. Biol Psychol. 2011;87:379–85. doi: 10.1016/j.biopsycho.2011.04.009. [DOI] [PubMed] [Google Scholar]
- 17.Leutgeb V, Schäfer A, Schienle A. An event-related potential study on exposure therapy for patients suffering from spider phobia. Biol Psychol. 2009;82:293–300. doi: 10.1016/j.biopsycho.2009.09.003. [DOI] [PubMed] [Google Scholar]
- 18.Gemignani A, Sebastiani L, Simoni A, Santarcangelo EL, Ghelarducci B. Hypnotic trait and specific phobia: EEG and autonomic output during phobic stimulation. Brain Res Bull. 2006;69:197–203. doi: 10.1016/j.brainresbull.2005.12.003. [DOI] [PubMed] [Google Scholar]
- 19.Sachs G, Anderer P, Dantendorfer K, Saletu B. EEG mapping in patients with social phobia. Psychiatry Res. 2004;131:237–47. doi: 10.1016/j.pscychresns.2003.08.007. [DOI] [PubMed] [Google Scholar]
- 20.Schienle A, Köchel A, Leutgeb V. Frontal late positivity in dental phobia: A study on gender differences. Biol Psychol. 2011;88:263–9. doi: 10.1016/j.biopsycho.2011.08.010. [DOI] [PubMed] [Google Scholar]
- 21.Merckelbach H, Muris P, Pool K, De Jong PJ. Resting eeg asymmetry and spider phobia. Anxiety Stress Coping. 1998;11:213–23. [Google Scholar]
- 22.Bornas X, Noguera M, Tortella-Feliu M, Llabrés J, Montoya P, Sitges C, et al. Exposure induced changes in EEG phase synchrony and entropy: A snake phobia case report. Int J Clin Heal Psychol. 2010;10:167–79. [Google Scholar]
- 23.Marks I. Space “phobia”: A pseudo-agoraphobic syndrome. J Neurol Neurosurg Psychiatry. 1981;44:387–91. doi: 10.1136/jnnp.44.5.387. [DOI] [PMC free article] [PubMed] [Google Scholar]
- 24.Clemente D, Davì L, de Monte E. Use of digital stimulation in the treatment of phobias: Results following EEG and evoked potential. J Technol Behav Sci. 2020;5:40–6. [Google Scholar]
- 25.Li Z, Wu X, Xu X, Wang H, Guo Z, Zhan Z, et al. The recognition of multiple anxiety levels based on electroencephalograph. IEEE Trans Affect Comput. 2019:1–12. [Google Scholar]
- 26.Thomson DJ. Spectrum estimation and harmonic analysis. Proc IEEE. 1982;70:1055–96. [Google Scholar]
- 27.Prerau MJ, Brown RE, Bianchi MT, Ellenbogen JM, Purdon PL. Sleep neurophysiological dynamics through the lens of multitaper spectral analysis. Physiology (Bethesda) 2017;32:60–92. doi: 10.1152/physiol.00062.2015. [DOI] [PMC free article] [PubMed] [Google Scholar]
- 28.Kamaradova D, Brunovsky M, Prasko J, Horacek J, Hajda M, Grambal A, et al. EEG correlates of induced anxiety in obsessive-compulsive patients: Comparison of autobiographical and general anxiety scenarios. Neuropsychiatr Dis Treat. 2018;14:2165–74. doi: 10.2147/NDT.S169172. [DOI] [PMC free article] [PubMed] [Google Scholar]
- 29.Li Y, Wang W, Liu T, Ren L, Zhou Y, Yu C, et al. Source analysis of P3a and P3b components to investigate interaction of depression and anxiety in attentional systems. Sci Rep. 2015;(5):1–15. doi: 10.1038/srep17138. 17138. [DOI] [PMC free article] [PubMed] [Google Scholar]
- 30.Kolassa IT, Kolassa S, Bergmann S, Lauche R, Dilger S, Miltner W, et al. Interpretive bias in social phobia: An ERP study with morphed emotional schematic faces. Cogn Emot. 2009;23:69–95. [Google Scholar]
- 31.Leutgeb V, Schäfer A, Schienle A. Late cortical positivity and cardiac responsitivity in female dental phobics when exposed to phobia-relevant pictures. Int J Psychophysiol. 2011;79:410–6. doi: 10.1016/j.ijpsycho.2011.01.003. [DOI] [PMC free article] [PubMed] [Google Scholar]
- 32.Kolassa IT, Miltner WH. Psychophysiological correlates of face processing in social phobia. Brain Res. 2006;1118:130–41. doi: 10.1016/j.brainres.2006.08.019. [DOI] [PubMed] [Google Scholar]