Abstract
Background/Aims
Tacrolimus has been used as an immunosuppressive agent in organ transplantation. Despite the therapeutic benefits, tacrolimus’s use is limited due to its nephrotoxicity. To reduce tacrolimus nephrotoxicity, effective humanized experimental models may be helpful. Here, we modeled tacrolimus nephrotoxicity using kidney organoids derived from human inducible pluripotent stem cells (iPSCs) in vitro.
Methods
Kidney organoids were differentiated from the CMC11 iPSC cell line, re-seeded in 96-well plates, and treated with tacrolimus at doses of 0, 30, or 60 μM for 24 hours. This in vitro model was compared to a mouse model of tacrolimus nephrotoxicity and the associated mechanisms were investigated.
Results
The size of the kidney organoids and cell viability decreased in dose-dependent manners after treatment with tacrolimus. The number of tubular cells decreased with a loss of polarity, similar to the effects seen in mouse tacrolimus nephrotoxicity. Ultrastructural analysis showed numerous vacuoles in the proximal tubular cells of the kidney organoids treated with tacrolimus. Tacrolimus treatment induced oxidative stress and mitochondrial dysfunction, and autophagic activity was enhanced in the kidney organoids. Rapamycin, an autophagy inducer, accelerated cell death in the kidney organoid model of tacrolimus nephrotoxicity, which was attenuated by treatment with 3-methyladenine, an autophagy inhibitor. These findings indicate that the augmentation of autophagy by rapamycin treatment accelerated tacrolimus nephrotoxicity.
Conclusions
Our data suggest that human kidney organoids are an effective in vitro model of tacrolimus nephrotoxicity and that autophagy plays a critical role in tacrolimus nephrotoxicity.
Keywords: Autophagy, Kidney, Organoids, Tacrolimus
INTRODUCTION
Tacrolimus, a calcineurin inhibitor, is currently the main calcineurin inhibitor used clinically as an immunosuppressive agent in organ transplantation or glomerulonephritis [1,2]. Despite the therapeutic benefits of tacrolimus, its use is limited due to its nephrotoxicity [1–4]. Tacrolimus nephrotoxicity occurs in acute and chronic forms and affects arterioles, glomeruli, tubules, and the interstitium [1]. The pathologic features of acute nephrotoxicity of tacrolimus are arteriolopathy with necrosis and hyalinization and tubulopathy with isometric vacuolation [1]. In chronic nephrotoxicity, hyaline arteriolopathy, segmental or global glomerulosclerosis, interstitial fibrosis, and tubular atrophy are observed [1]. Identifying the precise mechanisms underlying tacrolimus nephrotoxicity may help reduce or prevent tacrolimus nephrotoxicity and contribute to finding new biomarkers to predict tacrolimus nephrotoxicity [2,3].
To investigate mechanisms underlying tacrolimus nephrotoxicity, effective experimental in vivo or in vitro models are essential. Animal models have contributed to the investigation but have been limited by species differences from humans and animal ethics [5]. In vitro studies using primary cells or immortalized cell lines may overcome the limitation of animal studies, but also have some limitations associated with cell sourcing problems, inter-donor variability, and the loss of their functional characteristics during passaging [6]. Cell-to-cell and cell-to-extracellular matrix interactions control cell phenotypes and functions, and maintaining these interactions is required for tissue-like responses in an in vitro model for drug toxicity testing [7,8]. However, two-dimensional (2D) cultures on culture plastics with a single renal cell type may have difficulty recapitulating these complex conditions [9].
Recently, we and others have established several different protocols for the generation of kidney organoids from human pluripotent stem (hPS) cells in the multicellular 3D culture system. Kidney organoids have nephron-like structures containing glomeruli, segmented tubules with proximal tubules and distal tubules, interstitial cells, and endothelial cells and can recapitulate the development and diseases of the human kidney [10–16]. For this reason, kidney organoids derived from hPS cells have been considered promising systems for drug nephrotoxicity testing and research on drug-induced nephrotoxicity in in vitro systems using kidney organoids has been conducted [10,12,17]. So far, the predictive efficacy of an in vitro model using kidney organoids for drug nephrotoxicity investigations is still challenging, as is studying the mechanism of the nephrotoxicity. Here, we investigated the prediction of tacrolimus nephrotoxicity using the human inducible pluripotent stem cell (iPSC)-derived kidney organoid model and identified the role of autophagy in regulating drug-induced cell death.
METHODS
Human iPS cell culture and kidney organoid differentiation
The CMC11 iPSCs were obtained from The Catholic University of Korea (male donor). The cells were used between passages 20 and 40. The kidney organoid differentiation was performed as described previously [10,11]. In brief, human iPSCs were plated at a density of 5,000 cells/well on a 24-well plate in mTeSR1 medium (Stem Cell Technologies, Vancouver, BC, Canada) plus 10 μM Y27632 (LC Laboratories, https://www.lclabs.com/) on glass plates (LabTek, Queensland, Australia) coated with 3 % GelTrex (Thermo Fisher Scientific, Waltham, MA, USA) (day 3). The medium was exchanged for 1.5% GelTrex in mTeSR1 (day 2), mTeSR1 (day 1), RPMI (Thermo Fisher Scientific) plus 12 μM CHIR99021 (Tocris, Seongnam, Korea) (day 0), or RPMI plus B27 supplement (Thermo Fisher Scientific) (day 1.5) and the cells were fed every 2 to 3 days to promote kidney organoid differentiation.
Treatment of tacrolimus and rapamycin
Kidney organoids were re-seeded in a 96-well plate on day 18 and treated with tacrolimus at doses of 0, 30, and 60 μM for 24 hours at 37°C in a 5% CO2 incubator. To examine the role of autophagy in tacrolimus nephrotoxicity, the organoids were treated with rapamycin at doses of 25, 50, 75, and 100 μM, and tacrolimus at a dose of 60 μM.
Immunofluorescence analysis
For immunofluorescence analysis, the organoids were fixed on day 18, unless otherwise noted. For fixation, an equal volume of phosphate-buffered saline (PBS) (Thermo Fisher Scientific) plus 8% paraformaldehyde (Electron Microscopy Sciences, Thermo Fisher Scientific) was added to the medium for 15 minutes, after which the sample was washed three times with PBS. The fixed organoid cultures were blocked in 5% donkey serum (Millipore, Burlington, MA, USA) plus 0.3% TritonX100/PBS, and incubated overnight in 3% bovine serum albumin (BSA, Sigma, St. Louis, MO, USA) plus PBS with primary antibodies. Then, the cells were washed, incubated with Alexa Fluor secondary antibodies (Invitrogen, Carlsbad, CA, USA), washed, and stained with 4,6-diamidino-2-phenylindole (DAPI) or mounted in Vectashield H1000. The following primary antibodies were used: anti-lotus tetragonolobus lectin (LTL) (Vector Labs FL1321, Burlingame, CA, USA; 1:500 dilution), anti-ZO1 (Invitrogen 339100; 1:100), anti-NPHS1 (R&D AF4269, R&D Systems, Minneapolis, MN, USA; 1:500), anti-ECAD (Abcam ab11512, Cambridge, UK; 1:100), anti-claudin 1 (Abcam an15098; 1:100), anti-WT1 (Abcam ab89901; 1:100), anti-laminin (Sigma-Aldrich L9393; 1:200), and anti-PECAM1 (Abcam ab9498; 1:200).
3D cell viability assay and live/dead cell staining
For the 3D cell viability assay, an equal volume of CellTiter-Glo 3D Reagent (Promega, Madison, WI, USA) was added to the kidney organoid culture medium in each well of the 96-well plate. The contents were mixed for 5 minutes to induce cell lysis. The plate was incubated at room temperature for 25 minutes and the luminescence was recorded. For live/dead cell staining, the live/dead viability/cytotoxicity kit reagents (ethidium homodimer 2 mM, calcein-AM 4 mM; Thermo Fisher Scientific) were added to the kidney organoids for 1 hour in the incubator after washing once with PBS. The cells were washed twice with PBS, and a z-stack fluorescence image was obtained using a fluorescence microscope.
Electron microscopy analysis
The kidney organoid in vitro samples were fixed in 4% paraformaldehyde and 2.5% glutaraldehyde in 0.1 M phosphate buffer overnight at 4°C. After washing in 0.1 M phosphate buffer, the samples were post-fixed with 1% osmium tetroxide in the same buffer for 1 hour at 4°C. Next, the samples were dehydrated in a series of graded ethyl alcohol solutions, exchanged through acetone, and embedded in Epon 812.
Ultrathin sections (70 to 80 nm) were cut using an ultramicrotome (Leica Ultracut UCT, Wetzlar, Germany). The ultrathin sections were double-stained with uranyl acetate and lead citrate and examined under a transmission electron microscope (JEM 1010, JEOL, Tokyo, Japan) at 60 kV. For quantitative analysis, 20 low-magnification (× 6,000) fields were randomly selected from each section of the cortex and the number of autophagosomes per 100 μm2 was determined.
Western blot analysis
The kidney organoids were homogenized in boiling lysis buffer (1% sodium dodecyl sulfate [SDS], 1 mM sodium orthovanadate, and 10 mM Tris, pH7.4) and the protein concentration was determined with the BCA protein assay kit (Pierce Biotechnology Inc., Waltham, MA, USA). Equal amounts of the protein were separated on SDS-polyacrylamide gel and the gel was transferred onto a nitrocellulose membrane. For immunodetection, the blots were incubated overnight in PBS containing 0.1% Tween-20 and 5% skim milk and the primary antibody. The blots were washed and then incubated with a secondary antibody conjugated to horseradish peroxidase (Jackson ImmunoResearch Laboratories, West Grove, PA, USA) and the blots were visualized using a Western blotting luminol reagent kit (Santa Cruz Biotechnology, Santa Cruz, CA, USA).
Mitochondria and lysosome staining and reactive oxygen species detection
For the mitochondrial staining, after washing once with PBS, 5 mM Mitotracker (Thermo Fisher Scientific) and 200 mM Hoechst (Thermo Fisher Scientific) were added to the cells. For lysosome staining, 5 μM LysoMitotracker (Thermo Fisher Scientific) and 200 mM Hoechst (Thermo Fisher Scientific) were added to the cells. After incubation for 1 hour, a z-stack fluorescence image was obtained using a fluorescence microscope. MitoSOX Red (Thermo Fisher Scientific) was applied to measure the superoxide anion levels. The kidney organoids were treated with Hoechst 33342 (200 mM) for 1 hour and MitoSOX Red (5 μM) for 15 minutes at 37°C in the dark and washed with PBS. A z-stack fluorescence image was obtained using a fluorescence microscope.
Detection of autophagosomes
The tacrolimus-treated kidney organoids were washed twice with 1× Assay buffer and treated with 100 μL of Microscopy Dual Detection Reagent (CYTO-ID Green Detection Reagent, Hoechst 33342, and 1× Assay buffer) per well and incubated for 30 minutes in the dark. After staining, the kidney organoids were washed with 1× Assay buffer and a z-stack fluorescence image was obtained using a fluorescence microscope.
Measurement of mitochondrial membrane potential and intracellular calcium potential
To measure the mitochondrial membrane potential, tacrolimus-treated kidney organoids were incubated with tetramethylrhodamine ethyl ester (TMRE; 200 nM; Thermo Fisher Scientific) for 30 minutes and Hoeschst 33342 (200 mM) for 1 hour in the dark and washed with 0.2% BSA in PBS. For the detection of intracellular calcium potential, the kidney organoids were washed with PBS and treated with the Fluo-8 calcium assay kit reagent (5 μM; AAT Bioquest, Sunnyvale, CA, USA) for 1 hour at 37°C in the dark. Then, the kidney organoids were washed with PBS, and a z-stack fluorescence image was obtained using a fluorescence microscope.
Real-time quantitative reverse transcription polymerase chain reaction
RNA was extracted from the cell lysates and mice kidney samples using NucleoSpin RNA/Protein columns (Macherey-Nagel), and reverse-transcribed with M-MLV reverse transcriptase (Promega) according to the manufacturers’ protocols. The complementary DNA was mixed with SYBR Green and primers for the target genes. The following primers were used: CDH16 (F: 5; CCTCATCCTCATTTTCACC 3′, R: 5′ GGGCTTCTACTCTGTCCTG 3′), PCAM1 (F: 5′ TCATTACGGTCACAATGACGA 3′, R: 5′ GAGTATCTGCTTTCCACGGC 3′), NPHS1 (F: 5′ GGCTCCCAGCAGAAACTCTT 3′, R: 5′ CACAGACCAGCAACTGCCTA 3′), WT1 (F: 5′ GCGGAGCCCAATACAGAATA 3′, R: 5′ GATGCCGACCGTACAAGAGT 3′), SYNPO (F: 5′ GCTGAGGAGGTGAGATGCAG 3′, R: 5′ CTCTGGAGAAGGTGCTGGTG 3′).
Mouse model of tacrolimus-induced renal injury
All experiments were conducted according to the recommendations and ethical guidelines of the Animal Care and Use Committee of The Catholic University of Korea. All experimental animals were euthanized under xylazine (rompun) anesthesia. Eight-week-old male BALB/c mice (ORIENT BIO, Seongnam, Korea) were provided with a 0.01% salt diet (Research Diets Inc., New Brunswick, NJ, USA) and water ad libitum. After 1-week acclimatization, weight-matched mice were randomly sorted into four groups (n = 8/group) and treated subcutaneously with 1.5 mg/kg/day of Tac (Prograf, Astellas Pharma, Ibaraki, Japan) or 10 mL/kg/day of the vehicle (Vh, olive oil; Sigma-Aldrich) for 4 weeks. The animals were then anesthetized, and blood samples and tissue specimens were obtained for further analysis.
Histologic analysis
Some kidney sections were processed and stained with Periodic acid-Schiff or Masson’s trichrome stain. The degree of tubulointerstitial fibrosis was scored as follows: 0, normal tubules with no fibrosis; 1, mild interstitial fibrosis with nearly normal tubules; 2, moderate interstitial fibrosis with some increased thickness of the tubular basement membrane; and 3, marked interstitial fibrosis with diffuse, increased thickness of the tubular basement membrane. Histopathological analysis was performed in randomly selected cortical fields. Tubular injury was scored based on the presence of tubular atrophy and isometric tubular vacuolization: 0, no changes present; grade 1, ≤ 25%; grade 2, 26% to 50%; and grade 3, > 50%. Glomerular injury was graded 0 to −3 for sclerosis and mesangial matrix expansion as a marker of glomerular ischemia and damage [18].
Immunohistochemical analysis
Some kidney sections were processed for post-embedding immunohistochemical analysis. After deparaffinization, the sections were hydrated and incubated with 0.5% Triton X-100/PBS solution for 30 minutes and then washed with PBS three times. The nonspecific binding sites were blocked with normal donkey serum diluted 1:10 in PBS for 1 hour and the sections were incubated overnight at 4°C in primary antibody. After rinsing in PBS, the sections were incubated in peroxidase-conjugated anti-mouse or anti-rabbit immunoglobulin G (Jackson ImmunoResearch Laboratories) for 1 hour. For coloration, the sections were incubated with a mixture of 0.05% 3,3′-diaminobenzidine containing 0.01% H2O2 at room temperature until a brown color was visible and then the sections were washed with Tris buffer (pH 7.6), counterstained with hematoxylin, and observed under light microscopy. The sections were scanned and automatically digitized using a (Leica SCN400), and the images were analyzed using software (Tissuemorph/DP, Visiopharm, Denmark). The tissue slides were probed with antibodies against collagen IV (SouthernBiotech, Birmingham, AL, USA; 1:100).
RESULTS
Cell viability in the model of tacrolimus nephrotoxicity using human iPSC-derived kidney organoids
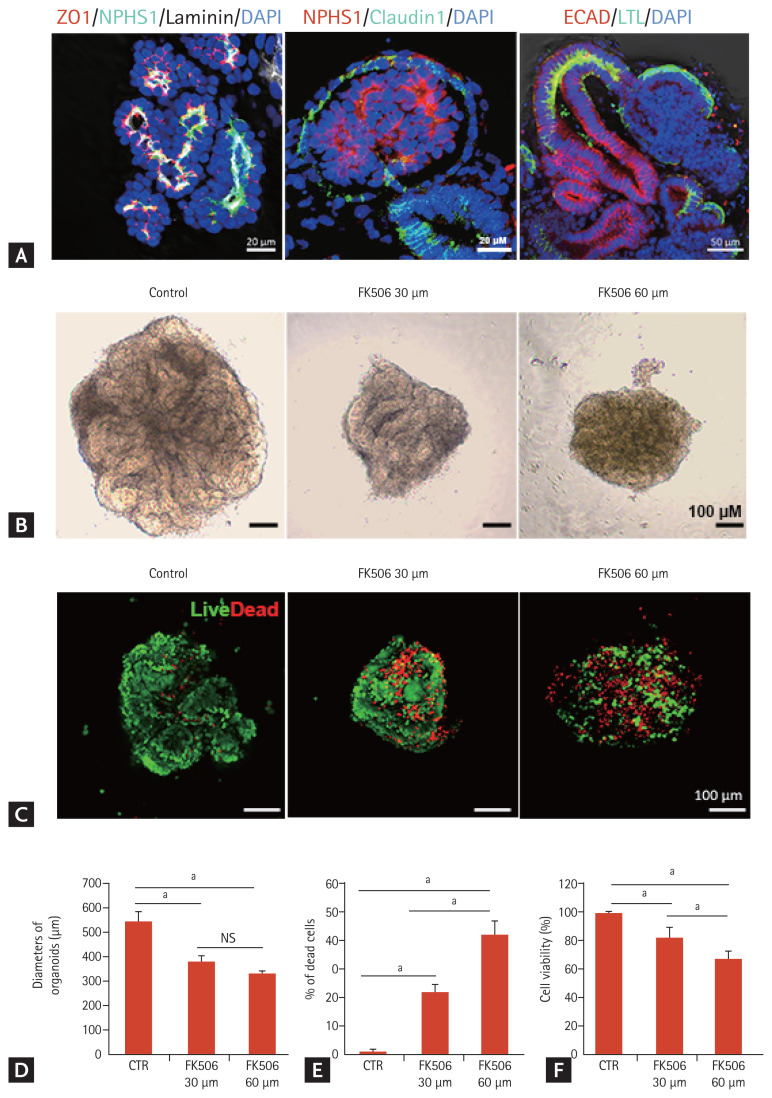
To examine tacrolimus nephrotoxicity using iPSC-derived kidney organoids, we applied an adherent culture differentiation protocol. The iPSC-kidney organoids had discrete nephron-like structures containing podocytes, parietal epithelial cells, proximal tubules, and distal tubules (Fig. 1A).
Figure 1.
Cell viability in the tacrolimus nephrotoxicity model using inducible pluripotent stem cell (iPSC)-derived kidney organoids. (A) Representative confocal fluorescence images showing podocytes (NPHS1), parietal epithelial cells (claudin 1), proximal tubules (lotus tetragonolobus lectin [LTL]), distal tubules (E-cadherin), glomerular basement membrane (laminin), and tight junctions (ZO1) in kidney organoids in vitro. Scale bars: 20 μm, 50 μm. (B) Representative image of the morphology of the control kidney organoid and tacrolimus-treated kidney organoids in bright field microscopy. Scale bars: 100 μm. (C) Representative images of live/dead staining. Scale bars: 100 μm. (D) Diameters of the organoids after tacrolimus treatment. NPHS1 (n = 3). (E) Percentage of dead cells (n = 3). (F) Viability of kidney organoids measured by the Cell Counting Kit 8 assay (n = 3). Values are mean ± standard error of the mean. DAPI, 4,6-diamidino-2-phenylindole; ECAD, E-cadherin; CTR, control; NS, no significance. ap < 0.05.
The kidney organoids were micro-dissected and re-seeded on day 18 of the differentiation to 96-well plates and treated with tacrolimus at doses of 0, 30, or 60 μM for 24 hours. The size of the kidney organoids decreased with deformation of the tubule-like structures after tacrolimus treatment (Fig. 1B and 1D). Live/dead cell staining revealed that the proportion of dead cells increased in a dose-dependent manner (Fig. 1C and 1E). Nephrotoxicity was also assessed using the CCK-8 assay. Cell viability decreased from 100% at 0 μM tacrolimus to 60% at 60 μM (Fig. 1F).
Comparison of the structural changes between iPSC-derived kidney organoids and the in vivo model of tacrolimus nephrotoxicity
To determine whether iPSC-derived kidney organoids could recapitulate the structural changes of tacrolimus nephrotoxicity, we analyzed the structural changes of iPSC-derived kidney organoids in the tacrolimus nephrotoxicity model and compared them to those of the mouse model of tacrolimus nephrotoxicity.
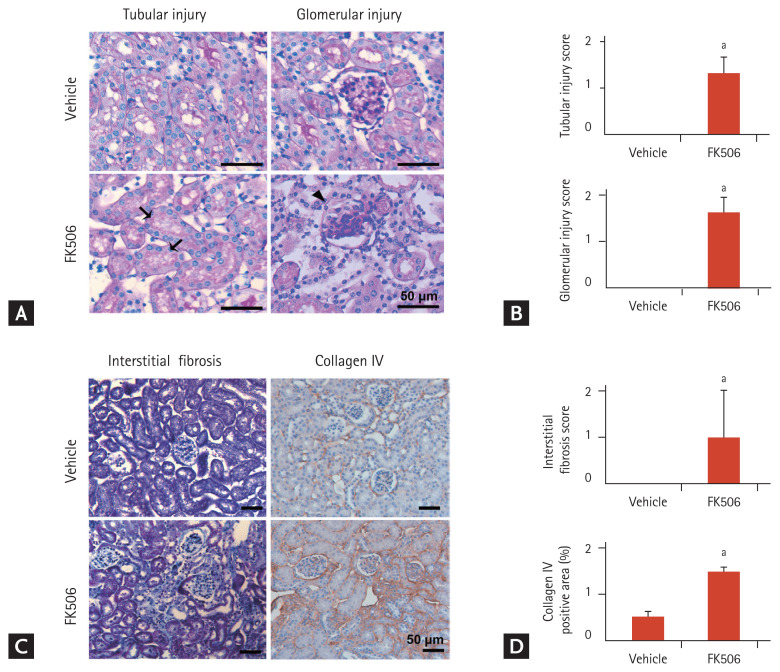
First, we examined the histological changes in the in vivo model of tacrolimus nephrotoxicity. The tubular injury scores reflected histological alterations including tubular atrophy and isometric tubular vacuolization, and the glomerular injury scores, reflecting glomerulosclerosis, were increased in the mouse model of tacrolimus nephrotoxicity (Fig. 2A and 2B). Tubulointerstitial fibrosis was prominent in the mouse model of tacrolimus nephrotoxicity (Fig. 2C and 2D).
Figure 2.
Histopathological change of kidney sections in the mouse model of tacrolimus nephrotoxicity. (A, B) Representative Periodic acid-Schiff staining images showing tubular and glomerular injury. Scale bars: 50 μm (n = 3). Black arrows indicate isometric tubular vacuolization and arrowheads indicate glomerulosclerosis. (C, D) Representative Masson’s trichrome staining and immunohistochemical staining images of collagen IV expression, showing fibrosis. Scale bars: 50 μm (n = 3). Values are mean ± standard error of the mean. ap < 0.05.
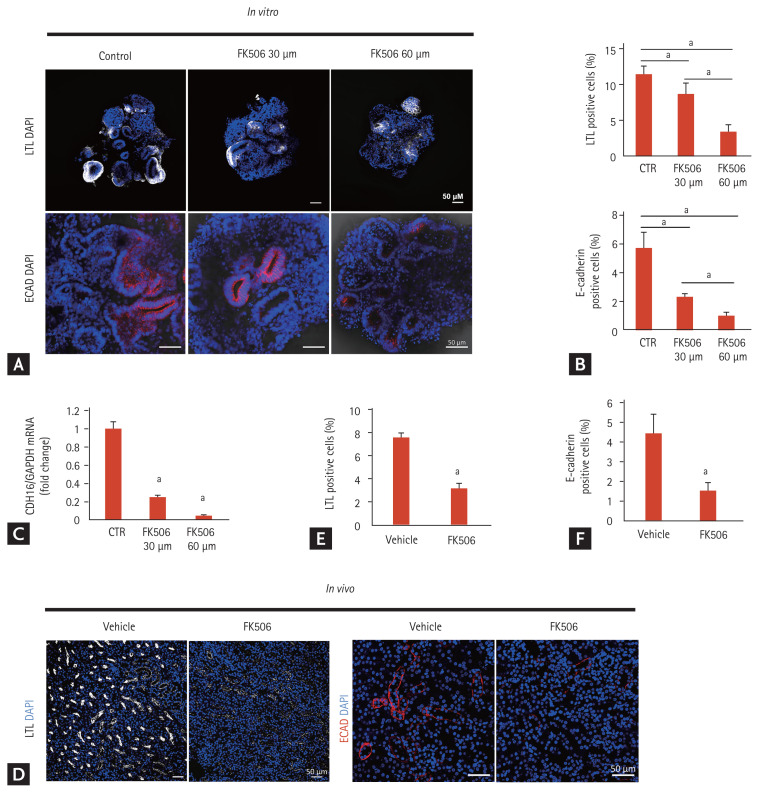
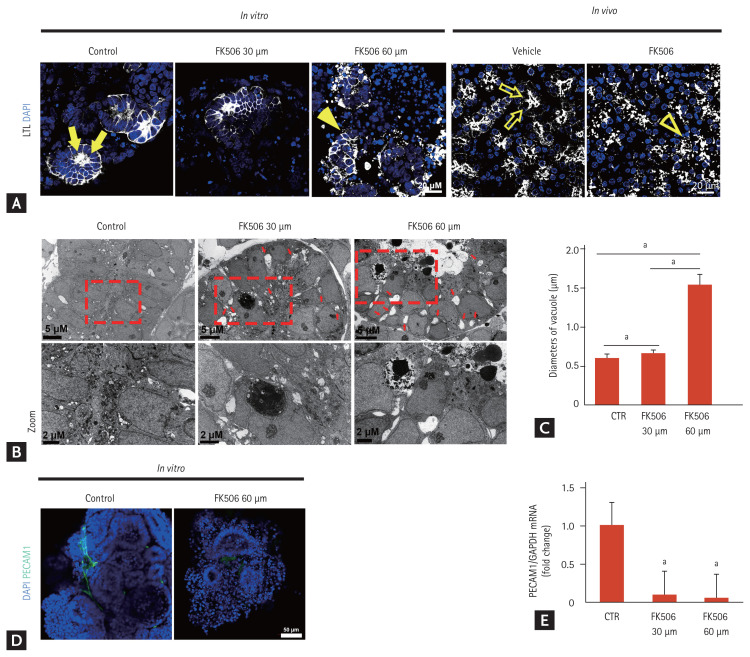
Next, we examined the structural changes in iPSC-derived kidney organoids after tacrolimus treatment. The proximal tubular cells (LTL-positive area), as well as the distal tubular cells (E-cadherin-positive area) in the iPSC-derived kidney organoids decreased according to the concentration of tacrolimus, similar to the in vivo model (Fig. 3). The apical expression of the brush border marker LTL in the kidney organoids as well as in the in vivo model was dispersed after tacrolimus treatment, suggesting disruption of the polarity of the proximal tubules in tacrolimus nephrotoxicity (Fig. 4A).
Figure 3.
Comparison of expression of proximal and distal tubular markers between in vitro model using inducible pluripotent stem cell (iPSC)-derived kidney organoids and the mouse model of tacrolimus nephrotoxicity. (A) Representative confocal fluorescence images showing proximal tubules (lotus tetragonolobus lectin [LTL]) and distal tubules (E-cadherin) in kidney organoids in vitro after treatment with tacrolimus. Scale bars: 50 μm. (B) Quantification of the percentage of LTL-positive cells (proximal tubules) and E-cadherin-positive cells (distal tubules) (n = 3). (C) CDH16 expression. The mRNA levels of CDH16 in the kidney organoids of the controls and tacrolimus models were determined by real-time polymerase chain reaction (n = 3). (D) Representative confocal fluorescence images showing proximal tubules (LTL) and distal tubules (E-cadherin) in the in vivo mouse model of tacrolimus nephrotoxicity. Scale bars: 50 μm. (E) Quantification of the percentage of LTL-positive cells (n = 3). (F) Quantification of the percentage of E-cadherin-positive cells (n = 3). Values are mean ± standard error of the mean. DAPI, 4,6-diamidino-2-phenylindole; ECAD, E-cadherin; CTR, control. ap < 0.05.
Figure 4.
Structural changes in proximal tubules of inducible pluripotent stem cell (iPSC)-derived kidney organoids and those of the mouse model of tacrolimus nephrotoxicity. (A) Representative confocal fluorescence images showing the polarity of the proximal tubules in kidney organoids in vitro after treatment with tacrolimus and the in vivo mouse model of tacrolimus nephrotoxicity. Scale bars: 20 μm. (B) Representative transmission electron microscopy images showing the vacuoles throughout the cytoplasm of the tubule-like structures in the kidney organoids after tacrolimus treatment. Scale bars: 2 μm. (C) Quantification of the diameter of the vacuoles (n = 3). (D) Representative confocal fluorescence images showing PCAM1 in kidney organoids in vitro. Scale bars: 50 μm. (E) The mRNA expression of PCAM1. The mRNA levels of PCAM1 in the kidney organoids of the controls and tacrolimus model were determined by real-time polymerase chain reaction (n = 3). Values are mean ± standard error of the mean. LTL, lotus tetragonolobus lectin; DAPI, 4,6-diamidino-2-phenylindole; CTR, control. ap < 0.05.
Isometric tubular vacuolization is one of the typical pathologic findings in tacrolimus nephrotoxicity [1]. Ultrastructural analysis showed evenly distributed small and clear vacuoles throughout the cytoplasm of the tubule-like structures in the kidney organoids after tacrolimus treatment (Fig. 4B). The size of the vacuoles increased in a dose-dependent manner (Fig. 4C).
Calcineurin inhibitors including tacrolimus can have a direct toxic effect on endothelial cells [1]. We examined the structural changes in endothelial cells in the iPSC-kidney organoids after tacrolimus treatment. Few PECAM1-positive vascular networks were observed after tacrolimus treatment (Fig. 4D). The mRNA expression of PECAM1 was also decreased in the kidney organoid model of tacrolimus nephrotoxicity (Fig. 4E).
Taken together, these findings suggest the capability of the iPSC-kidney organoids to recapitulate the structural changes in nephrons in tacrolimus nephrotoxicity.
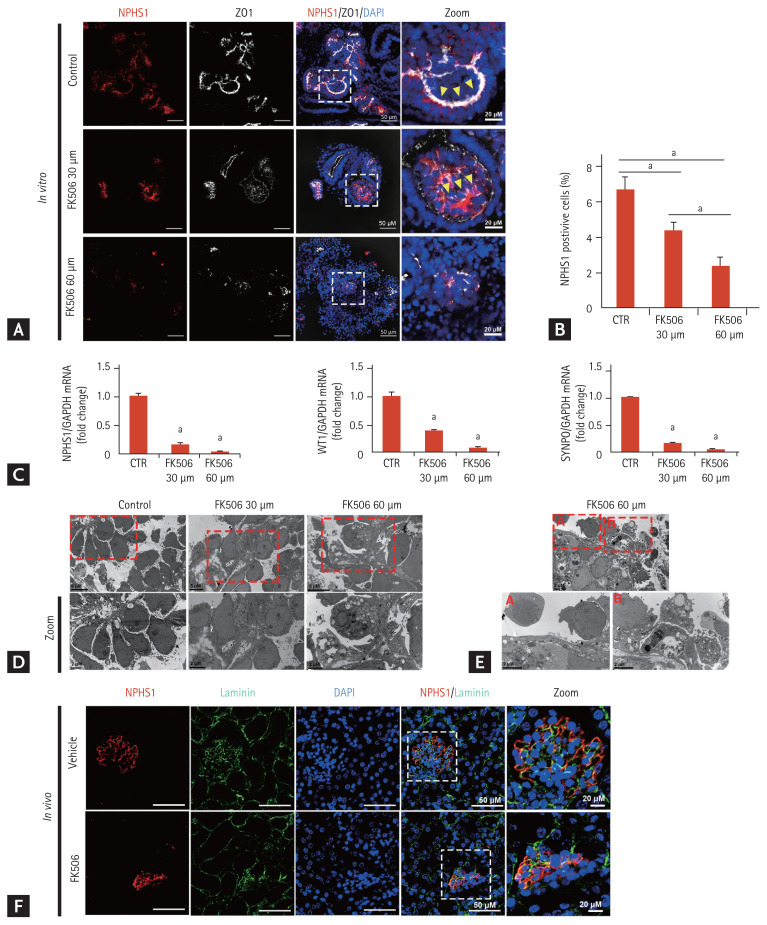
Tacrolimus nephrotoxicity results in focal segmental glomerulosclerosis [1]. We examined podocyte injury in the in vitro model. The expression of NPHS1 decreased in a dose-dependent manner (Fig. 5A and 5B). The linear pattern of the junctional marker ZO-1 tracks was reduced, and a more unpolarized pattern was seen after tacrolimus treatment (Fig. 5A). Transmission electron microscopy (TEM) examination showed that the podocytes in the controls were arranged along basement membrane-like tracks and separated from their neighboring podocytes, and numerous microvilli filled the spaces between the podocytes, which was a structure similar to that of human neonatal kidneys (Fig. 5C) [11]. After tacrolimus treatment, the podocytes were irregularly deformed with a disorganized arrangement along the basement membrane and spaces between the podocytes, and the number of microvilli decreased (Fig. 5C). Podocyte detachment and numerous autophagic vacuoles were observed after treatment with 60 μM tacrolimus (Fig. 5D and 5E).
Figure 5.
Podocyte injury after tacrolimus treatment. (A) Representative confocal fluorescence images showing podocyte (NPHS1) and junctional markers (ZO1) in kidney organoids in vitro. Scale bars: 50 μm, 20 μm. (B) Quantification of the percentage of podocyte (NPHS1)-positive cells (n = 3). Values are mean ± standard error of the mean. (C) Podocyte expression. The mRNA levels of NPHS1, WT1, and SYNPO in the kidney organoids of the controls and tacrolimus model were determined by real-time polymerase chain reaction (n = 3). (D, E) Representative transmission electron microscopy images showing the podocytes and microvilli filling the spaces between the podocytes. Scale bars: 5 μm, 2 μm. (F) NPHS1 and basement membrane markers (laminin) in the mouse model. Scale bars: 50 μm, 20 μm. DAPI, 4,6-diamidino-2-phenylindole; CTR, control. ap < 0.05.
We also examined the podocyte injury in the mouse model of tacrolimus nephrotoxicity. While NPHS1 lined the laminin, which consisted of a filtration barrier in the glomerulus in the vehicle group, NPHS1 was disrupted and partially dissociated from the laminin after tacrolimus treatment (Fig. 5F). These findings were similar to those in iPSC-kidney organoids after tacrolimus treatment.
Previous studies suggested that the focal segmental glomerulosclerosis induced by tacrolimus nephrotoxicity seemed to result from hyperfiltration in response to the loss of functional nephrons [1]. Our findings add the indication of podocyte injury induced by tacrolimus nephrotoxicity, which can be a direct effect of toxicity as well as hyperfiltration.
Accumulation of damaged mitochondria and increased oxidative stress in tacrolimus nephrotoxicity model
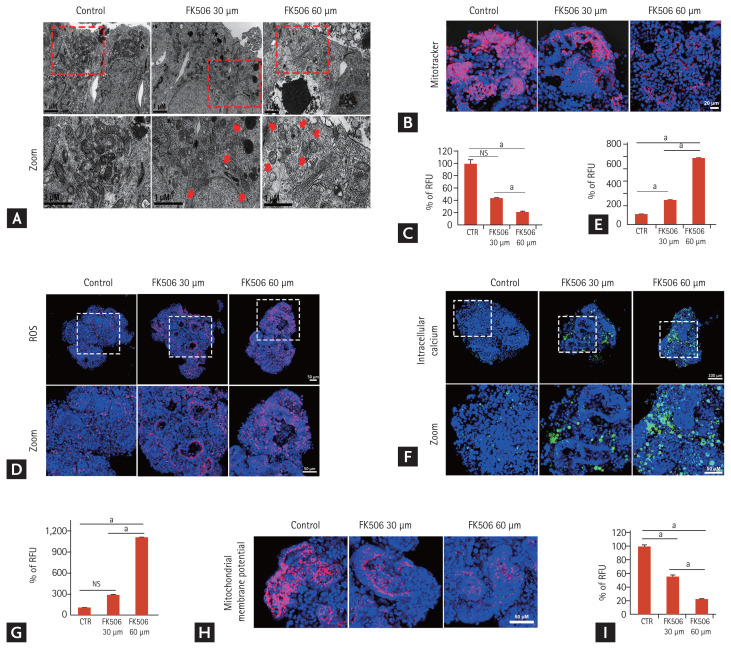
In tacrolimus nephrotoxicity, increased oxidative stress and reactive oxygen species (ROS) play important roles in its pathogenesis [19,20]. Thus, we examined the oxidative stress in the iPSC-derived kidney organoid model of tacrolimus nephrotoxicity. Mitochondria is the main source of ROS generation and mitochondrial DNA is a target of ROS [19–21]. TEM showed the accumulation of damaged mitochondria with spherical shapes and cristolysis was abundantly observed in the tacrolimus nephrotoxicity model (Fig. 6A). To investigate the drug-induced mitochondrial dysfunction, the kidney organoids were stained with Mitotracker. The intensity of staining decreased in a dose-dependent manner after tacrolimus treatment (Fig. 6B and 6C). We also examined superoxide in the mitochondria by staining with MitoSOX Red, which is oxidized by superoxide in the mitochondria, resulting in the emission of red fluorescence. Tacrolimus nephrotoxicity led to a significant increase in MitoSox fluorescence (Fig. 6D and 6E). These findings indicated an increase in mitochondrial oxidative stress in the tacrolimus nephrotoxicity model.
Figure 6.
Increase in damaged mitochondria and oxidative stress in the tacrolimus nephrotoxicity model in vitro. (A) Representative transmission electron microscopy images showing the damaged mitochondria in the tacrolimus nephrotoxicity model in vitro. Red arrow indicates the damaged mitochondria. Scale bars: 1 μm. (B) Representative confocal fluorescence images showing mitochondrial dysfunction by Mitotracker staining in vitro. Scale bars: 20 μm. (C) Quantification of mitochondria levels by analyzing the fluorescence intensity of Mitotracker (n = 3). (D) Representative confocal fluorescence images showing levels of ROS by staining with MitoSOX Red. Scale bars: 50 μm. (E) Quantification of ROS by analyzing the fluorescence intensity of MitoSOX Red (n = 3). (F) Representative confocal fluorescence images showing levels of intracellular calcium by staining with Fluo-8. Scale bars: 100 μm, 50 μm. (G) Quantification of intracellular calcium by analyzing the fluorescence intensity of Fluo-8 (n = 3). (H) Representative confocal fluorescence images showing levels of mitochondrial depolarization by staining with tetramethylrhodamine ethyl ester (TMRE). Scale bars: 50 μm. (I) Quantification of mitochondrial depolarization levels by analyzing the fluorescence intensity of TMRE (n = 3). Values are mean ± standard error of the mean. NS, no significance; RFU, relative fluorescence unit; ROS, reactive oxygen species; CTR, control. ap < 0.05.
Oxidative stress and ROS alter ion transporters, which leads to changes in a second messenger system, primary calcium homeostasis resulting in an increase in calcium influx into the cytoplasm [21]. We examined intracellular calcium by staining with the calcium-sensitive fluorescent dye, Fluo-8. The number of Fluo-8-positive cells increased after tacrolimus treatment in a dose-dependent manner (Fig. 6F and 6G).
Increased cytoplasmic calcium levels induce calcium influx into the mitochondria, which leads to dissipation of the mitochondrial membrane potential, and subsequently induces abnormal electrical activity and disturbs signal transduction, causing cellular apoptosis [22,23]. We examined the mitochondrial membrane potential by staining with a fluorescent dye, TMRE. Decreased intensity of the mitochondrial membrane potential was observed in the tacrolimus nephrotoxicity model (Fig. 6H and 6I). Taken together, these findings suggest that tacrolimus nephrotoxicity induced oxidative stress and mitochondrial dysfunction. Our data showed that the iPSC-derived kidney organoids were efficient for investigating the mechanisms of tacrolimus nephrotoxicity as well as modeling the structural nephrotoxicity of tacrolimus.
Autophagy was enhanced in tacrolimus nephrotoxicity and augmentation of autophagy by rapamycin treatment accelerated tacrolimus nephrotoxicity
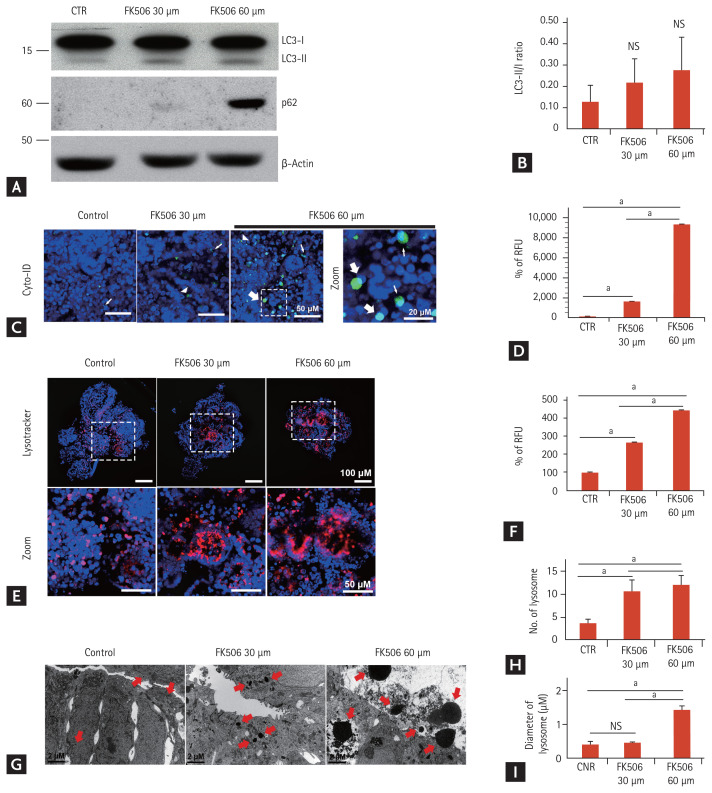
Autophagy is an evolutionarily conserved, lysosomal-mediated cellular degradation process of damaged organelles, protein aggregates, and other macromolecules in the cytoplasm and regulates cell death under normal physiological conditions as well as pathological conditions [24,25]. Oxidative stress in tacrolimus nephrotoxicity induces autophagy [20]. Thus, we analyzed the induction of autophagy in the tacrolimus nephrotoxicity model. Western blot analysis revealed that the light chain 3 (LC3)-II/LC3-I ratio, a classic autophagy marker, increased in a dose-dependent manner (Fig. 7A and 7B). p62/SQSTM1 is a ubiquitin-binding scaffold protein and a substrate for selective autophagy [26]. p62/SQSTM1 has a critical role in the oxidative stress response pathway [26]. The immunoblot assays revealed that the protein expression of p62/SQSTM1 was increased after tacrolimus treatment (Fig. 7A and 7B).
Figure 7.
Increase in autophagy in the tacrolimus nephrotoxicity model in vitro. (A, B) Representative Western blots and densitometry for the expression of light chain 3 (LC3) and p62 (n = 3). (C) Representative confocal fluorescence images showing autophagosome by staining with Cyto-ID. The large, white arrow indicates enlarged puncta, the small arrow indicates small puncta, and the arrowhead indicates large puncta. Scale bars: 50 μm, 20 μm. (D) Quantification of Cyto-ID Green fluorescence levels by analyzing the fluorescence intensity (n = 3). (E) Representative confocal fluorescence images showing lysosomal activity by staining with Lysotracker. Scale bars: 100 μm, 50 μm. (F) Quantification of lysosomal activity levels by analyzing the fluorescence intensity of Lysotacker (n = 3). (G) Representative transmission electron microscopy images showing the number and size of the lysosomes in the tacrolimus nephrotoxicity model in vitro. The red arrow indicates the lysosomes. Scale bars, 2 μm. (H) Quantification of the number of lysosomes (n = 3). (I) Quantification of the diameter of the lysosomes (n = 3). Values are mean ± standard error of the mean. NS, no significance; CTR, control; RFU, relative fluorescence unit. ap < 0.05.
Cyto-ID Green dye can be used for autophagosome detection in live cells [27]. Staining with Cyto-ID Green fluorescent dye revealed the increased accumulation of autophagosomes after tacrolimus treatment (Fig. 7C and 7D). Autophagosomes envelop damaged intracellular components and fuse with lysosomes to form autolysosomes, which degrade their contents to regenerate nutrients [28]. LysoTracker is valuable in detecting autophagy-associated lysosomal activity such as autolysosomes in live cells [29]. LysoTracker Red staining showed an increased extent and intensity of lysosomal activity in tacrolimus nephrotoxicity (Fig. 7E and 7F). TEM revealed that the number and size of the lysosomes in the kidney organoids increased after tacrolimus treatment (Fig. 7G–7I). Taken together, these data suggest the enhancement of autophagy upon oxidative stress in tacrolimus nephrotoxicity.
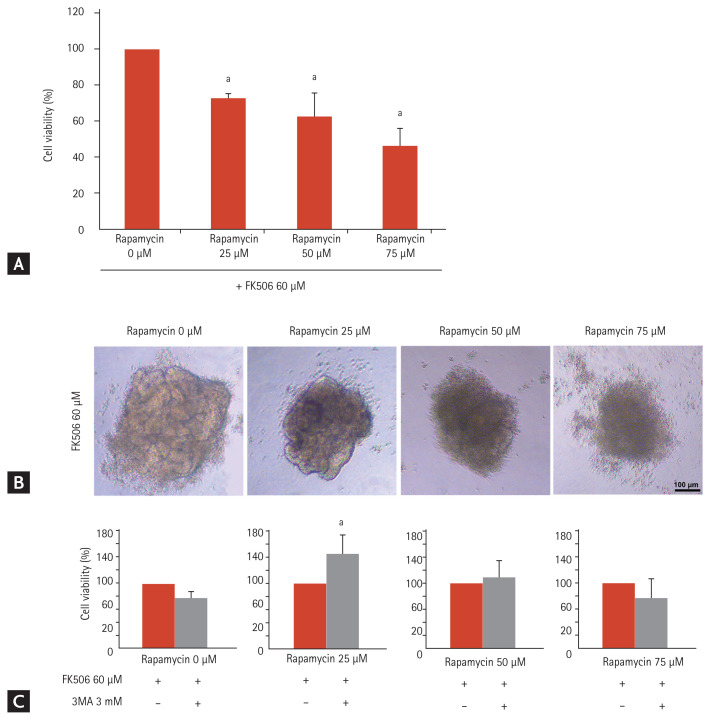
It remains unclear whether autophagy induction is protective or accelerates tacrolimus nephrotoxicity [3,19]. Rapamycin is a potent inducer of autophagy by negatively regulating the mTOR pathway [30]. To determine the role of autophagy in tacrolimus nephrotoxicity, we treated iPSC-derived kidney organoids with 60 μM tacrolimus and/or rapamycin at doses of 0, 25, 50, or 75 μM for 24 hours in vitro. Rapamycin treatment decreased cell viability in a dose-dependent manner as well as structural deformity of the kidney organoids (Fig. 8A and 8B). These findings indicate that the augmentation of autophagy by treatment with rapamycin in the tacrolimus nephrotoxicity model may accelerate nephrotoxicity.
Figure 8.
Increase in toxicity in the tacrolimus and rapamycin model in vitro. (A) Cell viability of the kidney organoids treated with 60 μM tacrolimus and rapamycin at doses of 25, 50, and 75 μM (n = 3). (B) Representative image of the morphology of tacrolimus and rapamycin-treated kidney organoids. Scale bars: 100 μm. (C) Cell viability with inhibition of autophagy by 3-methyladenine (3-MA) in kidney organoids treated with tacrolimus and/or rapamycin (n = 3). Values are mean ± standard error of the mean. ap < 0.05.
To examine the role of autophagy inhibition in this model, we treated the cells with 3-methyladenine, an autophagy inhibitor. Cell viability was recovered in the group treated with rapamycin at doses of 25 μM, but not in the groups treated with rapamycin at doses of 50 μM and 75 μM (Fig. 8C). These findings indicate that the regulation of autophagy can reduce tacrolimus nephrotoxicity when the cellular damage from excessive autophagy in tacrolimus nephrotoxicity is not severe.
DISCUSSION
In this study, we demonstrated that human iPSC-derived kidney organoids in vitro could recapitulate tacrolimus nephrotoxicity comparable to in vivo tacrolimus nephrotoxicity and were applicable to investigating its mechanisms. Our data suggest that kidney organoids represent a platform for nephrotoxicity testing as well as finding strategies to rescue patients from nephrotoxicity.
Currently, toxicity assays in pre-clinical nephrotoxicity testing have mainly focused on analyses of cell death or viability, although renal toxicity can also be manifested by the loss of renal cell polarity, the disruption of membrane integrity, and mitochondrial dysfunction, which may limit the accuracy of the in vitro nephrotoxicity test [31]. In this study, disruption of the polarity of the renal proximal tubules, unpolarized patterns between the podocytes and glomerular basement membrane, increased MitoSox fluorescence, increased calcium influx into the cytoplasm, and decreased intensity of the mitochondrial membrane potential were observed and measured in the tacrolimus nephrotoxicity in vitro model using human iPSC-derived kidney organoids. A recent survey reported that the majority of drug candidates displaying nephrotoxicity in clinical trials did not show nephrotoxicity in pre-clinical nephrotoxicity testing [31,32]. Recently, we reported that 3D cell bioprinting recapitulated perfusable complex renal tubular tissue with clinically relevant cellular heterogeneity [33]. Our data suggest that the 3D human iPSC-derived kidney organoid in vitro model may be an option as an advanced model for improving the prediction of nephrotoxicity.
Oxidative stress exerts a major toxic effect in calcineurin inhibitor-induced nephrotoxicity [2–4]. Therefore, it is important to demonstrate whether human kidney organoids, as an effective in vitro model of tacrolimus nephrotoxicity, can recapitulate oxidative stress. Our data provide evidence that they can (Fig. 6). Human kidney organoids were efficient for recapitulating oxidative stress as well as and its consequent phenomenon such as increased mitochondrial ROS, decreased mitochondrial membrane potential, and increased intracellular calcium after tacrolimus treatment.
In this study, we also showed the enhancement of autophagy in association with increased oxidative stress in tacrolimus nephrotoxicity in the human kidney organoid model. These findings are consistent with previous 2D in vitro and in vivo studies [3]. Autophagy is an evolutionarily conserved, lysosomal-mediated cellular process for degrading damaged organelles, protein aggregates, and other macromolecules in the cytoplasm [24]. Autophagy regulates cell death under normal physiological conditions as well as pathological conditions [24,25].
Autophagy is activated by the calcineurin inhibitor, cyclosporine A (CsA) by inducing endoplasmic reticulum stress and the oxidative stress pathway [3]. However, it remains unclear whether CsA-induced autophagy causes cell death or survival [3]. Some researchers have shown that CsA-induced autophagy may protect against CsA nephrotoxicity, while others suggest that it may promote CsA nephrotoxicity [3,34,35]. In this study, we focused on clinical studies on transplantation reporting that the combination of a calcineurin inhibitor with rapamycin as immunosuppressants resulted in severe nephrotoxicity [36]. From these clinical studies, we hypothesized that rapamycin, an autophagy activator, might accelerate tacrolimus nephrotoxicity and designed an in vitro experiment to investigate the role of autophagy in tacrolimus nephrotoxicity using human kidney organoids (Fig. 8). Our data demonstrated that the augmentation of autophagy by treatment with rapamycin accelerated cell death in the tacrolimus nephrotoxicity model. These findings highlight the role of autophagy in tacrolimus nephrotoxicity.
In conclusion, our data suggest that human iPSC-derived kidney organoids could recapitulate tacrolimus nephrotoxicity and were effective as an in vitro model to investigate its pathogenic pathway. To improve the efficacy of the kidney organoid in vitro model as a nephrotoxicity testing platform, challenges with large numbers of nephrotoxic or non-nephrotoxic drugs are needed. Autophagy plays an important role in regulating cell death in tacrolimus nephrotoxicity and may be a potential target for preventing tacrolimus nephrotoxicity.
KEY MESSAGE
1. Our data suggest that human kidney organoids are an effective in vitro model of tacrolimus nephrotoxicity.
2. Autophagy plays a critical role in tacrolimus nephrotoxicity.
Acknowledgments
This research was supported by Basic Science Research Program through the National Research Foundation of Korea (NRF) funded by the Ministry of Education, Science and Technology (NRF-2018R1A2B6003440, NRF-2019M3A9H2032546). This research was also supported by the Bio & Medical Technology Development Program of the National Research Foundation (NRF) funded by the Korean government (MSIT) (No. 2019M3A9H110376911).
Footnotes
Conflict of interest
No potential conflicts of interest relevant to this article were reported.
REFERENCES
- 1.Liptak P, Ivanyi B. Primer: histopathology of calcineurin-inhibitor toxicity in renal allografts. Nat Clin Pract Nephrol. 2006;2:398–404. doi: 10.1038/ncpneph0225. [DOI] [PubMed] [Google Scholar]
- 2.Yoon HE, Yang CW. Established and newly proposed mechanisms of chronic cyclosporine nephropathy. Korean J Intern Med. 2009;24:81–92. doi: 10.3904/kjim.2009.24.2.81. [DOI] [PMC free article] [PubMed] [Google Scholar]
- 3.Wu Q, Wang X, Nepovimova E, Wang Y, Yang H, Kuca K. Mechanism of cyclosporine A nephrotoxicity: oxidative stress, autophagy, and signalings. Food Chem Toxicol. 2018;118:889–907. doi: 10.1016/j.fct.2018.06.054. [DOI] [PubMed] [Google Scholar]
- 4.Kumar A, Hammad A, Sharma AK, Mc-Cardle F, Rustom R, Christmas SE. Oxidative stress in kidney transplant biopsies. Exp Clin Transplant. 2015;13(Suppl 1):207–213. [PubMed] [Google Scholar]
- 5.Freedman BS. Modeling kidney disease with iPS cells. Biomark Insights. 2015;10(Suppl 1):153–169. doi: 10.4137/BMI.S20054. [DOI] [PMC free article] [PubMed] [Google Scholar]
- 6.Wilmer MJ, Ng CP, Lanz HL, Vulto P, Suter-Dick L, Masereeuw R. Kidney-on-a-chip technology for drug-induced nephrotoxicity screening. Trends Biotechnol. 2016;34:156–170. doi: 10.1016/j.tibtech.2015.11.001. [DOI] [PubMed] [Google Scholar]
- 7.Cukierman E, Pankov R, Stevens DR, Yamada KM. Taking cell-matrix adhesions to the third dimension. Science. 2001;294:1708–1712. doi: 10.1126/science.1064829. [DOI] [PubMed] [Google Scholar]
- 8.Cukierman E, Pankov R, Yamada KM. Cell interactions with three-dimensional matrices. Curr Opin Cell Biol. 2002;14:633–639. doi: 10.1016/s0955-0674(02)00364-2. [DOI] [PubMed] [Google Scholar]
- 9.Astashkina AI, Mann BK, Prestwich GD, Grainger DW. A 3-D organoid kidney culture model engineered for high-throughput nephrotoxicity assays. Biomaterials. 2012;33:4700–4711. doi: 10.1016/j.biomaterials.2012.02.063. [DOI] [PubMed] [Google Scholar]
- 10.Freedman BS, Brooks CR, Lam AQ, et al. Modelling kidney disease with CRISPR-mutant kidney organoids derived from human pluripotent epiblast spheroids. Nat Commun. 2015;6:8715. doi: 10.1038/ncomms9715. [DOI] [PMC free article] [PubMed] [Google Scholar]
- 11.Kim YK, Refaeli I, Brooks CR, et al. Gene-edited human kidney organoids reveal mechanisms of disease in podocyte development. Stem Cells. 2017;35:2366–2378. doi: 10.1002/stem.2707. [DOI] [PMC free article] [PubMed] [Google Scholar]
- 12.Morizane R, Lam AQ, Freedman BS, Kishi S, Valerius MT, Bonventre JV. Nephron organoids derived from human pluripotent stem cells model kidney development and injury. Nat Biotechnol. 2015;33:1193–1200. doi: 10.1038/nbt.3392. [DOI] [PMC free article] [PubMed] [Google Scholar]
- 13.Taguchi A, Kaku Y, Ohmori T, et al. Redefining the in vivo origin of metanephric nephron progenitors enables generation of complex kidney structures from pluripotent stem cells. Cell Stem Cell. 2014;14:53–67. doi: 10.1016/j.stem.2013.11.010. [DOI] [PubMed] [Google Scholar]
- 14.Takasato M, Er PX, Chiu HS, Little MH. Generation of kidney organoids from human pluripotent stem cells. Nat Protoc. 2016;11:1681–1692. doi: 10.1038/nprot.2016.098. [DOI] [PMC free article] [PubMed] [Google Scholar]
- 15.Wu H, Uchimura K, Donnelly EL, Kirita Y, Morris SA, Humphreys BD. Comparative analysis and refinement of human PSC-derived kidney organoid differentiation with single-cell transcriptomics. Cell Stem Cell. 2018;23:869–881. doi: 10.1016/j.stem.2018.10.010. [DOI] [PMC free article] [PubMed] [Google Scholar]
- 16.Nam SA, Seo E, Kim JW, et al. Graft immaturity and safety concerns in transplanted human kidney organoids. Exp Mol Med. 2019;51:1–13. doi: 10.1038/s12276-019-0336-x. [DOI] [PMC free article] [PubMed] [Google Scholar]
- 17.Czerniecki SM, Cruz NM, Harder JL, et al. High-throughput screening enhances kidney organoid differentiation from human pluripotent stem cells and enables automated multidimensional phenotyping. Cell Stem Cell. 2018;22:929–940. doi: 10.1016/j.stem.2018.04.022. [DOI] [PMC free article] [PubMed] [Google Scholar]
- 18.Takasu C, Vaziri ND, Li S, et al. Treatment with dimethyl fumarate attenuates calcineurin inhibitor-induced nephrotoxicity. Transplantation. 2015;99:1144–1150. doi: 10.1097/TP.0000000000000647. [DOI] [PMC free article] [PubMed] [Google Scholar]
- 19.Yu JH, Lim SW, Luo K, et al. Coenzyme Q10 alleviates tacrolimus-induced mitochondrial dysfunction in kidney. FASEB J. 2019;33:12288–12298. doi: 10.1096/fj.201900386RR. [DOI] [PMC free article] [PubMed] [Google Scholar]
- 20.Lim SW, Shin YJ, Luo K, et al. Effect of Klotho on autophagy clearance in tacrolimus-induced renal injury. FASEB J. 2019;33:2694–2706. doi: 10.1096/fj.201800751R. [DOI] [PubMed] [Google Scholar]
- 21.Ott M, Gogvadze V, Orrenius S, Zhivotovsky B. Mitochondria, oxidative stress and cell death. Apoptosis. 2007;12:913–922. doi: 10.1007/s10495-007-0756-2. [DOI] [PubMed] [Google Scholar]
- 22.Hajnoczky G, Csordas G, Das S, et al. Mitochondrial calcium signalling and cell death: approaches for assessing the role of mitochondrial Ca2+ uptake in apoptosis. Cell Calcium. 2006;40:553–560. doi: 10.1016/j.ceca.2006.08.016. [DOI] [PMC free article] [PubMed] [Google Scholar]
- 23.Lin DS, Huang YW, Ho CS, et al. Oxidative insults and mitochondrial DNA mutation promote enhanced autophagy and mitophagy compromising cell viability in pluripotent cell model of mitochondrial disease. Cells. 2019;8:65. doi: 10.3390/cells8010065. [DOI] [PMC free article] [PubMed] [Google Scholar]
- 24.Klionsky DJ. Autophagy: from phenomenology to molecular understanding in less than a decade. Nat Rev Mol Cell Biol. 2007;8:931–937. doi: 10.1038/nrm2245. [DOI] [PubMed] [Google Scholar]
- 25.Levine B, Kroemer G. Autophagy in the pathogenesis of disease. Cell. 2008;132:27–42. doi: 10.1016/j.cell.2007.12.018. [DOI] [PMC free article] [PubMed] [Google Scholar]
- 26.Komatsu M, Kageyama S, Ichimura Y. p62/SQSTM1/A170: physiology and pathology. Pharmacol Res. 2012;66:457–462. doi: 10.1016/j.phrs.2012.07.004. [DOI] [PubMed] [Google Scholar]
- 27.Chan LL, Shen D, Wilkinson AR, et al. A novel image-based cytometry method for autophagy detection in living cells. Autophagy. 2012;8:1371–1382. doi: 10.4161/auto.21028. [DOI] [PMC free article] [PubMed] [Google Scholar]
- 28.Yu L, McPhee CK, Zheng L, et al. Termination of autophagy and reformation of lysosomes regulated by mTOR. Nature. 2010;465:942–946. doi: 10.1038/nature09076. [DOI] [PMC free article] [PubMed] [Google Scholar]
- 29.DeVorkin L, Gorski SM. LysoTracker staining to aid in monitoring autophagy in Drosophila. Cold Spring Harb Protoc. 2014;2014:951–958. doi: 10.1101/pdb.prot080325. [DOI] [PubMed] [Google Scholar]
- 30.Wu L, Feng Z, Cui S, et al. Rapamycin upregulates autophagy by inhibiting the mTOR-ULK1 pathway, resulting in reduced podocyte injury. PLoS One. 2013;8:e63799. doi: 10.1371/journal.pone.0063799. [DOI] [PMC free article] [PubMed] [Google Scholar]
- 31.Faria J, Ahmed S, Gerritsen KGF, Mihaila SM, Masereeuw R. Kidney-based in vitro models for drug-induced toxicity testing. Arch Toxicol. 2019;93:3397–3418. doi: 10.1007/s00204-019-02598-0. [DOI] [PubMed] [Google Scholar]
- 32.Troth SP, Simutis F, Friedman GS, Todd S, Sistare FD. Kidney safety assessment: current practices in drug development. Semin Nephrol. 2019;39:120–131. doi: 10.1016/j.semnephrol.2018.12.002. [DOI] [PubMed] [Google Scholar]
- 33.Singh NK, Han W, Nam SA, et al. Three-dimensional cell-printing of advanced renal tubular tissue analogue. Biomaterials. 2020;232:119734. doi: 10.1016/j.biomaterials.2019.119734. [DOI] [PubMed] [Google Scholar]
- 34.Pallet N, Bouvier N, Legendre C, et al. Autophagy protects renal tubular cells against cyclosporine toxicity. Autophagy. 2008;4:783–791. doi: 10.4161/auto.6477. [DOI] [PubMed] [Google Scholar]
- 35.Lim SW, Hyoung BJ, Piao SG, et al. Chronic cyclosporine nephropathy is characterized by excessive autophagosome formation and decreased autophagic clearance. Transplantation. 2012;94:218–225. doi: 10.1097/TP.0b013e31825ace5c. [DOI] [PubMed] [Google Scholar]
- 36.Gallon L, Perico N, Dimitrov BD, et al. Long-term renal allograft function on a tacrolimus-based, pred-free maintenance immunosuppression comparing sirolimus vs. MMF. Am J Transplant. 2006;6:1617–1623. doi: 10.1111/j.1600-6143.2006.01340.x. [DOI] [PubMed] [Google Scholar]


