

Abstract
REV1 is a DNA damage tolerance protein and encodes two ubiquitin-binding motifs (UBM1 and UBM2) that are essential for REV1 functions in cell survival under DNA-damaging stress. Here we report the first solution and X-ray crystal structures of REV1 UBM2 and its complex with ubiquitin, respectively. Furthermore, we have identified the first small-molecule compound, MLAF50, that directly binds to REV1 UBM2. In the HSQC NMR experiments, peaks of UBM2 but not of UBM1 are significantly shifted by addition of ubiquitin, which agrees to the observation that REV1 UBM2 but not UBM1 is required for DNA damage tolerance. REV1 UBM2 interacts with hydrophobic residues of ubiquitin such as L8 and L73. NMR data suggest that MLAF50 binds to the same residues of REV1 UBM2 that interact with ubiquitin, indicating that MLAF50 can compete with the REV1 UBM2-ubiquitin interaction orthosterically. Indeed, MLAF50 inhibited interaction of REV1 UBM2 with ubiquitin and prevented chromatin localization of REV1 induced by cisplatin in U2OS cells. Our results structurally validate REV1 UBM2 as a target of a small-molecule inhibitor and demonstrate a new avenue to targeting ubiquitination-mediated protein interactions with a chemical tool.
Keywords: protein NMR, crystallography, ubiquitin-binding motif, inhibitor, protein-protein interaction
GRAPHICAL ABSTRACT
INTRODUCTION
REV1 is a protein with proven tumor promotion and chemotherapy resistance functions. Rev1-knockout mice are healthy [1], but Rev1 transgenic mice are highly tumor-prone [2]. Depleting Rev1 in mouse lymphoma dramatically improves the efficacy of cisplatin and cyclophosphamide and suppresses the resistance and mutations induced by cyclophosphamide [3]. The role of REV1 in drug resistance has also been demonstrated in ovarian [4] and lung cancer [5] models. REV1 was originally identified as a deoxycytidyl transferase [6] that inserts exclusively dC, irrespective of what is on the template strand [7]. Later, many studies indicated that its major role is organizing components for DNA damage tolerance as a scaffold protein rather than inserting a dC. When a DNA replication fork is stalled on DNA damage, PCNA at the damaged strand is K164-monoubiquitinated (UbPCNA). REV1 interacts with UbPCNA via the ubiquitin-binding domain, which is composed of two ubiquitin-binding motifs (UBM1-UBM2) [8–11]. REV1 then recruits REV7-REV3L complex to the site of the DNA damage to allow translesion DNA synthesis (TLS) over a variety of DNA damage types [12–15]. UbPCNA activates TLS with yeast rev1 in vitro, but non-ubiquitinated PCNA cannot [9]. The rev1 UBM is required for the UbPCNA interaction and a point mutant in the UBM is defective for UbPCNA-mediated TLS [8]. Cells expressing a REV1 UBM mutant are hypersensitive to UV and cisplatin [11]. REV1 also recruits RAD18 on chromatin and promotes PCNA monoubiquitination: cells expressing a point mutant of REV1 UBMs are deficient in PCNA monoubiquitination [16]. Therefore, blocking the interactions of REV1 UBMs is a rational and promising approach to effectively and selectively inhibit REV1 functions coordinated by UbPCNA.
Human REV1 has two tandem UBMs (Figure 1), neither of which has been structurally characterized. The structure of the ubiquitin complex of the UBM of Polι, a TLS polymerase, has been previously characterized [17, 18]. The REV1 UBM2 point mutations derived from modeling based on the sequence homology between REV1 UBMs and Polι UBMs promote hypersensitivity to UV and suppress UV-mediated mutagenesis in yeast [19], indicating that the UBM2 is the primary site for the ubiquitinated protein interactions responsible for the REV1-mediated DNA damage tolerance. We have focused on determining the structures of free REV1 UBM2 and REV1 UBM2-ubiquitin complex. Following interest in targeting ubiquitin interaction domains [20], we have also identified the first small-molecule that inhibits REV1 UBM2-ubiquitin interaction.
Figure 1. Domain architecture of human REV1.

REV1 (NCBI reference#: NP_057400) contains a BRCT domain (red), a deoxycytidyl (dC) transferase (gray), UBM1 (yellow), and UBM2 (blue). The sequence of REV1 UBM1 (underlined) and UBM2 (bold) and locations of C958 and C977 (arrows) that were mutated for the NMR analysis are shown.
RESULTS
Ubiquitin interacts with REV1 UBM2 but not with UBM1
We produced a truncated REV1 (933–1040) protein containing the tandem UBM1-UBM2, but this protein was not stable enough to perform experiments over long period of time. We anticipated that the stability would be improved by mutating cysteine residues. REV1 (933–1040) contains two cysteines: one in UBM1 (C958) and one between UBM1 and UBM2 (C977), but none in UBM2 (Figure 1). To avoid potential structural changes caused by mutating C958 in UBM1, we chose a serine that is relatively neutral in structural preference [21]. An alanine was used to mutate C977. In the 2D [1H, 15N]-HSQC spectra, the resonances of wild-type (WT) and C958S C977A REV1 UBM1-UBM2 were very similar and the same resonances were perturbed by ubiquitin binding (Figure S1), indicating that the mutant is a reasonable surrogate for the biochemical and structural studies. To determine the binding affinity of REV1 UBM1-UBM2 (C958S C977A) to ubiquitin, isothermal titration calorimetry (ITC) was performed (Figure S2A and Table 1). The experimental data best fit to a single-site model assuming 1:1 stoichiometry for REV1 UBM1-UBM2 (C958S C977A) to ubiquitin with a dissociation constant (KD) of 18.7 ± 1.6 μM.
Table 1:
Thermodynamic parameters for binding of ubiquitin to REV1 UBM1-UBM2 and REV1 UBM2 obtained by ITC
| ΔGb | ΔHb | −TΔSb | |||
|---|---|---|---|---|---|
| Sample | Site (N)a | KD (μM)b | kcal/mol | ||
| REV1 UBM1-UBM2 (C958S C977A) | 0.8 ± 0.1 | 18.7 ± 1.6 | −6.45 ± 0.05 | −1.10 ± 0.13 | −5.34 ± 0.18 |
| REV1 UBM2 | 0.9 ± 0.1 | 14.9 ± 3.0 | −6.59 ± 0.12 | −1.17 ± 0.64 | −5.41 ± 0.52 |
Binding stoichiometry
KD is the dissociation constant. ΔG, ΔH and ΔS are the respective changes in Gibbs free energy, enthalpy, and entropy upon binding at T=298 K.
We next used NMR to examine the interactions between the REV1 UBM1-UBM2 (C958S C977A) and ubiquitin in detail. NH backbone resonances of free and ubiquitin-bound REV1 UBM1-UBM2 (C958S C977A) were assigned based on the three-dimensional HNCO, HNCA, CBCA(CO)NH, and HNCACB spectra (Figure S3). Chemical shift perturbations (CSPs) for ubiquitin bound to REV1 UBM1-UBM2 (C958S C977A) were measured by adding unlabeled ubiquitin to 15N-labeled REV1 UBM1-UBM2 (C958S C977A). Examining a series of 1H-15N correlation spectra of REV1 UBM1-UBM2 (C958S C977A) in the presence of different concentrations of ubiquitin, we observed progressive perturbations only at REV1 UBM2 but not UBM1 (Figure 2), suggesting that only UBM2 of REV1 binds to ubiquitin. Our results agree with those in Saccharomyces cerevisiae: ubiquitin binds to rev1 UBM2 but not to UBM1 [19].
Figure 2. UBM2, but not UBM1, is indispensable for the binding of ubiquitin to REV1 UBM1-UBM2.

(A) The 2D [1H, 15N]-HSQC spectra of REV1 UBM1-UBM2 (C958S C977A) with unlabeled ubiquitin at different molar ratios: 1:0 (black), 1:0.2 (green), 1:0.4 (cyan), 1:0.6 (magenta), 1:0.8 (orange), 1:1.2 (purple), 1:2 (dark green), and 1:4 (blue). Dashed arrows show the direction of perturbation. (B) Selected residues from [1H, 15N]-HSQC spectra of REV1 UBM1 (red)-UBM2 (blue) with unlabeled ubiquitin at different molar ratios as shown in panel A. (C) CSPs are plotted as a function of the residue number for REV1 UBM1-UBM2 (C958S C977A) at molar ratio 1:4. A schematic indicating each UBM1 and UBM2 is shown above each plot. CSPs greater than one standard deviation above the mean are marked by red dotted lines. Pro residues are indicated by (*).
CSP analysis of REV1 UBM1-UBM2 treated with ubiquitin shows that almost every peak in the UBM2 region is perturbed by ubiquitin (Figure 2C). A set of hydrophobic residues of UBM2 showed large CSP values, which includes I1008, L1009, L1010, V1016, A1023, L1032, A1035 and Y1036. In addition, several charged residues in UBM2 namely, Q1015, D1017, E1019 and E1031 exhibit large CSP value. Residues from UBM1 and the region connecting UBM1 and UBM2 did not show significant CSP. Hence, the data provide strong evidence that there is a disparity between UBM2 and UBM1 of REV1 towards the selectivity of ubiquitin and showed that UBM2 is essential for the ubiquitin-binding. In order to equitably address the fact that UBM2 is the functional ubiquitin-binding domain of human REV1, we used unlabeled REV1 UBM2 (residues E998 to Q1040) to study the association of REV1 UBM2 with ubiquitin by ITC (Figure S2B, Table 1). The experimental data best fit a single-site model (1:1 stoichiometry) for REV1 UBM2 to ubiquitin with a KD of 14.9 ± 3.0 μM, suggesting that REV1 binding to ubiquitin is contributed solely by UBM2.
Solution NMR structure of REV1 UBM2
Since UBM2 is essential in ubiquitin binding, we next sought to determine the solution structure of the 13C/15N double-labeled REV1 UBM2. Backbone assignment of REV1 UBM2 was based mainly on HNCA, HN(CO)CA, HNCACB, and CBCA(CO)NH experiments (Figure S5A and S5B). The Cα and Co chemical shift deviation plot showed that there are two helical elements in UBM2 (1018–1022, 1026–1037; Figure S5A and S5B). The side chain assignments were carried out using standard NMR methods and the distances for structure calculation were obtained from 3D 15N-, and 13C-resolved NOESY spectra. Though two helical regions were present based on the Cα and Co chemical shifts, all of the amide protons in the helical regions exhibited exchange cross peaks with water resonance in the 15N-resolved NOESY spectrum. Hence hydrogen bond restraints to stabilize helical regions could not be used in the structure calculation. However, helical NOEs were observed in this region, which enabled the folding of the two helical segments (Figure S5C). The presence of exchange cross peaks even for the ordered helical region of REV1 UBM2 (1018–1022, 1026–1037) suggests that the backbone of UBM2 may be in conformational exchange between folded and unfolded states. This is also supported by the observed lower heteronuclear NOE values (0.4, Figure 3C) in the helical regions. Since most of the residues before 1016 were unstructured and did not show any long range NOEs, we calculated the 3D structure of REV1 UBM2 for residues from 1008 to 1040. The restraints used in the structure calculation are given in Table 2. The final ensemble consisting of the 20 lowest-energy structures is well defined, for residues 1017–1038 with an RMSD of 0.31 Å for all backbone atoms and 0.72 Å for all the heavy atoms (Figure 3A, Table 2). The residues at the N-termini, 1008 to 1016 are only partially structured, and F1013 shows two different conformations for the backbone (Figure S6), as there are no long range NOEs in this region. Similarly, the last two residues did not show any long range NOEs and hence were excluded in the rmsd calculation (Table 2). UBM2 is well structured between residues P1018 and Q1038 (Figure 3A and B). The Ramachandran statistics for the structured region is mostly in the allowed region (Figure S5D). The structure of REV1 UBM2 consists of two amphipathic helices (α1 and α2) that are perpendicular to each other, with a long, extended N-terminal loop. α1 of UBM2 contains a single turn (V1020 to A1023), whereas the C-terminal α2 (A1026 to Q1038) is longer than α1. Both α1 and α2 are connected by a short loop containing two highly conserved residues L1024 and P1025. Indeed, L1024-L1028 region showed large CSP during ubiquitin titration (Figure 2C), suggesting that this region including P1025 is involved in the interaction with ubiquitin. The helices of UBM2 interact via aromatic residues F1013 from the N-terminal loop, F1021 of α1, and L1032, Y1036 of α2 that forms hydrophobic core (Figure 3B). In addition, we observed that the side chains E1027 and R1030 as well as Q1029 and K1033 are in such close proximity to form hydrogen bonds among themselves (Figure S6B). These interactions may contribute to the stability of α2.
Figure 3. Solution structure and dynamics of REV1 UBM2.

(A) Backbone traces of the NMR ensemble of 20 lowest energy structures. Helices are colored in blue. (B) Ribbon diagram of the lowest energy REV1 UBM2 structure. Core aromatic residues are shown in the stick model. (C) The steady-state heteronuclear 15N-1H-NOE values were plotted as a function of residue number for REV1 UBM2. The secondary structure elements in the REV1 UBM2 are indicated at the top. The heteronuclear NOE, with the average value of 0.25 displayed as a red dotted line. The longitudinal (R1; D) and transverse (R2; E) relaxation rates for residues in REV1 UBM2 are shown versus residue numbers. The error bars represent the errors in the curve fitting using mono exponential decay. All experiments were collected by using conventional pulse sequences at a temperature of 298 K at a spectrometer operating with a Larmor frequency of 600 MHz. Pro residues are indicated by (*).
Table 2:
Structural statistics of the 20 conformers of REV1 UBM21008−1040
| Parameter | REV1-UBM2 | REV1-UBM2+MLAF50 |
|---|---|---|
| No. of NOE distance restraints | ||
| Intraresidue | 155 | 155 |
| Sequential | 114 | 114 |
| Medium-range | 103 | 103 |
| Long-range | 32 | 31 |
| Total | 404 | 403 |
| Intermolecular distances | - | 18 |
| No. of Talos dihedral angle constraints | ||
| Φ | 32 | 32 |
| Ψ | 32 | 32 |
| Heavy atom | 0.72 ± 0.15 | 0.90 ± 0.20 |
| Residues in Ramachandran plot (%) b | ||
| Most-favorable regions | 97.3 | 95.5 |
| Additionally allowed regions | 2.8 | 4.5 |
To gain insights into the conformational dynamics of the REV1 UBM2 domain, we acquired and analyzed 15N backbone relaxation data: the longitudinal relaxation time T1, transverse relaxation time T2, and [1H]-[15N] steady-state NOE, which provide a measure of the rigidity of the protein backbone on the picosecond-nanosecond timescale [22, 23] (Figure 3C–E). [1H] - [15N] steady-state NOE values >0.6 indicate well-structured regions and can be qualitatively described as being rigid, values between 0.4–0.6 are qualitatively described as semi-rigid flexibility, and values <0.2 indicate completely unstructured regions. [1H]- [15N] steady-state NOE values for the residues in the two helices (E1019 to D1037) were between 0.4 to 0.6, indicative of semi-rigid flexibility (Figure 3C). Also a value less than 0.2 was observed for the N-terminal residues till L1010, indicating that this region is flexible, as no long range NOE’s were observed in this region. These data correlates well with the solution structure of REV1 UBM2 in which the two helices exhibit semi-rigidity and the region between the two helices is flexible. The residues in the N- and C-termini of the two helices showed [1H] - [15N] steady-state NOE values <0.2, indicating flexibility in these regions as evidenced by unstructured regions. An average R1 value of 1.8 s−1 and R2 of 6.7 s−1 were observed for REV1 UBM2 in the region that has the secondary structure. The rotational correlation time for REV1 UBM2 estimated from R2/R1 ratios for the semi-rigid part of the molecule is 3.8 ns, which is consistent with the value of a monomeric protein of similar size [24]. Residues around A1022 exhibited higher R2 rates than did the rest of the molecule, suggesting slower motion on a millisecond time scale in this region (Figure 3E). The observed slow motion in this region may be essential as UBM2 engages its binding partners through this region.
Crystal structure of REV1 UBM2 in complex with ubiquitin
To further investigate the molecular basis for REV1 UBM2 recognition by ubiquitin, we co-crystallized the protein complex. The 2.35 Å REV1 UBM2-ubiquitin structure was determined by molecular replacement using ubiquitin as the search model. A detailed crystallographic analysis of REV1 UBM2 binding to ubiquitin follows (Figure 4, Table 3), along with comparisons to previously reported Polι UBM2 complexes with ubiquitin [19]. The cubic crystals contain a 1:1 REV1 UBM2 to ubiquitin complex in the asymmetric unit. This 1:1 stoichiometry agrees to that measured by ITC (Figure S2). Superimposition of REV1 UBM2 from both our free and ubiquitin-bound structures reveals that the N-terminus of UBM2 forms an extended two turn alpha helix (α1’) upon binding to ubiquitin. Residues within α1’ and the adjacent loop establish significant interactions with ubiquitin. Specifically, α1’ largely engages the C-terminus of ubiquitin; I1005 is in van der Waals contact with mainchain atoms of residues R72, L73 and R74, and the side chain of N1006 makes a hydrogen bond to the amide nitrogen of R74. In addition, I1008 and A1009 both form hydrophobic interactions with L71 and L73, while I1008 also engages I36 of ubiquitin. Lastly, although the sidechain of D1002 could not be modeled due to insufficient density, this solvent exposed residue is in proximity to R74 of ubiquitin and may form a hydrogen bond in solution. In addition to α1’ residues, the loop connecting α1’ to α1 provides novel interactions with ubiquitin. These associations are centered on the critical β-hairpin residue L8 [17, 18] and augment the hydrophobic interactions mediated by UBM2 α1 in our structure and previously described for Polι UBM2-ubiquitin complex formation [19]. Loop residue L1010 packs well between L8 and L73 of the C-terminus, while P1011 makes hydrophobic interactions with L8 and T9 of ubiquitin.
Figure 4. Crystal structure of REV1 UBM2 bound to ubiquitin.

(A) Representative electron density for the REV1 UBM2-ubiquitin complex. A simulated annealing 2Fo-Fc composite omit map contoured at 1σ is shown. The protein-protein interface is depicted in cyan sticks for REV1 UBM2, and gray sticks for ubiquitin. (B) Superposition of the free and ubiquitin bound REV1 UBM2 structures. Free and ubiquitin bound REV1 UBM2 are colored in blue and light purple, respectivelyand Ubiquitin is in gray. (C) Interface between REV1 UBM2 and ubiquitin. REV1 UBM2 and ubiquitin are in blue and gray, respectively. Secondary structure elements of REV1 UBM2 are labeled. REV1 UBM2 residues, along with notable interacting residues of ubiquitin, are shown as blue and gray sticks, respectively. Black dotted lines indicate hydrogen bonds.
Table 3.
Data collectiona and refinement statistics
| REV1 UBM2/Ub | |
|---|---|
| Data Collection | |
| Space group | I432 |
| Cell dimensions | |
| a, b, c (Å) | 164.9 |
| α, β,γ (°) | 90.0 |
| Resolution (Å) | 2.35 (2.39–2.35)b |
| Rsym (%) | 10.6 (53.2) |
| Rmeas (%) | 11.4 (59.3) |
| Rpim (%) | 4.2 (25.5) |
| I/σ | 15.9 (2.2) |
| Completeness (%) | 99.1 (100.0) |
| Redundancy | 6.9 (5.0) |
| Refinement | |
| Resolution (A) | 30.0–2.35 |
| No. reflections | 16,000 |
| Rwork / Rfree (%) | 20.1/22.9 |
| No. atoms | |
| Protein | 1,476 |
| Ions | 4 |
| Water | 73 |
| B-factors | |
| Protein | 38.7 |
| Ions | 38.4 |
| Water | 40.2 |
| R.m.s. deviations | |
| Bond lengths(Å) | 0.006 |
| Bond angles (°) | 0.5 |
| Ramachandran Plot Statisticsc (%) | |
| Preferred regions | 98.4 |
| Allowed regions | 1.6 |
Dataset was collected from a single crystal.
Values in parenthesis are for the highest resolution shell
As defined by Molprobity
α1 hydrophobic residues of REV1 UBM2 bind ubiquitin similarly to structurally equivalent α1 residues of Polι UBM2, despite a ~2.5 Å translational shift of their respective helices relative to ubiquitin. V1020 and F1021 are in hydrophobic contact with L8, while V1020 is also in van der Waals contact with K6 and H68. A1023 makes van der Waals interactions with H68. As we observed in NMR CSP data (Figure 2C), loop residues L1024 and P1025 contribute to ubiquitin binding. Importantly, L1024 makes hydrophobic interactions with L8, I44, and V70 of ubiquitin. P1025 is in hydrophobic contact with I44 of ubiquitin. Additional hydrophobic interactions involve α2 residues; L1028 with I44 and V70 of ubiquitin, and L1032 with L8, V70, and L73 of ubiquitin. Lastly, A1035 and Y1036 from the C-terminal end of α2 make hydrophobic interactions with L73 and L8 of ubiquitin, respectively. Among the hydrophobic dominated common ubiquitin recognition motif, there are a few hydrogen bonds observed for the complex. Within α1 of REV1 UBM2, the backbone amide nitrogen of D1017 forms a hydrogen bond with the carbonyl oxygen of L8 of ubiquitin, and E1019 forms a hydrogen bond with K6. E1031 from α2 of UBM2 forms a hydrogen bond with R42 of ubiquitin.
Though several of these hydrophobic residues are conserved in REV1 UBM1 (Figure S7, highlighted in blue), there are residues which contribute to ubiquitin binding via charged interactions which are not conserved (Figure S7, highlighted in red). In the REV1 UBM2/Ubiquitin crystal structure, we observed that E1019 and E1031 makes hydrogen bond with K6 and R42 of ubiquitin, respectively (Figure 4B). In REV1 UBM1 these equivalent positions have S941 and Q953 respectively (Figure S7). In addition, we also observed that A1009 of UBM2 makes hydrophobic interaction with L71 and L73 of ubiquitin. REV1 UBM1 has E1031 at this position. Similarly, Y1036 of UBM2 makes hydrophobic interaction with critical β-hairpin residue L8 of ubiquitin. This position has C958 in REV1 UBM1. These interactions were also observed in the NMR studies, where we observed that E1019, E1031 and Y1036 exhibits chemical shift perturbation upon binding to ubiquitin (Figure 2C). Since there are several residues which are not conserved in the binding surface REV1 UBM1 binding to ubiquitin that involves electrostatic and hydrophobic interactions, supporting REV1 UBM1 binding weakly to ubiquitin. Another potential reason could be that REV1 UBM1 was observed to be unstructured in solution and hence the entropic penalty for REV1 UBM1 to fold and bind ubiquitin must be higher than that of UBM2, which is reflected in the very small CSP’s observed (Figure 2). All the biophysical data presented here, NMR CSPs, ITC and the crystal structure suggests that ubiquitin binding to REV1 UBM2 is very specific. Though REV1 UBM1 does not bind monoubiquitin, its binding to poly ubiquitin chains is possible and needs evaluation in the future.
The conformation of the N-terminus of REV1 UBM2 interacting to ubiquitin is a significant departure from that observed for the homologous portion of Polι UBM2-ubiquitin structures (Figure S8B–C). However, previous Polι structural studies used relatively short constructs (beginning with D674 equivalent to I1005 of REV1, Figure S8A), which could have prevented the helix formation and stabilization. On the other hand, the protein sequences are not well conserved in this region (Figure S8A). Therefore, the ability of an N-terminally extended UBM2 construct to form an alpha helix or bind similarly to ubiquitin in this region remains an open question. Y1036 from α2 of REV1 UBM2 appears to provide a structural scaffold to maintain both the overall REV1 UBM2 conformation observed and for interacting with the N-terminus of ubiquitin. This Y1036 mediated self-association includes hydrophobic interactions with L1010 and V1016 and a hydrogen bond between the hydroxyl moiety of Y1036 and the carbonyl oxygen of P1011. R1039 at the C-terminus may also provide conformational stability by forming intramolecular hydrogen bonds to the carbonyl oxygens of L1010 and P1011 within the α1’-α1 connection loop. Indeed, although R1039 does not make a direct contact to the ubiquitin, CSP value of R1039 in the REV1 UBM2-ubiquitin complex is comparable to that of L1032 (Figure 2C), indicative of an allosteric movement (Figure S9) driven by the hydrogen bonding.
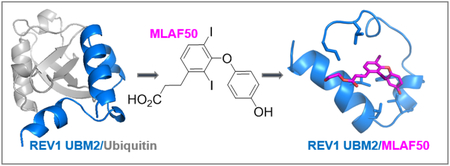
MLAF50, the first small-molecule that binds to REV1 UBM2 and inhibits REV1 UBM2-ubiquitin interaction
The shallow cavity of REV1 UBM2 binds to a hydrophobic patch of ubiquitin around L8 and V70 residues (Figure 4), which could be a potential site also for binding to a small-molecule. By performing water-ligand observed via gradient spectroscopy (WaterLOGSY) NMR screening [25] of several chemical compounds that we have produced in-house, we found a small-molecule named MLAF50 (Figure 5A) that showed positive NOE peaks with the REV1 UBM2 protein (Figure S10, red) but negative NOE peaks without the protein (Figure S10, black), indicative of the protein binding but not of a non-specific artifact formed by self-aggregation of the compound (Figure S10) [26]. We wanted to characterize the structural interaction of REV1 UBM2-MLAF50 as we have performed for the REV1 UBM2-ubiquitin complex. In 2D [1H, 15N]-HSQC spectra, several residues showed CSP in an MLAF50 dose-dependent manner (Figure 5B–D). Residues L1010, S1014, F1021, A1022, A1023, L1027, L1028, Y1036, N1038 and R1039 that were perturbed by ubiquitin (Figure 2C) were also perturbed by MLAF50 (Figure 5C–D), indicating that these residues are potential hotspots for REV1 UBM2 interactions. To further validate this, we solved the structure of REV1 UBM2 in complex with MLAF50. Since the crystallization trials of REV1 UBM2 in complex with MLAF50 were unsuccessful, we opted to use an NMR method that measures intermolecular NOEs between REV1 UBM2 and MLAF50 to probe the structure at 1:10 molar ratio (Table 2, Figure S11). The aliphatic carboxylate moiety of MLAF50 did not show any NOE to REV1 UBM2, suggesting that it is exposed to solvent. In contrast, hydrogens of MLAF50 in the aromatic ring moiety (Table S1) showed intermolecular NOEs to mostly the methyl and aromatic resonances of residues within the hydrophobic groove of REV1 UBM2 (including I1008, L1010, F1021, L1024, L1028 and L1032; Figure 6B–C, Figure S13B). Residues in this region also showed large CSP for the backbone amide resonances (Figure 5D). Though we could observe 18 intermolecular NOEs (Table 2) between MLAF50 and UBM2, most of these NOEs were very weak, due to the weak association of MLAF50 at the binding site. Hence the overall RMSD for the small molecule bound complex was lower than that of the apo UBM2 (Table 2, Figure S13A). The structure of UBM2 in the complex remained very similar to the apo form (rmsd of 0.786Å). The residues that showed intermolecular NOEs were also observed to be in direct contact with the hydrophobic residues of ubiquitin in the crystal structure (Figure 6C), suggesting MLAF50 and ubiquitin bind to the same region of REV1 UBM2. To further demonstrate that MLAF-050 and ubiquitin are targeting the same REV1 UBM2 regions, a displacement experiment was conducted. Upon addition of ubiquitin (1:4) to 15N-labeled REV1 UBM2, the [1H, 15N] HSQC spectrum undergoes several changes canonical for the REV1 UBM2-ubiquitin association (Figure S12). By further adding increasing amounts of the MLAF50 compound (1:10), few peaks within the spectrum of the REV1 UBM2-ubiquitin complex restore the characteristic position of the REV1 UBM2-MLAF50 complex form (Figure S12). However, despite the presence of a large excess of ubiquitin, displacement of MLAF50 is only partial (Figure S12). These results are likely due to the weaker binding affinity of MLAF-050 (KD =37 μM) to REV1 UBM2 compared to ubiquitin (KD = 14.9 μM).
Figure 5. MLAF50 binds to REV1 UBM2.

(A) Chemical structure of MLAF50. (B) Superposition of the 2D [1H,15N]-HSQC spectra of REV1 UBM2 with MLAF50 added at different molar ratios is shown in black (1:0), cyan (1:2), green (1:4), magenta (1:6), orange (1:8) and blue (1:10). Residues from UBM2 showing largest CSPs are labelled in blue. (C) Selected residues from [1H, 15N]-HSQC spectra of REV1 UBM2 with MLAF50 added at different molar ratios as shown in panel B. (D) Histogram outlining the magnitude of the average CSP of the 15N and 1H backbone amide resonances of REV1 UBM2 upon titration with MLAF50 at molar ratio 1:10. The secondary structure elements in the REV1 UBM2 are indicated at the top. CSPs greater than one standard deviation above the mean are marked by red dotted lines. Pro residues are indicated by (*).
Figure 6. Structure of REV1 UBM2 in complex with MLAF50.

(A) Ribbon diagram of the lowest-energy structure of the REV1 UBM2-MLAF50 complex. REV1 UBM2 is colored in blue. MLAF50 is shown in magenta. (B) Surface representation of REV1 UBM2 in complex with MLAF50 (sticks). The hydrophobic residues are shown in white; positively charged residues are in blue; and negatively charged residues are in red. (C) Superimposed structure of REV1 UBM2-Ubiquitin complex (silver) with REV1 UBM2-MLAF50 complex (blue cartoon and magenta sticks) showing that MLAF50 and Ubiquitin bind on the same surface of UBM2.
To measure the affinity of MLAF50 to REV1 UBM2, we used surface plasmon resonance (SPR) because ITC of REV1 UBM2 was too sensitive to the DMSO used to dissolve MLAF50. The sensorgram of REV1 UBM2 upon injection of MLAF50 reproducibly fits to a KD of 37 μM (Figure 7A, Table 4), only 2-fold weaker than that of ubiquitin (Table 1). For validating whether MLAF50 inhibits the REV1 UBM2-ubiquitin interaction, fluorescence polarization assay was unsuccessful because the affinity of the REV1 UBM2-ubiquitin interaction is too modest to observe polarization. Thus, we used the AlphaScreen proximity assay, which has been successfully used for assaying competitors of modest protein-protein interactions [27]. We produced N-terminus biotin-AviTag ubiquitin and titrated it with His-tag REV1 UBM2 to observe generation of AlphaScreen proximity signals. When the mixture was titrated with non-tagged ubiquitin, MLAF50, or DMSO, dose-dependent inhibition of the signal generation was observed by ubiquitin and MLAF50 but not by DMSO, indicative of self-competition by ubiquitin and on-site competition by MLAF50 (Figure 7B). Taken together, these observations suggest that MLAF50 can compete with the REV1 UBM2-ubiquitin interactions on-site (i.e., an orthosteric inhibitor of the interaction).
Figure 7. MLAF50 binds to REV1 UBM2 and inhibits the REV1 UBM2-ubquitin interaction.

(A) The SPR sensorgram trace of MLAF50 over REV1 UBM2 is shown as the merging of data from three experiments. (B) Inhibition of the REV1 UBM2-ubiquitin interaction by MLAF50 in an AlphaScreen competition assay. Non-tagged ubiquitin is a self-competition control. IC50 values in the curve fitting are 54 μM for ubiquitin and 176 μM for MLAF50.
Table 4.
Binding of MLAF50 to REV1 UBM2 as measured by surface plasmon resonance
Experimental errors were obtained from triplicate measurements.
MLAF50 inhibits chromatin localization of REV1 in cells after damaging DNA
Finally we validated whether MLAF50 inhibits the interaction of full-length REV1 and UbPCNA in cells. Previously, we have shown that a small-molecule that binds to and inhibits interactions of UbPCNA prevents chromatin localization of REV1 protein with PCNA foci in cells challenged with cisplatin (i.e., in situ generation of UbPCNA by DNA damage) [28], indicating inhibition of REV1-UbPCNA interaction by the UbPCNA-targeting small-molecule. We used the same method to examine REV1 UBM2-targeting MLAF50 to verify its potential to inhibit REV1-UbPCNA interaction on chromatin. Full-length EGFP-REV1 protein was expressed in U2OS cells, and the cells were pulse-treated with cisplatin followed by MLAF50. The chromatin was immunostained for PCNA foci to image them with the EGFP-REV1. The chromatin colocalization of the REV1 and PCNA was significantly suppressed by MLAF50 (Figure 8).
Figure 8. MLAF50 inhibits chromatin co-localization of REV1 with PCNA following DNA-damage induction.

(A) Chromatin co-foci of EGFP-full-length REV1/PCNA in U2OS cells that were treated with cisplatin (33 μM) followed by incubation with DMSO or MLAF50 (150 μM). Pre-extracted cells were immunostained for PCNA. Confocal images of representative cells are shown. (B) Colocalization of EGFP-REV1 and PCNA was determined by calculating Pearson’s correlation coefficients between red and green signals of all the pixels within a DAPI-positive area, N=38 (DMSO) and N=57 (MLAF50). The dots in the graph indicate the correlation coefficient of individual cells. Data were analyzed by performing Student’s t-test (two-tailed). The bars in the graph indicate averages.
DISCUSSION
Here, we demonstrate that UBM2 is the functional ubiquitin-binding domain in human REV1. The structures of free UBM2 and UBM2 bound to ubiquitin adopt a similar architecture for residues comprising helices α1 and α2. However, the N-terminal region of UBM2 is disordered in the absence of ubiquitin but becomes an ordered helix, termed α1’, upon ubiquitin complex formation. In addition, this N-terminal region folds back on itself in the complex structure, forming both intramolecular and intermolecular associations with the C-terminus of UBM2 and ubiquitin, respectively (Figure S9). It is tempting to speculate that binding of ubiquitin to α1 and α2 of UBM2 induces the N-terminal disordered polypeptide to adopt conformations that are competent for ubiquitin binding. NMR relaxation data of free UBM2 demonstrate that residues from α1 and α2 exhibit higher R2 rates than do the rest of the molecule, suggesting slower motion on the millisecond time scale and lack of disorder in this region (Figure 3E). This relatively ordered region may be essential for UBM2 engagement with ubiquitin and to promote the stable complex formation observed.
The distinguishable disparity between REV1 and Polι, the two translesion synthesis machineries, is that both UBMs are engaged with ubiquitin in Polι [17], whereas only UBM2 is associated with ubiquitin in REV1. Furthermore, structural comparison of REV1 UBM2-ubiquitin and Polι UBM2-ubiqutin complexes demonstrates that, in the REV1 UBM2-ubiquitin complex structure, the extended N-terminal region adopts an additional helix upon binding to ubiquitin (Figure S8). Residues from this extended helix (α1’) form an extensive hydrophobic and van der Waals interaction with the solvent-exposed C-terminal residues of ubiquitin that might be exploited for structure-based drug design.
We have identified MLAF50 irrespective of the REV1 UBM2-ubiquitin structure. Based on the large hydrophobic surface of REV1 UBM2 the small molecule interacts (Figure 6B), there is potential room to structurally optimize MLAF50 to generate more potent inhibitors of REV1 UBM2-ubiquitin interactions. Although ubiquitin and MLAF50 bind to similar region, the magnitude of CSP is smaller for MLAF50 (Figure 5D) compared to ubiquitin (Figure 2C); therefore, designing MLAF50 analogs that have CSPs more similar to that of ubiquitin seems like a rational approach to identifying potent inhibitors. However, REV1 UBM2-ubiquitin interaction affinity is not optimally high (Figure S2), so such MLAF50 analogs still may not be potent. The interactions of a ubiquitin interaction domain are generally weak or modest (typical KD of 10−5 M to 10−4 M), presumably because relatively high intracellular concentrations of ubiquitin proteins (that would match this KD range [29]) disable smooth regulation of the ubiquitinated protein interactions if the intrinsic affinity is too high. Therefore, to generate new small-molecules that potently inhibit the modest REV1 UBM2-ubiquitin interaction, it may be better to focus on the potential additional site that is unused by ubiquitin or MLAF50 in REV1, rather than the similarity of the binding mode with that of ubiquitin. Nowadays, so-called fragment-based drug design [30] is a common practice to target such potential allosteric sites in addition to the orthosteric binding site. To apply this strategy for REV1, UBM1 could be focused because ubiquitin binds to REV1 UBM2 with only modest affinity. Once a ‘fragment’ compound that directly binds to REV1 UBM1 is identified using the NMR-based approach, conjugates of MLAF50 with the REV1 UBM1-binding fragment compound will be generated. Such conjugate compounds will bind to both UBM1 and UBM2 concurrently; thus, its REV1 affinity may be higher than that of MLAF50.
Protein NMR allows the so-called ‘drugging an undruggable’ strategy, which has been successfully used to discover drugs having innovative mechanisms of action [31]. Still, only few studies have targeted ubiquitinated protein interactions by using a small-molecule to inhibit ubiquitinated protein pathways [32, 33]. An important role of protein ubiquitination is that the ubiquitinated moiety acts as a platform for a new interaction with the protein partner on ubiquitin-binding domains [20, 34–37]. The NMR-based strategy will be a potential approach to also target ubiquitin-binding domains other than REV1 UBM2.
MATERIALS AND METHODS
Reagents
MLAF50 was synthesized by using the method described in Supporting Information. All other chemicals were purchased from Sigma-Aldrich (St. Louis, MO) unless stated otherwise. All oligonucleotides for plasmid constructions were synthesized by Integrated DNA Technologies (Coralville, IA). The In-Fusion cloning kit (Takara Bio USA, Mountain View, CA) was used according to the manufacturers’ recommendations. The AlphaScreen assay kit was purchased from PerkinElmer (Waltham, MA). The anti-PCNA PC10 mouse IgG was purchased from Cell Signaling Technology (Danvers, MA). U2OS cells were obtained from American Type Culture Collection (Manassas, VA) and cultured in Dulbecco’s Modified Eagle Medium containing 10% FBS. All cells were maintained in an incubator at 37°C in a humidified atmosphere of 5% carbon dioxide.
Production of REV1 UBM1-UBM2 (C958S C977A) and UBM2 proteins
Generation of plasmids for bacterial expression of the human REV1 UBM1-UBM2 (residues 933–1040, wild-type and C958S C977A double mutant) and UBM2 (residues 998–1040) proteins are described in Supporting Information. The protein was expressed in E. coli BL21 (DE3) cells (Novagen). Cells were initially grown at 37°C and induced with 0.5 mM IPTG at 18°C overnight. Cells were taken up in a lysis buffer of 25 mM Tris, pH 8.0, 500 mM NaCl, and 10% glycerol. Affinity purification was initially done by Ni-NTA followed by cleavage of Histag by using the thrombin protease. A second purification was performed by size-exclusion chromatography using a HiPrep 16/60 Sephacryl S-200 HR prepacked column in 20 mM sodium phosphate, pH 7.0, and 100 mM NaCl. The 15N-labeled and 13C/15N-labeled samples were prepared by growing the cells in MOPS-buffered media containing 15NH4Cl (1 g/liter) and [13C6] glucose (3 g/L, for 13C/15N-labeled sample). The final protein buffer used for all structural studies was 20 mM sodium phosphate, pH 7.0, 100 mM NaCl.
Isothermal titration calorimetry (ITC)
ITC experiments were performed by using a MicroCal auto-iTC 200 (Malvern Instruments). Protein samples were exchanged into 20 mM sodium phosphate buffer, pH 7.0, and 100 mM NaCl prior to the experiment. Titrations were performed by first injecting 0.5 μL of 600 μM ubiquitin into a solution of 50 μM REV1 UBM1-UBM2 or REV1 UBM2 followed by additional 2 μL injections at 25°C. Results were analyzed by using Origin software (OriginLab) provided by MicroCal. Binding constants (KD) were calculated by using a nonlinear least-squares fitting algorithm to fit the data to a single-site binding model. All ITC experiments were performed in triplicate.
NMR titrations for interaction of ubiquitin with REV1 UBM1-UBM2 (C958S C977A) and with UBM2
A series of two-dimensional [1H, 15N]-HSQC spectra were collected on a Bruker 600 spectrometer at 298K. The REV1 UBM1-UBM2 (C958S C977A) concentration for the entire titration was 50 μM, and the procedure was performed in a 20 mM sodium phosphate buffer (pH 7.0) and 100 mM NaCl. Chemical shifts (Δ) of individual resonances from 15N-labeled REV1 UBM1-UBM2 were monitored as a function of increasing ubiquitin concentration. 15N and 1H chemical shift values for the displaced peaks were determined for each of the successive titration points by using CARA 1.8.4 [38]. To determine the per-residue chemical shift perturbation upon binding and account for differences in spectral widths between 15N and 1H resonances [39], weighted average chemical-shift perturbation CSP were calculated for the backbone amide 1H and 15N resonances by using the equation CSP(ppm) = [(ΔH2+ (ΔN/5)2)/2]1/2, where ΔH and ΔN are chemical-shift differences for 1H and 15N, respectively [40, 41]. Similarly, ubiquitin binding to REV1 UBM2 was measured by titrating ubiquitin to 15N-labelled REV1 UBM2.
NMR experiments for backbone and side chain assignment
All NMR experiments were collected using AVANCE-III 600 and/or 800 MHz spectrometers equipped with triple-resonance cryoprobes on 13C/15N- and 15N-labeled samples of REV1 UBM1-UBM2 (C958S C977A) and REV1 UBM2 in 20 mM sodium phosphate buffer, pH 7.0, 100 mM NaCl and molar concentrations of 50–500 μM at 298K. NMR spectra were then processed with Topspin 3.2 and analyzed by using CARA 1.8.4 [38]. 1H, 13C, and 15N backbone assignments were obtained based on HNCACB, CBCA(CO)NH, HNCA, and HN(CO)CA experiments. The side-chain 1H resonances of REV1 UBM2 were assigned by using 15N-resolved HSQC-TOCSY and 13C-resolved CCH-TOCSY. Aromatic side-chain proton resonance assignments were obtained with 2D [13C, 1H]-HSQC, and 3D 13C-resolved aromatic [1H, 1H]-NOESY experiments in 90% H2O and 10% D2O. Distance constraints for the REV1 UBM2 structure calculation were derived from 3D 13C-aliphatic, 13C-aromatic, and 15N-resolved [1H, 1H]-NOESY spectra recorded with a mixing time of 100 milliseconds.
NMR structure calculations for REV1 UBM2
REV1 UBM2 structures were calculated based on manually assigned NOEs by using the program CYANA [42, 43]. The NOEs were calibrated with constants that resulted in NH-NH distance of 3.0 to 3.2 Å for the helical regions in the 15N-resolved 3D NOESY and CH2 distance was used as the reference for 13C-resolved 3D NOESY spectra. The dihedral angle restraints were derived from CA and CB shifts (TALOS+) [44]. Two hundred initial structures were generated and the 20 structures with the lowest target function represents the NMR structure of REV1 UBM2. The lowest energy conformer was used as the representative structure for all other purposes. The structural statistics used in the structure calculation for the 20 REV1 UBM2 are given in Table 2.
NMR relaxation experiments
The 15N-R1, 15N-R2, and [1H]-[15 N]-NOE were measured by using standard Bruker pulse programs. Each 15N-R1 was measured with delays of 20, 50, 100, 200, 300, 500, 800, 1000, 1500, 2000, 2500, 3000, 3500, 4000, 4500, and 5000 milliseconds, with an interscan delay of 5 s. Similarly, each 15N-R2 was measured with delays of 10, 20, 30, 40, 50, 60, 70, 80, 90, and 100 milliseconds, with an interscan delay of 5 s. The steady state [1H]-[15N]-NOE experiment was carried out in an interleaved manner, with and without proton saturation, with a saturation time of 3 s and interscan delay of 3 s. Both the rate constants and [1H]-[15N]-NOE analyses were carried out using the program Protein Dynamics Center (Bruker, Germany).
Crystallization, data collection, and structure determination
REV1 UBM2-ubiquitin was co-crystallized by sitting drop vapor diffusion at 18°C. The sample contained 0.75 mM REV1 UBM2 and 3 mM ubiquitin in 20 mM sodium phosphate buffer, pH 7.0, and 100 mM NaCl. Specifically, a 400-nL drop consisting of 200 nL of protein sample and 200 nL of reservoir solution was placed over 90 μL of reservoir solution containing 0.1 M MES, pH 6.0, and 10% PEG 8000. Cubic crystals appeared after about 10 days. Crystals were cryoprotected in 30% glycerol (v/v) / 70% reservoir solution (v/v) prior to flash-cooling in liquid nitrogen. Data were collected at the Advanced Photon Source (APS) Southeast Regional Collaborative Access Team (SER-CAT) Insertion Device 22-ID beamline. The data were integrated and scaled with HKL2000 [45] to 2.35 Å. The structure was determined by Molecular Replacement using Phaser [46]. Ubiquitin with pdb code 4S1Z served as the molecular replacement model. Strong positive electron density was observed in the initial maps corresponding to one REV1 UBM2. After building REV1 UBM2 into the omit density by using COOT [47], the structure was refined by using Phenix [48]. The final model is of high quality, with good geometry according to Molprobity [49]. Structural figures were generated by using PyMOL 1.8 (Schrödinger, LLC). Data collection and refinement statistics are in Table 3.
WaterLOGSY NMR experiments
All experiments were performed at 298K by using a Bruker Avance 600-MHz spectrometer equipped with a TCI cryogenic gradient probe. Each compound was dissolved in DMSO-d6 at a concentration of 10 mM, and 10 μL was added to a solution containing 20 mM sodium phosphate, pH 7.4, 100 mM NaCl, 10% D2O, or the same buffer containing the REV1 UBM1-UBM2 (C958S C977A) protein (10 μM) to yield a final concentration of 200 μM. One-dimensional (1D) 1H-WaterLOGSY NMR spectra (mixing time of 1.2 sec) were recorded in the presence or absence of the protein.
NMR titrations for interaction of MLAF50 to REV1 UBM2
The binding of MLAF50 to REV1 UBM2 was queried by two dimensional [1H, 15N]-HSQC titrations. Chemical shifts (Δ) of individual resonances from 15N-labeled REV1 UBM2 was monitored as a function of increasing MLAF50 concentration. REV1 UBM2 concentrations for the titration were between 50–60 μM, and were performed in a 20 mM sodium phosphate buffer (pH 7.0) with 100 mM NaCl. NMR spectra were then processed with Topspin 3.2 and analyzed using CARA 1.8.4 [38].
NMR structure calculations for REV1 UBM2-MLAF50 complex
Resonances of the MLAF50-bound to REV1 UBM2 were assigned through the analysis of 2D [13C, 15N]-filtered TOCSY and NOESY spectra (Table S1) and intermolecular NOEs between REV1 UBM2 and MLAF50 was measured using 3D half-filtered, 13C-aliphatic, [1H, 1H]-NOESY experiment with the mixing time of 150 ms. The NOEs of REV1 UBM2 were not strong enough to that of apo (Figure S16A), hence we used apo NOEs along with the intermolecular NOE to define the docking pose of MLAF50. The restraints that were used to fold free REV1 UBM2 along with the intermolecular NOEs restraints in the structure calculation of the REV1 UBM2-MLAF50 complex are given in Table 2 and Figure S11. The coordinates of MLAF50 were created after the structure was first created using ChemBio3D Ultra 14.0 software and energy minimized using Avagadro and then incorporated into the CYANA library. The structure of MLAF50 bound REV1 UBM2 complex was calculated using the program CYANA [42] using residues 1008–1040 of REV1 UBM2. Two hundred structures were generated initially and the 20 structures with the lowest energy were used to represent the structure of the complex (Figure S13A). The lowest energy conformer is used as the representative structure of the REV1 UBM2-MLAF50 complex.
Surface plasmon resonance (SPR)
The kinetics of MLAF50 interaction with REV1 UBM2 was determined by using a Pioneer FE (Pall Forte Bio, Fremont, CA) with an Ni-NTA sensor. The running buffer used was 50 mM HEPES, pH 8.0, 200 mM NaCl, 0.01% Triton X-100 and 2 % DMSO (v/v). The N-terminal His8-REV1 UBM2 was immobilized by using the histidine capture method and conditioning the surface with 0.5 M EDTA, followed by surface activation using 5 mM NiCl2. The REV1 UBM2 was immobilized to surface density of 2000 RU at flow rate of 10 μL/min. The baseline from UBM2 immobilization was allowed to stabilize for 4 hours. The reference surface was conditioned with EDTA but not activated and kept blank. The kinetic data were collected (sampling rate 20 Hz) in triplicate by using a Taylor dispersion based one-step dynamic injection method (top MLAF50 concentration 100 μM, flow rate 150 μL/min, dissociation time 200 s) [50] at 25°C. During one-step injection method the sample dilution is performed automatically by the instrument to create a concentration gradient of the analyte which in turn is injected over both reference and sensor surface simultaneously and increasing binding response is measured. The raw response data was double-referenced and fitted with 1:1 simple kinetics model isotherm and binding affinity was determined.
AlphaScreen assays
Production of biotin-AviTag-ubiquitin is described in Supporting Information. The AlphaScreen assay was conducted in a solution consisting of 200 nM biotin-AviTag-ubiquitin protein and 80 nM N-terminal His-tagged UBM2 in the AlphaScreen buffer (1 × PBS, pH 7.4, 0.1% BSA, and 0.05% Tween-20). Briefly, 5 μL of the assay solution containing the indicated serial dilution of non-tagged ubiquitin, MLAF50, or DMSO was transferred into each well of a white OptiPlate-384 (PerkinElmer, Waltham, MA). AlphaScreen nickel chelate acceptor beads (PerkinElmer) diluted 1:100 in 10 μL of the AlphaScreen buffer were added. After 1 h, streptavidin AlphaScreen donor beads (PerkinElmer) diluted 1:100 in 10 μL of the AlphaScreen buffer were added. The AlphaScreen signal was read an hour later by using an EnVision plate reader (PerkinElmer). The dose-response curve was fitted by using Prism 7 (GraphPad Software, La Jolla, CA) for final concentration of each serial dilution.
Chromatin co-localization studies
U2OS cells (4 × 10⁵/well) were initially seeded onto coverslips in 6-well cluster plates and allowed to attach overnight. Each sample was transfected with pEGFP-REV1 (2.5 μg) by using Lipofectamine 2000 (7.5 μL) according to the manufacturer’s instructions. Two days after transfection, cells were treated with 0 or 33 μM cisplatin for 4 h prior to release into media containing either DMSO vehicle or 150 μM MLAF50 for 6 h. Samples were then pre-extracted with ice-cold CSK buffer (100 mM NaCl, 300 mM sucrose, 10 mM HEPES pH 7.4, 3 mM MgCl2, 1 × Halt Protease Inhibitor Cocktail [Thermo Fisher Scientific], 0.5% Triton X-100) for 2 min to remove non–chromatin-bound protein and then fixed with 4% paraformaldehyde for 10 min at ambient temperature. Cells were exposed to 100% methanol for 15 min at −20°C prior to blocking in 3% FBS in PBS overnight at 4°C. The cells were then immunostained by probing with 1/2000 mouse α PCNA monoclonal antibody (PC10, Cell Signaling Technology) for 60 min followed by incubation with 1/200 donkey α mouse IgG Alexa 555 (Thermo Fisher Scientific) for another 30 min. Cells were then washed extensively with PBS and mounted onto glass slides by using VectaShield containing 1 μg/mL DAPI. Immunostained cells were subsequently examined, and images were captured on a TE2000 microscope equipped with a C1Si confocal lens (Nikon, Tokyo, Japan). Nikon NIS-elements software (Nikon, Tokyo, Japan) was used to calculate the Pearson’s correlation coefficient of red (PCNA) and green (REV1) fluorescence signals for each nucleus, using DAPI staining to define the perimeter of each nuclei. Data were analyzed by performing Student’s t-test (two-tailed) by using Prism 7 (GraphPad).
Supplementary Material
HIGHLIGHTS.
The ubiquitin-binding motif 2 (UBM2) of REV1 is essential for the REV1 functions.
The structures of REV1 UBM2 in the free or ubiquitin-bound forms are identified.
A small-molecule that binds to the UBM2 inhibits the REV1 chromatin localization.
This study demonstrates a new structural understanding for REV1 functions.
ACKNOWLEDGEMENTS
We thank the Sanger DNA Sequencing Core for plasmid sequencing, Christine Canman for providing the EGFPREV1 plasmid [15], Hans Haecker for providing the pBirA plasmid, Weixing Zhang for assistance with the NMR, Jennifer Peters for assistance with microscopic foci quantification, Richard Lee for the use of SPR equipment and consumables, and Cherise Guess for editing the manuscript. The study was funded by ALSAC. The Cell & Tissue Imaging Center is supported by NCI P30 CA021765–34.
ABBREVATIONS
- PCNA
proliferating cell nuclear antigen
- UbPCNA
lysine 164-monoubiquitinated proliferating cell nuclear antigen
- UBM
ubiquitin-binding motif
- TLS
translesion DNA synthesis
- ITC
isothermal titration calorimetry
- HSQC
heteronuclear single quantum coherence
- NOE
nuclear Overhauser enhancement
- CSP
chemical shift perturbation
- CARA
computer aided resonance assignment
- SER-CAT
Southeast Regional Collaborative Access Team
Footnotes
Publisher's Disclaimer: This is a PDF file of an unedited manuscript that has been accepted for publication. As a service to our customers we are providing this early version of the manuscript. The manuscript will undergo copyediting, typesetting, and review of the resulting proof before it is published in its final citable form. Please note that during the production process errors may be discovered which could affect the content, and all legal disclaimers that apply to the journal pertain.
ACCESSION NUMBERS
The accession numbers reported in this paper include: solution structure of free REV1 UBM2, PDB: 6AXD; crystal structure of REV1 UBM2-ubiqution complex, PDB: 6ASR; and NMR assignments related to the REV1 UBM2, BMRB: 30340.
Conflict of financial interests
BJE is currently an employee of Noxopharm Ltd. The authors declare no other conflict of interest.
Contact for reagent and resource sharing
Requests should be directed to Murugendra Vanarotti, murugendra.vanarotti@stjude.org or Naoaki Fujii, naoaki.fujii@gmail.com, MS1000, 262 Danny Thomas Pl, Memphis, TN38105, USA.
REFERENCES
- [1].Jansen JG, Langerak P, Tsaalbi-Shtylik A, van den Berk P, Jacobs H, de Wind N. Strand-biased defect in C/G transversions in hypermutating immunoglobulin genes in Rev1-deficient mice. The Journal of experimental medicine. 2006;203:319–23. [DOI] [PMC free article] [PubMed] [Google Scholar]
- [2].Sasatani M, Xi Y, Kajimura J, Kawamura T, Piao J, Masuda Y, et al. Overexpression of Rev1 promotes the development of carcinogen-induced intestinal adenomas via accumulation of point mutation and suppression of apoptosis proportionally to the Rev1 expression level. Carcinogenesis. 2017;38:570–8. [DOI] [PMC free article] [PubMed] [Google Scholar]
- [3].Xie K, Doles J, Hemann MT, Walker GC. Error-prone translesion synthesis mediates acquired chemoresistance. Proceedings of the National Academy of Sciences of the United States of America. 2010;107:20792–7. [DOI] [PMC free article] [PubMed] [Google Scholar]
- [4].Lin X, Okuda T, Trang J, Howell SB. Human REV1 modulates the cytotoxicity and mutagenicity of cisplatin in human ovarian carcinoma cells. Molecular pharmacology. 2006;69:1748–54. [DOI] [PubMed] [Google Scholar]
- [5].Dumstorf CA, Mukhopadhyay S, Krishnan E, Haribabu B, McGregor WG. REV1 is implicated in the development of carcinogen-induced lung cancer. Molecular cancer research : MCR. 2009;7:247–54. [DOI] [PMC free article] [PubMed] [Google Scholar]
- [6].Nelson JR, Lawrence CW, Hinkle DC. Deoxycytidyl transferase activity of yeast REV1 protein. Nature. 1996;382:729–31. [DOI] [PubMed] [Google Scholar]
- [7].Zhou Y, Wang J, Zhang Y, Wang Z. The catalytic function of the Rev1 dCMP transferase is required in a lesion-specific manner for translesion synthesis and base damage-induced mutagenesis. Nucleic acids research. 2010;38:5036–46. [DOI] [PMC free article] [PubMed] [Google Scholar]
- [8].Wood A, Garg P, Burgers PM. A ubiquitin-binding motif in the translesion DNA polymerase Rev1 mediates its essential functional interaction with ubiquitinated proliferating cell nuclear antigen in response to DNA damage. The Journal of biological chemistry. 2007;282:20256–63. [DOI] [PubMed] [Google Scholar]
- [9].Garg P, Burgers PM. Ubiquitinated proliferating cell nuclear antigen activates translesion DNA polymerases eta and REV1. Proceedings of the National Academy of Sciences of the United States of America. 2005;102:18361–6. [DOI] [PMC free article] [PubMed] [Google Scholar]
- [10].Edmunds CE, Simpson LJ, Sale JE. PCNA ubiquitination and REV1 define temporally distinct mechanisms for controlling translesion synthesis in the avian cell line DT40. Molecular cell. 2008;30:519–29. [DOI] [PubMed] [Google Scholar]
- [11].Guo C, Tang TS, Bienko M, Parker JL, Bielen AB, Sonoda E, et al. Ubiquitin-binding motifs in REV1 protein are required for its role in the tolerance of DNA damage. Molecular and cellular biology. 2006;26:8892–900. [DOI] [PMC free article] [PubMed] [Google Scholar]
- [12].Ho TV, Scharer OD. Translesion DNA synthesis polymerases in DNA interstrand crosslink repair. Environmental and molecular mutagenesis. 2010;51:552–66. [DOI] [PubMed] [Google Scholar]
- [13].Sharma S, Canman CE. REV1 and DNA polymerase zeta in DNA interstrand crosslink repair. Environmental and molecular mutagenesis. 2012;53:725–40. [DOI] [PMC free article] [PubMed] [Google Scholar]
- [14].Budzowska M, Graham TG, Sobeck A, Waga S, Walter JC. Regulation of the Rev1-pol zeta complex during bypass of a DNA interstrand cross-link. The EMBO journal. 2015;34:1971–85. [DOI] [PMC free article] [PubMed] [Google Scholar]
- [15].Hicks JK, Chute CL, Paulsen MT, Ragland RL, Howlett NG, Gueranger Q, et al. Differential roles for DNA polymerases eta, zeta, and REV1 in lesion bypass of intrastrand versus interstrand DNA cross-links. Molecular and cellular biology. 2010;30:1217–30. [DOI] [PMC free article] [PubMed] [Google Scholar]
- [16].Wang Z, Huang M, Ma X, Li H, Tang T, Guo C. REV1 promotes PCNA monoubiquitylation through interacting with ubiquitylated RAD18. Journal of cell science. 2016;129:1223–33. [DOI] [PubMed] [Google Scholar]
- [17].Burschowsky D, Rudolf F, Rabut G, Herrmann T, Peter M, Wider G. Structural analysis of the conserved ubiquitin-binding motifs (UBMs) of the translesion polymerase iota in complex with ubiquitin. The Journal of biological chemistry. 2011;286:1364–73. [DOI] [PMC free article] [PubMed] [Google Scholar]
- [18].Cui G, Benirschke RC, Tuan HF, Juranic N, Macura S, Botuyan MV, et al. Structural basis of ubiquitin recognition by translesion synthesis DNA polymerase iota. Biochemistry. 2010;49:10198–207. [DOI] [PMC free article] [PubMed] [Google Scholar]
- [19].Bomar MG, D’Souza S, Bienko M, Dikic I, Walker GC, Zhou P. Unconventional ubiquitin recognition by the ubiquitin-binding motif within the Y family DNA polymerases iota and Rev1. Molecular cell. 2010;37:408–17. [DOI] [PMC free article] [PubMed] [Google Scholar]
- [20].Dikic I, Wakatsuki S, Walters KJ. Ubiquitin-binding domains - from structures to functions. Nature reviews Molecular cell biology. 2009;10:659–71. [DOI] [PMC free article] [PubMed] [Google Scholar]
- [21].Pace CN, Scholtz JM. A helix propensity scale based on experimental studies of peptides and proteins. Biophysical journal. 1998;75:422–7. [DOI] [PMC free article] [PubMed] [Google Scholar]
- [22].Fushman D, Cahill S, Cowburn D. The main-chain dynamics of the dynamin pleckstrin homology (PH) domain in solution: analysis of 15N relaxation with monomer/dimer equilibration. J Mol Biol. 1997;266:173–94. [DOI] [PubMed] [Google Scholar]
- [23].Farrow NA, Muhandiram R, Singer AU, Pascal SM, Kay CM, Gish G, et al. Backbone dynamics of a free and phosphopeptide-complexed Src homology 2 domain studied by 15N NMR relaxation. Biochemistry. 1994;33:5984–6003. [DOI] [PubMed] [Google Scholar]
- [24].Fushman D Determining protein dynamics from (1)(5)N relaxation data by using DYNAMICS. Methods Mol Biol. 2012;831:485–511. [DOI] [PMC free article] [PubMed] [Google Scholar]
- [25].Dalvit C, Fogliatto G, Stewart A, Veronesi M, Stockman B. WaterLOGSY as a method for primary NMR screening: practical aspects and range of applicability. Journal of biomolecular NMR. 2001;21:349–59. [DOI] [PubMed] [Google Scholar]
- [26].LaPlante SR, Aubry N, Bolger G, Bonneau P, Carson R, Coulombe R, et al. Monitoring drug self-aggregation and potential for promiscuity in off-target in vitro pharmacology screens by a practical NMR strategy. Journal of medicinal chemistry. 2013;56:7073–83. [DOI] [PubMed] [Google Scholar]
- [27].Wigle TJ, Herold JM, Senisterra GA, Vedadi M, Kireev DB, Arrowsmith CH, et al. Screening for inhibitors of low-affinity epigenetic peptide-protein interactions: an AlphaScreen-based assay for antagonists of methyl lysine binding proteins. Journal of biomolecular screening. 2010;15:62–71. [DOI] [PubMed] [Google Scholar]
- [28].Inoue A, Kikuchi S, Hishiki A, Shao Y, Heath R, Evison BJ, et al. A small molecule inhibitor of monoubiquitinated Proliferating Cell Nuclear Antigen (PCNA) inhibits repair of interstrand DNA cross-link, enhances DNA double strand break, and sensitizes cancer cells to cisplatin. The Journal of biological chemistry. 2014;289:7109–20. [DOI] [PMC free article] [PubMed] [Google Scholar]
- [29].Haas AL, Bright PM. The immunochemical detection and quantitation of intracellular ubiquitin-protein conjugates. The Journal of biological chemistry. 1985;260:12464–73. [PubMed] [Google Scholar]
- [30].Murray CW, Blundell TL. Structural biology in fragment-based drug design. Current opinion in structural biology. 2010;20:497–507. [DOI] [PubMed] [Google Scholar]
- [31].Sun Q, Phan J, Friberg AR, Camper DV, Olejniczak ET, Fesik SW. A method for the second-site screening of K-Ras in the presence of a covalently attached first-site ligand. Journal of biomolecular NMR. 2014;60:11–4. [DOI] [PMC free article] [PubMed] [Google Scholar]
- [32].Lavecchia A, Di Giovanni C, Cerchia C, Russo A, Russo G, Novellino E. Discovery of a novel small molecule inhibitor targeting the frataxin/ubiquitin interaction via structure-based virtual screening and bioassays. Journal of medicinal chemistry. 2013;56:2861–73. [DOI] [PubMed] [Google Scholar]
- [33].Vincendeau M, Hadian K, Messias AC, Brenke JK, Halander J, Griesbach R, et al. Inhibition of Canonical NF-kappaB Signaling by a Small Molecule Targeting NEMO-Ubiquitin Interaction. Scientific reports. 2016;6:18934. [DOI] [PMC free article] [PubMed] [Google Scholar]
- [34].Hicke L, Schubert HL, Hill CP. Ubiquitin-binding domains. Nature reviews Molecular cell biology. 2005;6:610–21. [DOI] [PubMed] [Google Scholar]
- [35].Hurley JH, Lee S, Prag G. Ubiquitin-binding domains. The Biochemical journal. 2006;399:361–72. [DOI] [PMC free article] [PubMed] [Google Scholar]
- [36].Hofmann K Ubiquitin-binding domains and their role in the DNA damage response. DNA repair. 2009;8:544–56. [DOI] [PubMed] [Google Scholar]
- [37].Sokratous K, Hadjisavvas A, Diamandis EP, Kyriacou K. The role of ubiquitin-binding domains in human pathophysiology. Critical reviews in clinical laboratory sciences. 2014;51:280–90. [DOI] [PubMed] [Google Scholar]
- [38].Keller R The Computer Aided Resonance Assignment Tutorial: Verlag, Cantina, Switzerland. 2004. [Google Scholar]
- [39].Farmer BT 2nd, Constantine KL, Goldfarb V, Friedrichs MS, Wittekind M, Yanchunas J Jr., et al. Localizing the NADP+ binding site on the MurB enzyme by NMR. Nature structural biology. 1996;3:995–7. [DOI] [PubMed] [Google Scholar]
- [40].Grzesiek S, Bax A, Clore GM, Gronenborn AM, Hu JS, Kaufman J, et al. The solution structure of HIV-1 Nef reveals an unexpected fold and permits delineation of the binding surface for the SH3 domain of Hck tyrosine protein kinase. NatStructBiol. 1996;3:340–5. [DOI] [PubMed] [Google Scholar]
- [41].Garrett DS, Seok YJ, Peterkofsky A, Clore GM, Gronenborn AM. Identification by NMR of the binding surface for the histidine-containing phosphocarrier protein HPr on the N-terminal domain of enzyme I of the Escherichia coli phosphotransferase system. Biochemistry. 1997;36:4393–8. [DOI] [PubMed] [Google Scholar]
- [42].Guntert P Automated NMR structure calculation with CYANA. Methods Mol Biol. 2004;278:353–78. [DOI] [PubMed] [Google Scholar]
- [43].Guerry P, Herrmann T. Comprehensive automation for NMR structure determination of proteins. Methods Mol Biol. 2012;831:429–51. [DOI] [PubMed] [Google Scholar]
- [44].Shen Y, Delaglio F, Cornilescu G, Bax A. TALOS+: a hybrid method for predicting protein backbone torsion angles from NMR chemical shifts. Journal of biomolecular NMR. 2009;44:213–23. [DOI] [PMC free article] [PubMed] [Google Scholar]
- [45].Otwinowski Z, Minor W. Processing of X-ray diffraction data collected in oscillation mode. Methods Enzymol. 1997;276:307–26. [DOI] [PubMed] [Google Scholar]
- [46].McCoy AJ, Grosse-Kunstleve RW, Adams PD, Winn MD, Storoni LC, Read RJ. Phaser crystallographic software. J Appl Crystallogr. 2007;40:658–74. [DOI] [PMC free article] [PubMed] [Google Scholar]
- [47].Emsley P, Cowtan K. Coot: model-building tools for molecular graphics. Acta Crystallogr D Biol Crystallogr. 2004;60:2126–32. [DOI] [PubMed] [Google Scholar]
- [48].Adams PD, Afonine PV, Bunkoczi G, Chen VB, Davis IW, Echols N, et al. PHENIX: a comprehensive Python-based system for macromolecular structure solution. Acta Crystallogr D Biol Crystallogr. 2010;66:213–21. [DOI] [PMC free article] [PubMed] [Google Scholar]
- [49].Chen VB, Arendall WB 3rd, Headd JJ, Keedy DA, Immormino RM, Kapral GJ, et al. MolProbity: all-atom structure validation for macromolecular crystallography. Acta Crystallogr D Biol Crystallogr. 2010;66:12–21. [DOI] [PMC free article] [PubMed] [Google Scholar]
- [50].Quinn JG. Modeling Taylor dispersion injections: determination of kinetic/affinity interaction constants and diffusion coefficients in label-free biosensing. Anal Biochem. 2012;421:391–400. [DOI] [PubMed] [Google Scholar]
Associated Data
This section collects any data citations, data availability statements, or supplementary materials included in this article.