

Abstract
Objective
To examine the feasibility, safety, systemic biological activity, and cerebral activity of a ketogenic dietary intervention in patients with glioma.
Methods
Twenty-five patients with biopsy-confirmed World Health Organization grade 2 to 4 astrocytoma with stable disease after adjuvant chemotherapy were enrolled in an 8-week Glioma Atkins-Based Diet (GLAD). GLAD consisted of 2 fasting days (calories <20% calculated estimated needs) interleaved between 5 modified Atkins diet days (net carbohydrates ≤20 g/d) each week. The primary outcome was dietary adherence by food records. Markers of systemic and cerebral activity included weekly urine ketones, serum insulin, glucose, hemoglobin A1c, insulin-like growth factor-1, and magnetic resonance spectroscopy at baseline and week 8.
Results
Twenty-one patients (84%) completed the study. Eighty percent of patients reached ≥40 mg/dL urine acetoacetate during the study. Forty-eight percent of patients were adherent by food record. The diet was well tolerated, with two grade 3 adverse events (neutropenia, seizure). Measures of systemic activity, including hemoglobin A1c, insulin, and fat body mass, decreased significantly, while lean body mass increased. Magnetic resonance spectroscopy demonstrated increased ketone concentrations (β-hydroxybutyrate [bHB] and acetone) in both lesional and contralateral brain compared to baseline. Average ketonuria correlated with cerebral ketones in lesional (tumor) and contralateral brain (bHB Rs = 0.52, p = 0.05). Subgroup analysis of isocitrate dehydrogenase–mutant glioma showed no differences in cerebral metabolites after controlling for ketonuria.
Conclusion
The GLAD dietary intervention, while demanding, produced meaningful ketonuria and significant systemic and cerebral metabolic changes in participants. Ketonuria in participants correlated with cerebral ketone concentration and appears to be a better indicator of systemic activity than patient-reported food records.
Trial Registration Information
ClinicalTrials.gov Identifier: NCT02286167.
There has been increasing interest in exploring ketogenic diet therapies (KDTs) in patients with malignant glioma (MG) given the poor survival with current therapies.1-3 A metabolically targeted treatment is appealing given the observation that MG cells rely disproportionately on glucose utilization through glycolysis for energy generation.4,5 Preclinical studies evaluating the effect of ketone bodies, a low-glucose diet, or calorie restriction have produced conflicting data on their importance for MG growth.6-9 Several small clinical studies have evaluated the tolerability and safety of various KDTs in patients with MG, but interpretation was limited by poor tolerability, inconsistent dietary restrictions, and variability in the prescribed diet.10-13
The classic KDT—a high-fat, low-carbohydrate diet—was introduced as antiseizure seizure therapy 100 years ago but more recently has been evaluated in many other neurologic diseases.14,15 A variant, the modified Atkins diet (MAD), combines carbohydrate restriction of 10 to 20 net g daily with high fat and is less restrictive while providing biological activity.16 MAD is commonly used in adults and adolescents with epilepsy given that it is more palatable, less restrictive, and associated with improved adherence as compared to traditional KDTs.16,17 Intermittent fasting has been used as an adjunct to KDTs,18 particularly during initiation to facilitate ketosis, and caloric restriction may have independent antitumor properties in glioma.19,20 While KDTs produce systemic ketosis, studies have failed to show a consistent association between seizure control and ketonemia,21,22 and the role of cerebral ketosis is unknown.
We developed the Glioma Modified Atkins Diet (GLAD) to rigorously evaluate the feasibility of an 8-week dietary intervention in patients with astrocytoma and to correlate adherence with systemic and cerebral biological activity. The GLAD intervention combined the MAD with 2 interspersed fasts each week to replicate the caloric restriction from preclinical glioma models with ketosis in a safe fashion feasible for sustained use.23
Methods
Study Design and Population
The trial was a single-arm phase II study (n = 25) designed to assess the feasibility, safety, and activity of a MAD combined with intermittent fasting to prevent recurrence in patients with astrocytoma after the completion of adjuvant chemotherapy (NCT02286167). Patients were enrolled from March 2015 to January 2019. Eligible patients were adults (age ≥18 years) with a Karnofsky Performance Status score ≥60 and a diagnosis of astrocytoma (World Health Organization grade 2, 3, or 4 astrocytoma) who had already completed ≥80% of prescribed radiation therapy, concurrent temozolomide, and adjuvant temozolomide without Common Terminology Criteria for Adverse Events (CTCAE) grade 4 leukopenia, neutropenia, or thrombocytopenia. Treatment must have been completed at least 1 month before enrollment. Clinically available data on the presence of isocitrate dehydrogenase (IDH) gene mutation or O6-methylguanine-DNA methyltransferase promoter methylation status, which are standard molecular biomarkers, were collected. Exclusion criteria included treatment with MAD (defined as self-reported KDT with carbohydrate restriction to 20 g daily or regular ketone testing) within 9 months of enrollment, a preexisting condition that could be exacerbated by a KDT (clinically significant renal disease, hepatic dysfunction, or insulin-dependent diabetes), or a body mass index (BMI) <20 or >40 kg/m2. All patients were required to complete a baseline 3-day food intake record to ensure satisfactory self-monitoring. Adverse events were monitored, and serious adverse events were reported promptly to the respective institutional review board and study principal investigator.
Intervention
The study intervention consisted of an 8-week diet, which included 2 fasting and 5 MAD days each week. MAD days involved net (subtracting fiber) carbohydrate restriction to 20 g/d with no caloric restriction. The nonconsecutive fasting days had strict caloric restriction of up to 20% of the recommended daily caloric intake for each patient, which was provided via a 4:1 ratio ketogenic liquid (e.g., KetoCal drink, Nutricia North America, Inc, Gaithersburg, MD). KetoCal was provided to all study participants free of charge, as were urine ketone testing strips to measure acetoacetate (AcAc) concentrations. All diets were customized with the guidance of a registered dietitian (RD).
Participants met with the study team, including an RD for diet education and food record guidance at the start of the study and at 2-week intervals for the duration of the 8-week study (5 visits total). Estimated calorie needs were calculated with the Mifflin–St. Jeor equation with an appropriate activity factor based on participant-reported activity level.24 In-person education was provided and supplemented by an at-home video on diet initiation, including specific instructions for fasting and nonfasting days.
Measurements
Electrolyte monitoring and laboratory-based urine ketone monitoring were performed every 2 weeks. Physical and laboratory assessments were performed every 4 weeks. Magnetic resonance spectroscopy (MRS) was performed at baseline and at the final study visit (week 8). Bioelectric impedance analysis (BIA) was conducted by an RD at bedside at baseline and every 4 weeks with a BIA analyzer (Rjl Systems Quantum X or Quantum Desktop Body Composition Analyzer, Clinton Township, MI). Dietary self-monitoring included (1) 3-day food records (plus fasting-day records) completed before each of the 5 study visits,25,26 (2) twice-weekly urine ketones, and (3) weekly home weights. Home urine ketones were tested at approximately the same time each day (in the morning for most patients) and were recorded the morning after a fasting or MAD day.
Imaging
Patients underwent MRS scans at the beginning and end of the diet (8-week interval) on 3T magnetic resonance scanners at either Johns Hopkins (18 patients; Baltimore, MD) or Wake Forest (7 patients; Winston-Salem, NC). Full technical details of the MRS acquisition and analysis methods were previously reported in a subset of the patients (i.e., interim analysis) reported here.27 A 2 × 2 × 2–cm3 voxel was placed in a region maximally occupied by the lesion, and a second voxel was placed in the contralateral hemisphere in a region mirroring the first. The lesional voxel was placed in known tumor or, in patients with an initial gross total resection, in abnormal parenchyma adjacent to the resection cavity. The LCModel program28 was used to fit spectra, with fully localized simulated basis sets for each site containing 21 metabolites, 3 ketone bodies (acetone [Ace], β-hydroxybutyrate [bHB], AcAc), and 2-hydroxyglutarate (2-HG). Metabolite concentrations were estimated relative to an internal water reference.
Study Endpoints
The primary endpoint of this study was dietary adherence at 8 weeks. This was defined over the course of weeks 2 to 8 as (1) compliance with MAD as measured by food records (average ≤20 g net carbohydrates per day), (2) compliance with fasting days (no more than 20% calories based on the individual's calculated energy needs), and (3) no days with ≥40 g net carbohydrates. Secondary endpoints included measures of pharmacokinetics (laboratory or home-measured urine AcAc), pharmacodynamics (fasting glucose, hemoglobin A1c, insulin, insulin-like growth factor-1 [IGF-1]), cerebral biological activity (cerebral ketones as assessed by MRS), and safety (home or clinic weight, BMI, total cholesterol, low-density lipoprotein, triglycerides, blood cell counts, and adverse event collection). We estimated that it would take 2 to 4 weeks for patients to develop proficiency with the diet; therefore, average ketonuria was defined as an average of home postfast and post-MAD day ketone measures from weeks 2 to 8 of the diet. Safety data on adverse events were collected at all study visits via patient interview and were classified according to CTCAE (version 4.03).
Data Management and Statistical Analysis
Staff from both sites entered patient data into a secure browser-based, electronic data capture software (REDCap). Each patient's data were given an anonymous numeric code that prevented patient identification to protect patient privacy. Data entry was checked periodically for consistency.
Statistical analyses were performed by an author (F.-C.H). Means and SDs were presented for normally distributed continuous measures. Percentages and counts were presented for discrete measures. For the feasibility analysis, the primary outcome was dietary adherence by food records. Average ketosis during weeks 4 to 8 was compared between adherence groups with the Wilcoxon rank-sum test. The change in cerebral metabolite concentrations before and after the 8-week dietary intervention in the lesional (tumor) and contralateral brain was compared with the 2-sample t test. The total metabolite concentrations before and after dietary intervention were compared with the paired t test. The association between average ketonuria and the change in cerebral ketone concentrations was estimated with the Spearman rank correlation coefficient.
The 8-week changes in systemic measures were calculated. The paired t test was used to test whether the change was equal to 0. The relationship between average ketonuria and measures of systemic and cerebral activity was estimated with the Spearman rank correlation coefficient. Comparison between patients with IDH-mutant and wild-type (WT) glioma was performed with Fisher exact tests or χ2 tests for discrete measures and 2-sample t tests for continuous change measures. The individual trajectories of BMI and white blood cell count (WBC) over time were shown with spaghetti plots. All analyses were performed with SAS software (SAS Inc, Cary, NC). Given the pilot nature of the feasibility analysis and the purpose of descriptive analysis, we did not correct for multiple comparisons. A value of p < 0.05 was considered statistically significant.
Standard Protocol Approvals, Registrations, and Patient Consents
The clinical study was conducted at Johns Hopkins and the Wake Forest Baptist Medical Center with the approval of both institutional review boards.27 Written informed consent was obtained from all patients participating in the study, and the original forms were collected and stored per institutional protocol.
Data Availability
Anonymized data will be shared on request from any qualified investigator.
Rigor and Reproducibility
The sample size of 25 was determined using a null hypothesis of 60% compared to an alternative of 85% as a clinically meaningful indicator of feasibility and based on prior reports in this population.12 Twenty-five participants yielded an 80% power to detect an absolute difference of 25% in feasibility proportion at an α level of 0.05 (2 sided) using a 1-sample χ2 test.
Results
Participant Characteristics and Diet Feasibility
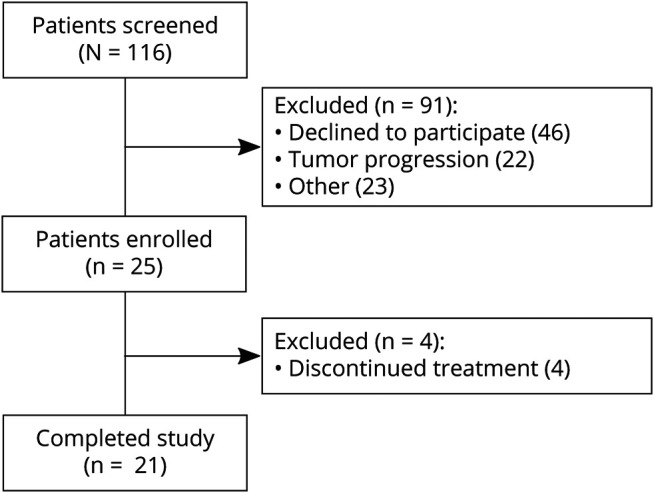
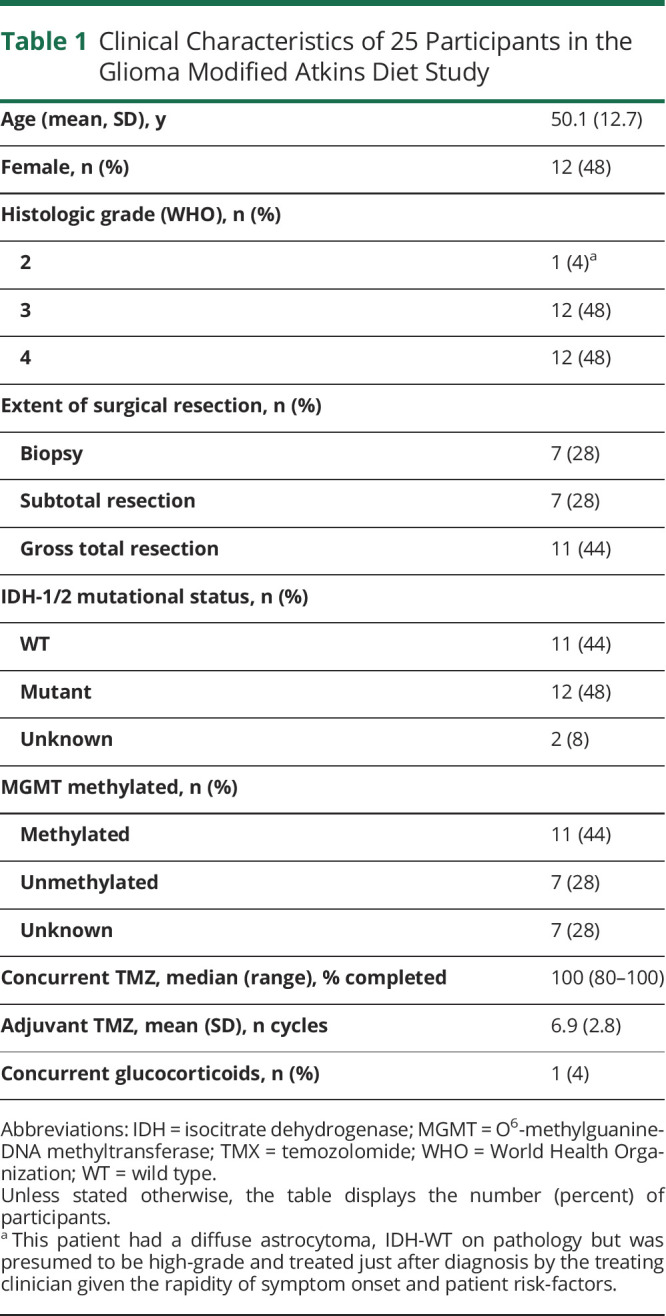
One hundred sixteen patients were screened for the study, and 25 enrolled (Figure 1). Of those who did not enroll, 22 experienced disease progression during the screening process, 2 were denied insurance prior authorization, and 21 were ineligible due to other factors such as previous use of a KDT (n = 5), medical contraindication (insulin-dependent diabetes, medically significant renal disease, BMI <20 kg/m2), or concomitant use of an investigational drug. Forty-six screened patients declined to participate for a variety of reasons, including lack of interest, transportation concerns, or the perception that the dietary intervention was unhealthy. Baseline characteristics of the 25 participants and their glioma are listed in Table 1. A total of 21 patients completed the study (84%). Those who did not complete the study reported fatigue, difficulty with meal planning, weight loss, or decreased quality of life as their reasons for stopping the intervention. All participants who reached week 4 were able to successfully complete the entire study.
Figure 1. Schema Depicting the Patients Screened and Enrolled in the Glioma Modified Atkins Diet Study.
.
Table 1.
Clinical Characteristics of 25 Participants in the Glioma Modified Atkins Diet Study
According to our definition of dietary adherence (described in Methods), 48% of participants (n = 12) were adherent with the intervention. Seventy-two percent of study patients (n = 18) were adherent with both MAD and fasting interventions but had 1 day with ≥40 g carbohydrates, a more lenient but possibly more realistic assessment of adherence.
Six months after completing the dietary intervention, participants were interviewed by phone to assess ongoing dietary practices. Of the 21 participants who completed the intervention, 9 (43%) reported they were still following some type of dietary intervention for treating their brain tumor. Of those 9, 5 were following MAD alone, 1 was following intermittent fasting alone, 1 was following both MAD and intermittent fasting, and 1 participant did not specify.
Effect of GLAD Dietary Intervention on Systemic Ketonuria
All 25 participants had quantifiable ketonuria at some point during the trial. Urine AcAc levels were measured in the morning and, on average, were higher the day after fasting (Figure 2A) compared with the day after MAD (Figure 2B). Average ketonuria rose sharply over the first 4 weeks of the study and then plateaued. Eighty percent of patients achieved moderate (≥40 mg/dL) or greater ketonuria at some point during the study. Average ketonuria during weeks 4 to 8 did not correlate with whether patients were adherent with our strict, a priori definition (p = 0.81) or with the more inclusive definition of adherence (p = 0.84) compared with nonadherent patients by those definitions.
Figure 2. Effect of GLAD Dietary Intervention on Systemic Ketonuria and Cerebral Ketones and Metabolites.

Urine ketone (acetoacetate [AcAc]) concentration measured (A) after fasting days and (B) after modified Atkins diet (MAD) days each week on study. Percentage of participants reporting data (N = 18–21) with moderate or greater ketosis after fasting days was 71% at week 2, 83% at week 4, 68% at week 6, and 78% at week 8. AcAc concentrations: trace 5 mg/dL, small 15 mg/dL, moderate 40 mg/dL, large 80 mg/dL, and extra-large 160 mg/dL. (C) Lesion (blue) and contralateral brain (gray) ketone and metabolite concentrations before and after 8 weeks of Glioma Atkins-Based Diet (GLAD) dietary intervention. Asterisks indicate significant differences between hemispheres at either time point. (D) Changes in lesion and contralateral brain ketone and metabolite concentrations before and after 8-week dietary intervention in the lesional (green) and contralateral (gray) brain. Asterisks indicate significant differences between time points (*p ≤ 0.05, **p ≤ 0.01, ***p ≤ 0.001). Ace = acetone; bHB = β-hydroxybutyrate; Cho = phosphocholine; Gln = glutamine; Glu = glutamate; Glx = combination of Gln and Glu; Lac = lactate; NAA = N-acetylaspartic acid; tNAA = total NAA.
Effect of GLAD Dietary Intervention on Cerebral Ketone Concentrations
Cerebral ketone concentrations were quantified using MRS with a single voxel in the region of the brain tumor (lesional) and in contralateral brain at baseline and at the end of study. Due to technical factors (n = 2) and study attrition (n = 4), only 19 paired MRS studies were available for analysis. There was a significant increase in bHB concentrations in the lesional (p = 0.011; Figure 2C) and contralateral (p = 0.031) brain and Ace in the lesional (p = 0.012) and contralateral (p = 0.005) brain compared to baseline. There was not a significant difference in ketone concentration in lesional compared to contralateral brain (bHB p = 0.054, Ace p = 0.16). AcAc was not reliably detected in many voxels for technical reasons, consistent with previous findings in glioma,29 and no significant change was found.
We evaluated the relationship between average ketonuria and the change in cerebral ketone concentrations as quantified by MRS. There was a moderate to strong correlation between average urine ketone and change in cerebral ketone concentrations of bHB and Ace in lesional (bHB Rs = 0.52, p = 0.05; Ace Rs = 0.50, p = 0.06) and contralateral (bHB Rs = 0.46, p = 0.08; Ace Rs = 0.71, p = 0.003) brain. This correlation was statistically significant for some ketones but not others. The relationship was not significant for AcAc.
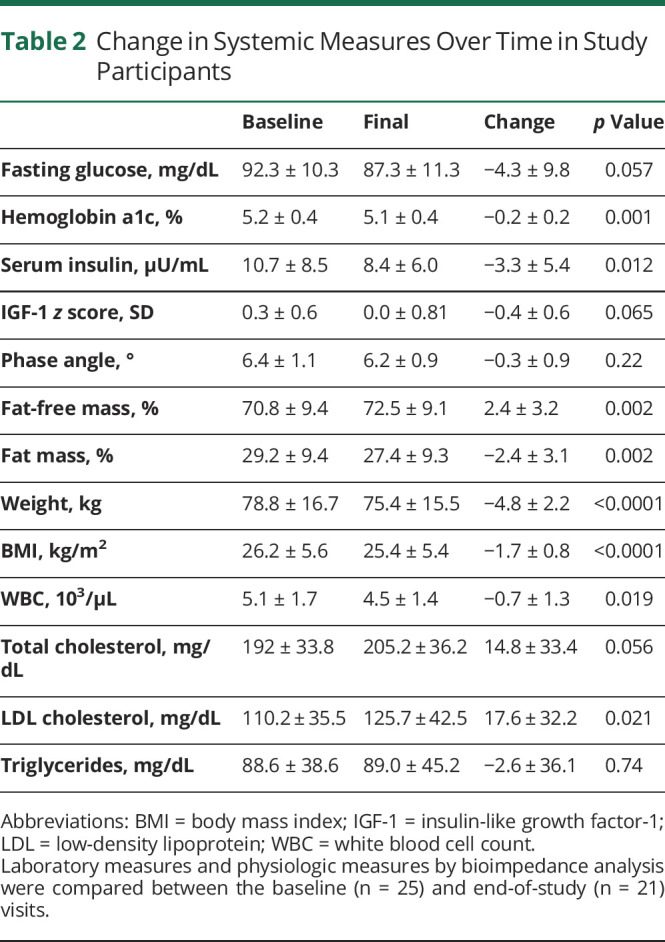
Effect of GLAD Dietary Intervention on Systemic Metabolic Activity
Predetermined laboratory investigations were quantified at baseline and end of study in participants (Table 2). There was a significant decrease in hemoglobin A1c (p < 0.001) and serum insulin (p = 0.012) over the course of the study, measures of the body's overall glucose levels and glucose regulation. There was no decrease in fasting glucose or IGF-1. We did not observe any difference between the change in weight, BMI at weeks 4 and 8, hemoglobin A1c, serum insulin, or IGF-1 z score in patients who were adherent compared with nonadherent patients using either definition of dietary adherence.
Table 2.
Change in Systemic Measures Over Time in Study Participants
Effect of GLAD Dietary Intervention on Cerebral Metabolic Activity
Measures of glucose metabolism on MRS, including glutamine (Gln), glutamate (Glu), and the combination (Glx; Gln + Glu), did not change significantly in the lesional or contralateral brain over the course of the study. There was a difference in relative Glu vs Gln concentrations at baseline in lesional vs contralateral brain, and that difference persisted after the study. Over the course of the study, Gln decreased in the lesion but increased in contralateral brain (n = 16, p = 0.04, Figure 2D), suggesting alterations in Gln processing in the region of the tumor. Phosphocholine (Cho), which can be elevated in brain tumors, was higher in the lesion than contralateral brain at baseline but decreased in the lesion, suggesting normalization of choline metabolism over the course of the intervention (n = 16, p = 0.001). There were no differences in lactate, N-acetylaspartic acid, or other detectable metabolites over the course of the study (Figure 2D).
Relationship Between Ketonuria and Systemic and Cerebral Metabolic Activity
Higher ketonuria presumably reflects increased dietary adherence, although we did not observe a strong relationship according to our a priori definition of dietary adherence. We therefore examined the relationship between average ketonuria over the course of the study and measures of systemic and cerebral activity. There was a significant inverse relationship between average ketonuria and fasting glucose (Rs = −0.54, p = 0.01), as well as bioimpedance phase angle (Rs = −0.48, p = 0.03), a measure of overall nutritional status.30,31 There was no relationship between average ketonuria and change in insulin, hemoglobin A1c, weight, or BMI.
We evaluated the relationship between ketonuria and cerebral metabolites measured by MRS. Unlike serum fasting glucose, there was no relationship between systemic ketonuria and cerebral Gln, Glu, or Glx in the lesional or contralateral brain over the course of the study.
Safety of GLAD Dietary Intervention
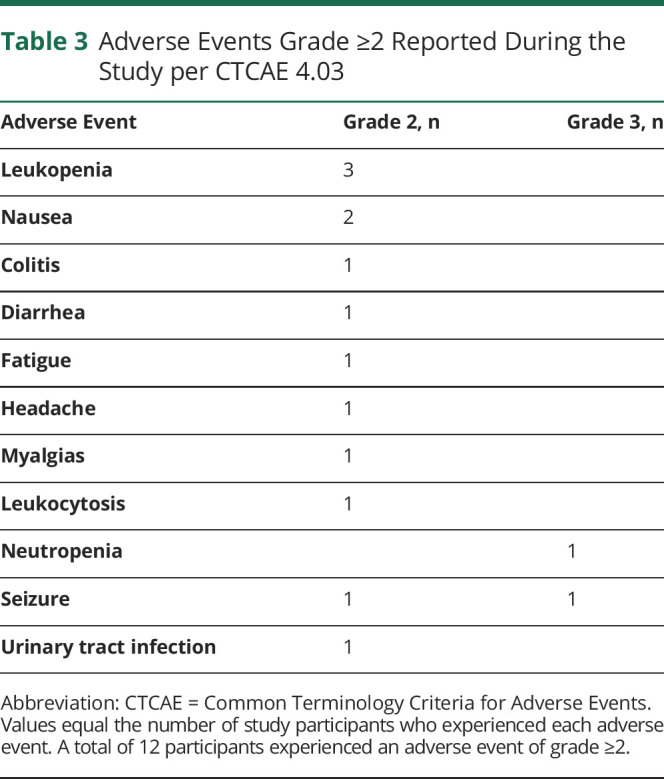
The diet was well tolerated (Table 3), with few adverse events. Twelve patients had grade 2 adverse events, including leukopenia, nausea, diarrhea, fatigue, or seizure (per CTCAE 4.03). One patient had grade 3 neutropenia (possibly related), and 1 had grade 3 seizures (not related). We observed no difference in physiologic markers of safety (weight, BMI, total WBC, total cholesterol, triglycerides, and low-density lipoprotein) in patients who were adherent with either definition compared with those who were not.
Table 3.
Adverse Events Grade ≥2 Reported During the Study per CTCAE 4.03
Given concerns that a restrictive diet with two >24-hour fasts per week could affect the nutritional status of patients with cancer, we evaluated the effect of the GLAD dietary intervention on weight, BMI, WBC, and cholesterol (Table 2). Patients lost an average of 4.8 kg over the course of the study (p < 0.0001), and total BMI decreased from 26.2 ± 5.6 to 25.4 ± 5.4 kg/m2 (p < 0.0001). This was consistent with a normalization of overall BMI; patients who were overweight at the start of the GLAD dietary intervention lost more weight than those who had a normal BMI when beginning the study (Figure 3A).
Figure 3. Change in BMI and WBC Count During the GLAD Intervention.

(A) Body mass index (BMI) and (B) white blood cell count (WBC) over time shown as hashed line for each participant in the Glioma Atkins-Based Diet (GLAD) study. Healthy-weight BMI and physiologic normal WBC values are indicated by solid black line.
We performed BIA every 4 weeks on study to determine whether weight loss was due to fat or muscle loss. On BIA, overall percent fat-free mass increased (p = 0.002), while percent fat mass decreased (p = 0.002). Phase angle, a measure of overall nutritional status, did not change in participants over the 8-week study intervention despite the fasting days and documented weight loss in most participants.
Total WBCs have been shown to decrease slightly in patients with epilepsy on a KDT,32 possibly due to decreased systemic inflammation.33 This was of particular concern in our patient population because standard treatment for MG includes ionizing radiation and chemotherapy with temozolomide, both of which can negatively affect WBCs. We evaluated the change in overall WBC in our patient cohort and found a small but significant decrease in total WBC (Figure 3B). While many study participants started with a relatively low WBC, the largest decreases were observed in patients with normal WBC at baseline. Over the course of the study, 4 patients had grade 2 leukopenia and 1 had grade 3 neutropenia per CTCAE 4.03 criteria.
KDTs, including the MAD, are associated with transiently increased serum lipids that normalize over time.34 In our patient cohort, there was a small but significant increase in low-density lipoprotein cholesterol (Table 2) but not total cholesterol or triglycerides over the course of the study.
Effect of Ketogenic Diet in IDH-Mutant Glioma
Given the interest in the role of dietary glucose on IDH-mutant glioma, we evaluated this cohort as a post hoc subgroup analysis. In our study, 12 patients had IDH-mutant and 11 had IDH-WT glioma. On average, the group with IDH-mutant glioma were younger and less likely to have grade IV glioma (Table 4), but otherwise, the groups were similar. Adherence was similar between participants with IDH-mutant and those with IDH-WT glioma. Participants with IDH-mutant glioma did not have different ketonuria compared with those with IDH-WT glioma (3.5 ± 3.3 vs 2.5 ± 2.4, p = 0.076).
Table 4.
Comparison Between Study Participants With IDH-Mutant and IDH-WT Glioma
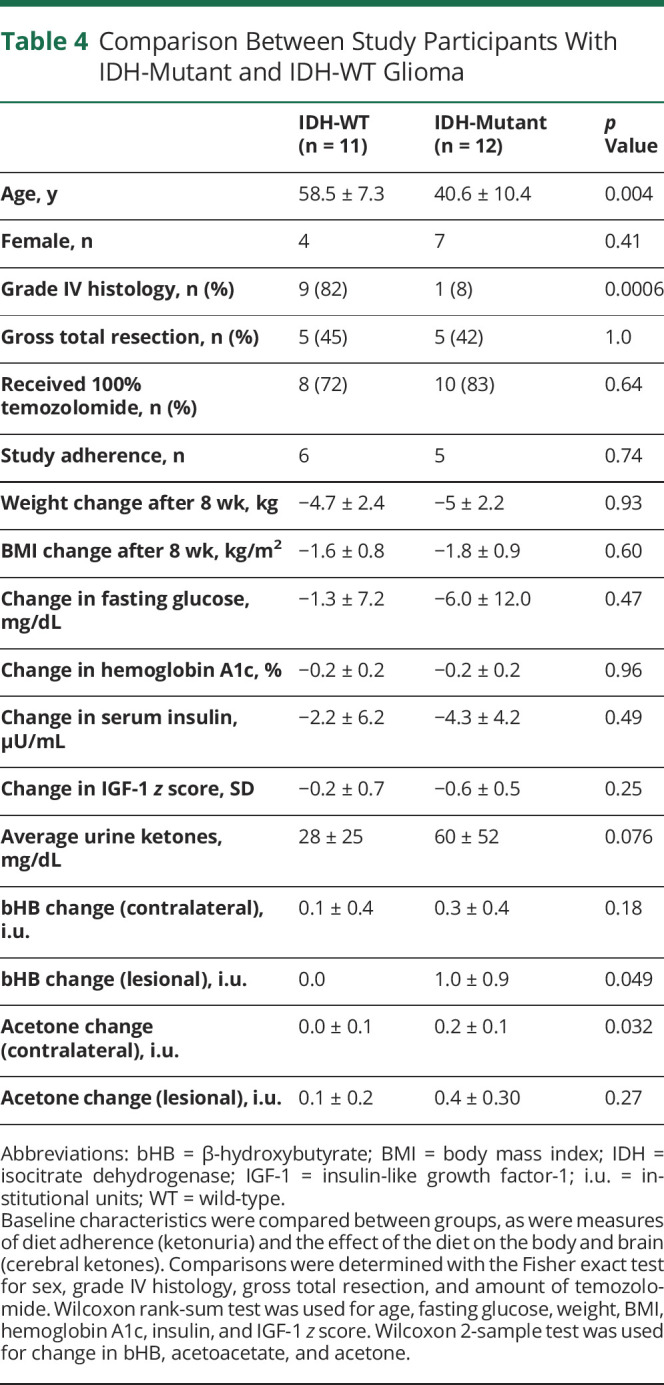
On MRS, there was a significant difference in lesional bHB (p = 0.01) and contralateral brain Ace (p = 0.006) between IDH-mutant and IDH-WT participants over the course of the study. However, after correction for the difference in average ketonuria, this trend disappeared, suggesting that patients with IDH-mutant glioma had more ketonuria during this study that accounted for the higher ketone concentrations on MRS. There were no differences in concentrations of glucose metabolites (Glu, Gln, Glx) between those with IDH-WT and patients with IDH-mutant glioma over the course of the study. We did not observe a quantifiable difference in 2-HG levels because the MRS acquisition for this project was not optimized for 2-HG quantification.
Discussion
The purpose of this study was to evaluate the feasibility, safety, and biological effect of a ketogenic dietary intervention with intermittent fasting in patients with astrocytoma. We conducted a single-arm study of a rigorously defined dietary intervention with prespecified study endpoints for feasibility, safety, systemic biological effect, and cerebral effect. The study itself lasted 8 weeks, with study visits every 2 weeks for safety monitoring and further dietary education by an RD. The data presented here demonstrate that the GLAD dietary intervention is safe for patients with glioma and feasible for 48% of participants using the strictest definition of adherence and for 72% with relaxed diet requirements (as evaluated by dietary adherence) but for 80% of participants on the basis of moderate or greater ketonuria. The GLAD dietary intervention is safe, with the most common grade 2 or higher toxicity being leukopenia (12%), although this may have been secondary to prior treatment with radiation and temozolomide, which are known to induce leukopenia. These data also demonstrate that the GLAD intervention can produce quantifiable systemic and cerebral metabolic changes. Last, we found that the systemic and cerebral metabolic activity of IDH-mutant glioma at steady state is quite similar to that of IDH-WT glioma on MRS.
The GLAD intervention produced quantifiable systemic and cerebral ketosis in participants. As anticipated, participants had quantifiable, sustained ketonuria over the course of the study. Notably, cerebral ketone concentrations (measured by MRS) increased in both lesional and contralateral brain, correlating with ketonuria. We and others previously demonstrated the feasibility of quantifying cerebral ketones using noninvasive imaging as a biomarker for cerebral activity in patients with neurologic diseases.27,29 While decreasing Cho concentrations in response to treatment in glioma are well documented, the effects of tumor treatments on Gln are less established.35,36 This study demonstrates that a systemically delivered dietary intervention can generate quantifiable changes in cerebral metabolites. This is an important step for evaluating the candidacy of any therapeutic intervention in glioma. Demonstrating that a drug or intervention can enter the brain and have an on-target effect is increasingly recognized as integral to the therapeutic development of treatments in neurology and neuro-oncology.38 These data demonstrate on-target changes in the brain in response to a dietary intervention.
We hypothesized the GLAD dietary intervention would result in quantifiable systemic and cerebral activity. We observed a decrease in hemoglobin A1c and serum insulin over the course of the study. Higher systemic ketonuria also correlated with lower fasting glucose, as anticipated. We did not see a correlation between dietary adherence and any markers of systemic activity, further supporting the idea that dietary adherence as measured by food records may not be as accurate a predictor of dietary dose as ketone measurements. In the brain, inverse patterns of Gln changes in lesional and contralateral brain occurred over the course of the study. Higher Gln and Cho levels were observed in lesional brain at baseline, as might be expected in tumor tissue, but these decreased after the dietary intervention. This may be consistent with normalization of Gln and choline metabolism, both of which are altered in brain tumors. This observation will need to be validated in a longer study with disease outcome endpoints.
There is a growing body of evidence that IDH-mutant gliomas are metabolically different from IDH-WT gliomas,38 which was not supported by this study. While we observed increased cerebral ketone concentrations in IDH-mutant glioma, this difference disappeared when controlled for ketonuria. We did not observe differences in Glu or Gln using MRS and mass spectrometry in IDH-mutant gliomas as previously reported.39,40 The reason may be that our patients were observed at steady state, so changes in relative energy utilization are not obvious, or that some patients had gross total resection, and voxel placement adjacent to the resection cavity failed to capture viable tumor. Our MRS scan protocol was not optimized for 2-HG detection, although this was included in the spectral fitting parameters. Thus, in this study, we were not able to reliably detect 2-HG in the majority of cases and therefore do not report 2-HG levels here.
This study demonstrates the challenges with dietary adherence to a KDT in patients. Although our definition of adherence was strict, the study was designed to maximize feasibility for participants with an expert RD, frequent visits for assessment and support, and enrollment of patients with stable disease after completion of chemoradiation and adjuvant temozolomide. Although feasibility with our rigorously predetermined definition of adherence was limited to half of the participants, there was good adherence with both the MAD and intermittent fasting components, suggesting that patients were generally motivated and able to comply with the dietary restrictions but had rare dietary deviations from the intervention guidelines. Moreover, adherence with the GLAD intervention in this study was higher than in the small glioma studies published to date, with compliance ranging from 30% to 80% (for a 9-day dietary intervention).10-13 The reasons are likely multifactorial but include the fact that the GLAD intervention took place in patients with stable disease after standard treatment, incorporated MAD rather than the classic ketogenic diet, and relied on dietary education and support from an RD at all study visits. This study was not designed to compare the roles of these individual factors, but overall, the GLAD intervention resulted in superior adherence over other studies in a similar population.
This study also highlights the challenges of selecting the optimal dietary intervention to produce a biologic effect. Despite 48% adherence by food record, all participants achieved ketonuria over the course of the study, and 80% achieved at least moderate ketonuria, suggesting that even those who were not strictly adherent per our a priori definition still experienced metabolic effects from the study intervention. In addition, metabolic endpoints correlated with ketonuria but not dietary compliance. This illustrates the importance of monitoring the systemic changes associated with a KDT to determine adherence and true dietary effect. Furthermore, fasting was included in the GLAD intervention to boost ketosis and given the preclinical data supporting caloric restriction.19,20 While average ketonuria was slightly higher after a fasting day, the study was not designed to assess the overall contribution of the fasting and MAD components individually. With this study, we demonstrate the importance of monitoring patient ketone production to determine biological effect, a critical aspect for selecting the optimal therapeutic dose in future studies.
There are several important limitations of this study. The most obvious is the high degree of self-selection in the study population. More than 110 patients were screened to enroll the 25 needed to complete this study. While we have shown that the GLAD intervention is feasible and safe in a select population, that may not be true in the general population of patients with glioma. A second limitation to generalizability is the high degree of contact with study team members provided to all participants, with a detailed dietary education session at enrollment, biweekly in-person study visits with an RD, and regular access to the study team for support. This level of accessibility may not be feasible in a larger study or routine clinical care. In addition, due to technical factors, several patients' MRS studies were excluded, leaving only 19 paired scans for evaluation, which limited our power to detect cerebral metabolic effects.
This study demonstrates that a strict KDT with intermittent fasting can be undertaken safely in patients with glioma and successfully produces quantifiable systemic and cerebral metabolic changes, indicating a meaningful biological effect. Future studies are needed to determine whether GLAD prevents glioma growth and improves survival.
Glossary
- AcAc
acetoacetate
- Ace
acetone
- bHB
β-hydroxybutyrate
- BIA
bioelectric impedance analysis
- BMI
body mass index
- Cho
phosphocholine
- CTCAE
Common Terminology Criteria for Adverse Events
- GLAD
Glioma Modified Atkins Diet
- Gln
glutamine
- Glu
glutamate
- Glx
combination of Gln and Glu
- IDH
isocitrate dehydrogenase
- IGF-1
insulin-like growth factor-1
- KDT
ketogenic diet therapy
- MAD
modified Atkins diet
- MG
malignant glioma
- MRS
magnetic resonance spectroscopy
- RD
registered dietitian
- 2-HG
2-hydroxyglutarate
- WBC
white blood cell count
- WT
wild-type
Appendix. Authors

Footnotes
CME Course: NPub.org/cmelist
Study Funding
This study was funded by philanthropy by Dr. John and Elaine Freeman, Dr. Jon Weingart, and the Martz, Redwood, and Dalos families, without whom this project could not have taken place. Research reported in this publication was supported by the National Center for Advancing Translational Sciences (NCATS), NIH, through grant KL2TR001421 and the National Cancer Institute's (NCI’s) Cancer Center Support Grant award P30CA012197 issued to the Wake Forest Baptist Comprehensive Cancer Center. The authors acknowledge use of the services and facilities of the Clinical Research Unit of the Wake Forest Clinical and Translational Sciences Institute and the Johns Hopkins Institute for Clinical and Translational Research (ICTR), both of which are funded in part by NCATS and NIH Roadmap for Medical Research by Grant awards UL1TR001420 and UL1TR003098. The content is solely the responsibility of the authors and does not necessarily represent the official views of the Johns Hopkins ICTR, NCATS, NIH, NCI, or the National Institute of Neurologic Disorders and Stroke. This work was performed while A.L.H. and A.B. were full-time employees of Johns Hopkins University.
Disclosure
K.C. Schreck, F.-C. Hsu, A. Berrington, B. Henry-Barron, D. Vizthum, and L. Blair report no disclosures relevant to the manuscript. E.H. Kossoff is on the scientific advisory board for Atkins Nutritionals and serves as a consultant for Nutricia and Vitaflow. L. Easter, C.T. Whitlow, and P.B. Barker report no disclosures relevant to the manuscript. M.C. Cervenka received funding from Nutricia, Vitaflo, BrightFocus Foundation, and Army Research Laboratory; received honoraria from the American Epilepsy Society, The Neurology Center, Epigenix, LivaNova, and Nutricia] and has done consulting for Nutricia, Glut1 Deficiency Foundation, and Sage Therapeutics. J.O. Blakeley reports no disclosures relevant to the manuscript. R.E. Strowd serves a consultant for Monteris Medical Inc, Novocure, Kaplan, Inc, and Lecturio; he receives an editorial stipend as section editor of the Resident and Fellow Section of Neurology® and has received research/grant support from the American Academy of Neurology, American Society for Clinical Oncology, Southeastern Brain Tumor Foundation, Jazz Pharmaceuticals, and the American Board of Psychiatry and Neurology. Go to Neurology.org/N for full disclosures.
References
- 1.Louis DN, Perry A, Reifenberger G, et al. The 2016 World Health Organization classification of tumors of the central nervous system: a summary. Acta Neuropathol. 2016;131(6):803-820. [DOI] [PubMed] [Google Scholar]
- 2.Strowd RE, Cervenka MC, Henry BJ, Kossoff EH, Hartman AL, Blakeley JO. Glycemic modulation in neuro-oncology: experience and future directions using a modified Atkins diet for high-grade brain tumors. Neurooncol Pract. 2015;2(3):127-136. [DOI] [PMC free article] [PubMed] [Google Scholar]
- 3.Winter SF, Loebel F, Dietrich J. Role of ketogenic metabolic therapy in malignant glioma: a systematic review. Crit Rev Oncol Hematol. 2017;112:41-58. [DOI] [PubMed] [Google Scholar]
- 4.Warburg O. On respiratory impairment in cancer cells. Science. 1956;124(3215):269-270. [PubMed] [Google Scholar]
- 5.Oudard S, Arvelo F, Miccoli L, et al. High glycolysis in gliomas despite low hexokinase transcription and activity correlated to chromosome 10 loss. Br J Cancer. 1996;74(6):839-845. [DOI] [PMC free article] [PubMed] [Google Scholar]
- 6.Maurer GD, Brucker DP, Bähr O, et al. Differential utilization of ketone bodies by neurons and glioma cell lines: a rationale for ketogenic diet as experimental glioma therapy. BMC Cancer. 2011;11(1):315. [DOI] [PMC free article] [PubMed] [Google Scholar]
- 7.Seyfried TN, Sanderson TM, El-Abbadi MM, McGowan R, Mukherjee P. Role of glucose and ketone bodies in the metabolic control of experimental brain cancer. Br J Cancer. 2003;89(7):1375-1382. [DOI] [PMC free article] [PubMed] [Google Scholar]
- 8.Zhou W, Mukherjee P, Kiebish MA, Markis WT, Mantis JG, Seyfried TN. The calorically restricted ketogenic diet, an effective alternative therapy for malignant brain cancer. Nutr Metab. 2007;(4):5. [DOI] [PMC free article] [PubMed] [Google Scholar]
- 9.Abdelwahab MG, Fenton KE, Preul MC, et al. The ketogenic diet is an effective adjuvant to radiation therapy for the treatment of malignant glioma. PLoS One. 2012;7(5):e36197. [DOI] [PMC free article] [PubMed] [Google Scholar]
- 10.Martin-McGill KJ, Marson AG, Tudur Smith C, et al. . Ketogenic Diets as an Adjuvant Therapy for Glioblastoma (KEATING): a randomized, mixed methods, feasibility study. J Neurooncol. 2020;147(1):213-227. [DOI] [PMC free article] [PubMed] [Google Scholar]
- 11.van der Louw EJTM, Olieman JF, van den Bemt PMLA, et al. . Ketogenic diet treatment as adjuvant to standard treatment of glioblastoma multiforme: a feasibility and safety study. Ther Adv Med Oncol. 2019;11:1758835919853958. [DOI] [PMC free article] [PubMed] [Google Scholar]
- 12.Rieger J, Bähr O, Maurer GD, et al. ERGO: a pilot study of ketogenic diet in recurrent glioblastoma. Int J Oncol. 2014;44(6):1843-1852. [DOI] [PMC free article] [PubMed] [Google Scholar]
- 13.Voss M, Wagner M, von Mettenheim N, et al. . ERGO2: a prospective, randomized trial of calorie-restricted ketogenic diet and fasting in addition to reirradiation for malignant glioma. Int J Radiat Oncol Biol Phys. 2020;108(4):987-995. [DOI] [PubMed] [Google Scholar]
- 14.Wilder RM. The effects of ketonemia on the course of epilepsy. Mayo Clin Bull. 1921;2:307. [Google Scholar]
- 15.McDonald TJW, Cervenka MC. Ketogenic diets for adult neurological disorders. Neurotherapeutics. 2018;15(4):1018-1031. [DOI] [PMC free article] [PubMed] [Google Scholar]
- 16.Kossoff EH, Cervenka MC, Henry BJ, Haney CA, Turner Z. A decade of the modified Atkins diet (2003-2013): results, insights, and future directions. Epilepsy Behav. 2013;29(3):437-442. [DOI] [PubMed] [Google Scholar]
- 17.Kossoff EH, Rowley H, Sinha SR, Vining EP. A prospective study of the modified Atkins diet for intractable epilepsy in adults. Epilepsia. 2008;49(2):316-319. [DOI] [PubMed] [Google Scholar]
- 18.Hohn S, Dozieres-Puyravel B, Auvin S. History of dietary treatment: Guelpa & Marie first report of intermittent fasting for epilepsy in 1911. Epilepsy Behav. 2019;94:277-280. [DOI] [PubMed] [Google Scholar]
- 19.Lee C, Longo VD. Fasting vs dietary restriction in cellular protection and cancer treatment: from model organisms to patients. Oncogene. 2011;30(3):3305-3316. [DOI] [PubMed] [Google Scholar]
- 20.Zuccoli G, Marcello N, Pisanello A, et al. Metabolic management of glioblastoma multiforme using standard therapy together with a restricted ketogenic diet: case report. Nutr Metab. 2010;(7):33. [DOI] [PMC free article] [PubMed] [Google Scholar]
- 21.Likhodii SS, Musa K, Mendonca A, Dell C, Burnham WM, Cunnane SC. Dietary fat, ketosis, and seizure resistance in rats on the ketogenic diet. Epilepsia. 2000;41(11):1400-1410. [DOI] [PubMed] [Google Scholar]
- 22.Todorova MT, Tandon P, Madore RA, Stafstrom CE, Seyfried TN. The ketogenic diet inhibits epileptogenesis in EL mice: a genetic model for idiopathic epilepsy. Epilepsia. 2000;41(8):933-940. [DOI] [PubMed] [Google Scholar]
- 23.Hartman AL, Rubenstein JE, Kossoff EH. Intermittent fasting: a “new” historical strategy for controlling seizures? Epilepsy Res. 2013;104(3):275-279. [DOI] [PMC free article] [PubMed] [Google Scholar]
- 24.Mifflin MD, St Jeor ST, Hill LA, Scott BJ, Daugherty SA, Koh YO. A new predictive equation for resting energy expenditure in healthy individuals. Am J Clin Nutr. 1990;51(2):241-247. [DOI] [PubMed] [Google Scholar]
- 25.Thompson FE, Byers T. Dietary assessment resource manual. J Nutr. 1994;124(11 suppl):2245S–2317S. [DOI] [PubMed] [Google Scholar]
- 26.Cervenka MC, Henry BJ, Felton EA, Patton K, Kossoff EH. Establishing an adult epilepsy diet center: experience, efficacy and challenges. Epilepsy Behav. 2016;58:61-68. [DOI] [PubMed] [Google Scholar]
- 27.Berrington A, Schreck KC, Barron BJ, et al. Cerebral ketones detected by 3T MR spectroscopy in patients with high-grade glioma on an Atkins-based diet. AJNR Am J Neuroradiol. 2019;40(11):1908-1915. [DOI] [PMC free article] [PubMed] [Google Scholar]
- 28.Provencher SW. Estimation of metabolite concentrations from localized in vivo proton NMR spectra. Magn Reson Med. 1993;30(6):672-679. [DOI] [PubMed] [Google Scholar]
- 29.Wenger KJ, Wagner M, Harter PN, et al. Maintenance of energy homeostasis during calorically restricted ketogenic diet and fasting-MR: spectroscopic insights from the ERGO2 trial. Cancers. 2020;12(12):1908. [DOI] [PMC free article] [PubMed] [Google Scholar]
- 30.Kyle UG, Genton L, Pichard C. Low phase angle determined by bioelectrical impedance analysis is associated with malnutrition and nutritional risk at hospital admission. Clin Nutr. 2013;32(2):294-299. [DOI] [PubMed] [Google Scholar]
- 31.Schulz KH, Patra S, Spielmann H, Klapdor S, Schlüter K, van Eckert S. Physical condition, nutritional status, fatigue, and quality of life in oncological out-patients. SAGE Open Med. 2017;5:2050312117743674. [DOI] [PMC free article] [PubMed] [Google Scholar]
- 32.Schreck KC, Lwin M, Strowd RE, Henry-Barron BJ, Blakeley JO, Cervenka MC. Effect of ketogenic diets on leukocyte counts in patients with epilepsy. Nutr Neurosci. 2019;22(7):522-527. [DOI] [PubMed] [Google Scholar]
- 33.Forsythe CE, Phinney SD, Fernandez ML, et al. Comparison of low fat and low carbohydrate diets on circulating fatty acid composition and markers of inflammation. Lipids. 2008;43(1):65-77. [DOI] [PubMed] [Google Scholar]
- 34.Cervenka MC, Patton K, Eloyan A, Henry B, Kossoff EH. The impact of the modified Atkins diet on lipid profiles in adults with epilepsy. Nutr Neurosci. 2016;19(3):131-137. [DOI] [PubMed] [Google Scholar]
- 35.Rock JP, Hearshen D, Scarpace L, et al. Correlations between magnetic resonance spectroscopy and image-guided histopathology, with special attention to radiation necrosis. Neurosurgery. 2002;51(4):912-920. [DOI] [PubMed] [Google Scholar]
- 36.Horská A, Barker PB. Imaging of brain tumors: MR spectroscopy and metabolic imaging. Neuroimaging Clin N Am. 2010;20(3):293-310. [DOI] [PMC free article] [PubMed] [Google Scholar]
- 37.Grossman SA, Romo CG, Rudek MA, et al. . Baseline requirements for novel agents being considered for phase II/III brain cancer efficacy trials: conclusions from the Adult Brain Tumor Consortium's first workshop on CNS drug delivery. Neuro Oncol. 2020;22(10):1422-1424. [DOI] [PMC free article] [PubMed] [Google Scholar]
- 38.Parker SJ, Metallo CM. Metabolic consequences of oncogenic IDH mutations. Pharmacol Ther. 2015;152:54-62. [DOI] [PMC free article] [PubMed] [Google Scholar]
- 39.Fack F, Tardito S, Hochart G, et al. Altered metabolic landscape in IDH-mutant gliomas affects phospholipid, energy, and oxidative stress pathways. EMBO Mol Med. 2017;9(12):1681-1695. [DOI] [PMC free article] [PubMed] [Google Scholar]
- 40.Garrett M, Sperry J, Braas D, et al. Metabolic characterization of isocitrate dehydrogenase (IDH) mutant and IDH wildtype gliomaspheres uncovers cell type-specific vulnerabilities. Cancer Metab. 2018;6(1):4. [DOI] [PMC free article] [PubMed] [Google Scholar]
Associated Data
This section collects any data citations, data availability statements, or supplementary materials included in this article.
Data Availability Statement
Anonymized data will be shared on request from any qualified investigator.