Abstract
The present study was designed to identify social support classes across time among midlife (40–64 years) and older (65+ years) gay, bisexual, and other men who have sex with men (MSM), and whether social support protects against depressive symptoms in this population. This study applied longitudinal latent class analysis across five visits on 1,329 individuals age 40 or older at baseline using data from the Multicenter AIDS Cohort Study (MACS) Healthy Aging substudy collected from April 2016 to October 2018. We identified four classes of social support across time: Partner-centered, that is, high levels of support from one’s primary partner(s) and moderate support from friends and family; Friend-centered, that is, high levels of support from friends and chosen family; Low, that is, low levels of support from all sources; and Robust, that is, high levels of support from all sources. We found differences in class membership by age, race/ethnicity, employment status, sexual identity, education, relationship status, and HIV status. Finally, compared to MSM in the low support class, men in the other classes had lower odds of depressive symptoms at the final visit. The most common type of social support was partner-centered, while the least common type was robust. These findings suggest that the presence of any social support, regardless of the source, protects against depressive symptoms.
Keywords: MSM, HIV/AIDS, social support, depression, mental health
The need to address healthy aging of gay, bisexual, and other men who have sex with men (MSM) within the context of public health research is becoming increasingly important as the population size of midlife (40–64) and older (65+) sexual minority adults in the United States continues to increase. By 2030, approximately two million older adults will be sexual minority men.1 This population may be especially vulnerable to challenges associated with aging, including depression.2 Compared to their heterosexual counterparts, sexual minority older adults experience disproportionate rates of poor mental health and depression,3,4 and are at risk of depressive symptoms worsening over time.5 The high rates of depression among MSM have important implications for HIV research. Depression has been consistently associated with increased sexual risk behavior in MSM living with and without HIV.6 For MSM living with HIV, depression and other psychosocial conditions are associated with higher viral loads and decreased adherence to antiretroviral therapy (ART).7–9
Recent studies have described associations between psychosocial factors that protect versus exacerbate depressive symptoms in MSM. Contributing to the risk of depression among midlife and older MSM are experiences of historical and current discrimination, victimization, and stigma,10–12 HIV-related bereavements,10 social isolation,13–15 and decreases in social network size.16,17 On the other hand, social support has emerged as a key factor that promotes healthy aging among sexual minority older adults: greater social support protects against poor general health, mental health, disability, and loneliness.13,16,18,19
Despite considerable evidence that social support offers a pathway to healthy aging, few studies have explicitly focused on the composition and function of social support networks of midlife and older MSM. This omission is critical. These networks may be structured and function differently compared to their heterosexual peers. Most notably, because of rejection from their families of origin, some gay and bisexual men form “chosen families”—fictive kinship networks with other members of sexual minority communities—and strongly rely upon chosen families for support.20 In contrast to findings in the general population, close friends rather than family members most commonly comprise social support network of older gay men21; and social support from friends rather than family appears to protect against poor mental health.19,22,23
Prior studies of social support among sexual minority older adults had limitations: social support was assessed using one- to four-item measures that did not differentiate the source of support or fully quantify the magnitude of support received from each source.18,24 Furthermore, no studies have used longitudinal data to investigate how social support changes over time. It remains unknown what are the most common forms of social support in MSM and whether the degree and type of social support protect against depression.
One way to investigate these questions is to use an analytic approach such as longitudinal latent class analysis (LLCA). LLCA allows for the estimation of subgroups of MSM who differ on multiple indicators of social support types over time.25,26 LLCA can subsequently be combined with traditional analytic techniques (e.g., regression) to examine associations between latent classes and other variables.27 Therefore, this study used LLCA across a three-year period to (i) identify latent classes of social support among midlife and older MSM; (ii) examine demographic predictors of the latent classes; and (iii) prospectively examine the association between social support latent classes and depression. We hypothesized that multiple distinct classes would emerge characterized by different levels of support from different sources (e.g., high support from friends but low support from other sources) over time. We also hypothesized that older age, low income, unemployment, retirement, low education, and living with HIV would be predictors of membership in the class with fewest social ties and least amount of social support. Finally, we hypothesized that classes characterized by low social support would be associated with depressive symptoms.
METHODS
Design and Study Sample
We used data from the Healthy Aging Study, a substudy of the Multicenter AIDS Cohort Study (MACS). The MACS is a 35-year ongoing prospective study of gay and bisexual men living with and without HIV that aims to examine the natural history of HIV infection in the United States. The study design of the MACS has been described elsewhere.28 Briefly, all study procedures were first approved by the Institutional Review Board at the University of Pittsburgh and subsequently at each of the local study sites. Informed consent was obtained from all participants at the beginning of each study visit. The Healthy Aging Study collected data from 1,329 individuals age 40 years or older at visits 65 to 69 from April 2016 to October 2018.
Measures
Indicators of Social Support.
The measure of social support consisted of eight items, prompted by: “Thinking about the last 6 months, how much support did you get from the following people? (By support we mean things like: loaning you money, help out when you’re sick, run errands for you, provide transportation for you, help with any other task that you can’t complete on your own, or by taking the time to really listen to you to help you deal with a problem).” The survey asked about the following sources of support: primary partner(s), biological family, created family, friends, acquaintances, people in your church, coworkers, and other. Participants were asked to rate the level of support from each source: not at all, very little, somewhat, quite a bit, a great deal, prefer not to say. Each variable was treated continuously with a range from “not at all” (1) to “a great deal” (5). We coded “prefer not to say” as missing. Visits 67 to 69 included “not applicable” as a response option, which we recoded to 1 to indicate that the participants did not receive support from this source.
Outcomes.
The primary outcome variable was depressive symptoms at visit 69. We assessed this variable using the Center for Epidemiologic Studies Depression Scale (CES-D-20), comprised of 20 questions that screen for past-week depressive symptomatology. Possible scores range from 0 to 60, with higher numbers indicating greater symptomatology.29 We treated this variable dichotomously using the conventional cutoff point for the CES-D-20, where scores of 0 to 15 indicate no depression and scores of 16 or higher indicate “probable” cases of clinical depression.26
Background Characteristics.
Demographic characteristics were age (65 years or over, younger than 65), HIV status (seropositive, seronegative), education (high school or less, some college or more), employment (employed full-time or part-time, unemployed [i.e., unemployed, a student, or unable to work due to disability] or retired), and relationship status (partnered or married, single). We categorized race/ethnicity into White, Black, or other (i.e., American Indian/Alaska native, Hispanic/Latino, Asian, multiple races, or other). To assess sexual identity participants were asked, “How do you currently identify?” with response options of gay, bisexual, heterosexual/straight, other (please specify), unsure/don’t know, or prefer not to say. Due to the large proportion of gay-identified participants, we dichotomized sexual identity into gay, homosexual, same-gender-loving (henceforth referred to as “gay”) or other (e.g., bisexual, queer). Finally, we did not include gender in the analysis because there was no variability among participants. After removing three individuals who identified as trans-feminine due to the small sample size, all remaining participants identified as men.
Statistical Analysis
To identify social support classes among midlife and older MSM, we applied LLCA with the automatic three-step procedure utilizing Mplus version 7.2 (Muthén & Muthén, Los Angeles, CA, USA). First, we estimated the unconditional model (i.e., no covariates) with continuous indicator variables for each type of support (e.g., primary partner, chosen family, etc.) at each visit. A series of LLCA models specifying one to 7 longitudinal latent classes were tested. To determine the best-fitting number of classes, we examined several model-fit criteria including the Bayesian information criterion (BIC), sample size-adjusted BIC (SSA-BIC), Akaike information criterion (AIC), Bayes factor (BF), correct model probability (cmP), Vuong-Lo-Mendell-Rubin likelihood ratio test (VLMR LRT), average posterior class probability (AvePP), and the odds of correct classification ratio (OCC). We also considered the substantive interpretation of solutions.30
Next, we examined the associations between demographics and the previously identified social support classes. Using multinomial logistic regression models with the social support classes as dependent variables, the covariates were treated as auxiliary variables using the R3STEP option, which accounts for uncertainty in class assignment while maintaining the initial class structure.26 Lastly, we used Stata version 15.0 (StataCorp, College Station, TX, USA) to conduct a series of logistic regression analyses to assess the relationship between the participants’ most likely social support class and depression at Visit 69. In model 1, we assessed the bivariate relationship between social support class and depression at visit 69. In model 2, we adjusted for background characteristic variables. In model 3, we adjusted for background characteristics and HIV status.
RESULTS
Baseline characteristics for the sample (N = 1,329) are presented in Table 1. At visit 65, men included in this analysis had a mean age of 60.2; 30% of the men were age 65 or older. The men were predominately gay (91.7%), White (71.6%), employed (61.8%), and had attended some college or more (85.2%). Approximately 20% of the sample was Black and 9.2% were another or multiple races. Approximately half (49.5%) of participants were married or partnered. Nearly one-quarter (22.5%) of participants were retired, whereas 15.8% were unemployed, a student, or on unable to work due to disability. Nearly half (49.6%) of the sample was living with HIV.
TABLE 1.
Baseline Characteristics of Midlife and Older MSM in the MACS, N = 1,329
| n (%) | |
|---|---|
|
| |
| Age Cohort | |
| Midlife (40–64 years) | 898 (70.2) |
| Older (65+ years) | 381 (29.8) |
| Sexual identity | |
| Gay | 1,219 (91.7) |
| Othera | 110 (8.3) |
| Race | |
| Black | 255 (19.2) |
| White | 952 (71.6) |
| Otherb | 122 (9.2) |
| Employment | |
| Employed | 687 (61.8) |
| Unemployedc | 175 (15.8) |
| Retired | 250 (22.5) |
| Education | |
| High school or less | 190 (14.8) |
| Some college or more | 1,093 (85.2) |
| Relationship Status | |
| Married or partnered | 615 (49.5) |
| Single | 627 (50.5) |
| HIV status | |
| Positive | 636 (49.6) |
| Negative | 647 (50.4) |
| Depression | |
| Yes | 248 (22.0) |
| No | 881 (78.0) |
Bisexual, queer, pansexual, heterosexual.
American Indian/Alaska native, Hispanic/Latino, Asian, multiple races, or other.
Unemployed, students, or unable to work due to disability.
Abbreviations: MACS = Multicenter AIDS Cohort Study; MSM = men who have sex with men.
Descriptions of Social Support Classes
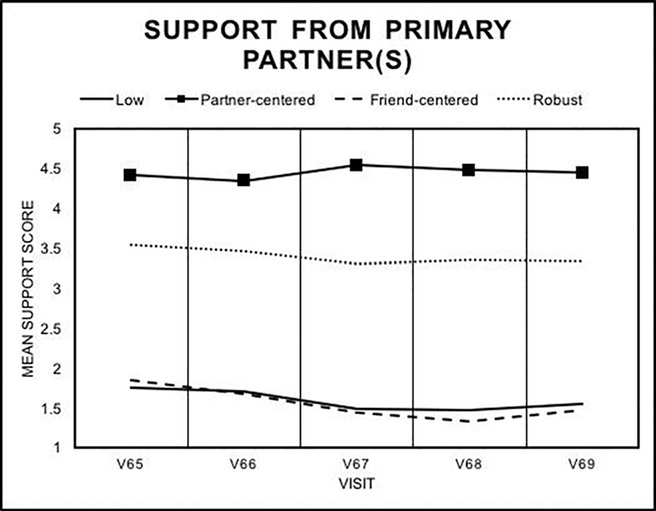
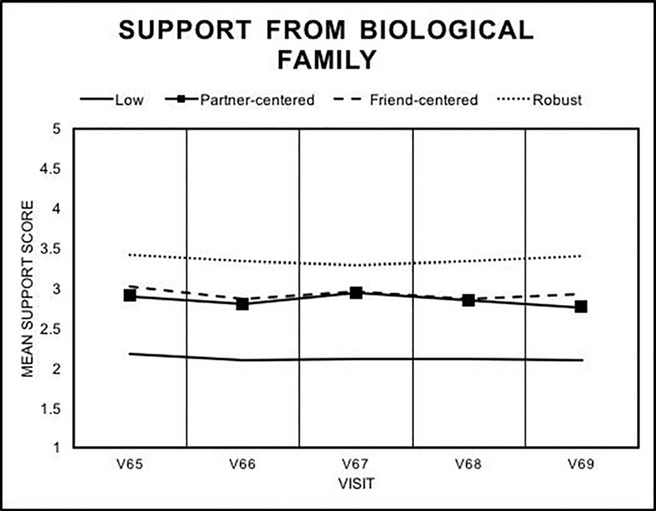
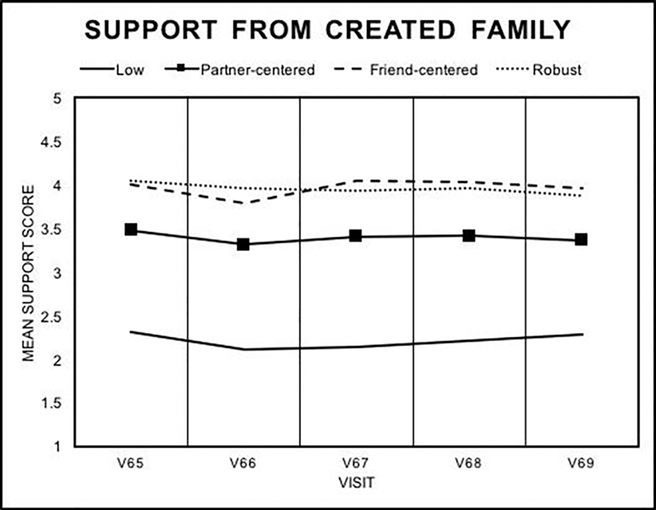
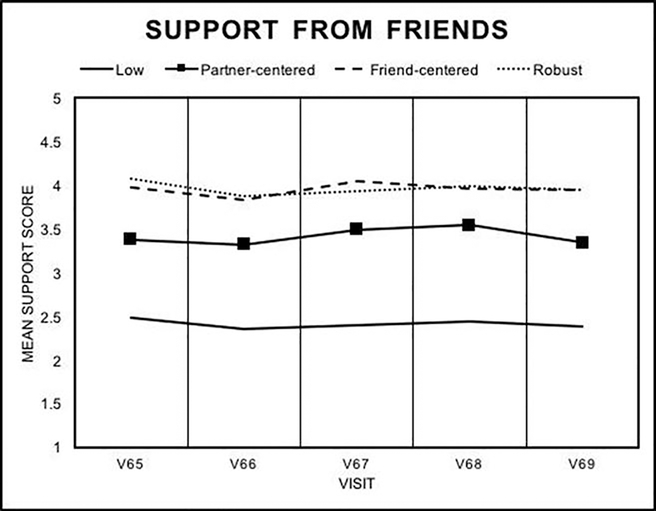
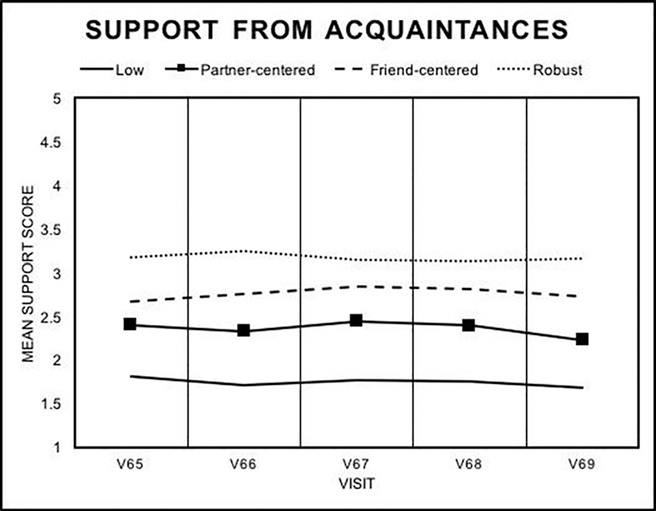
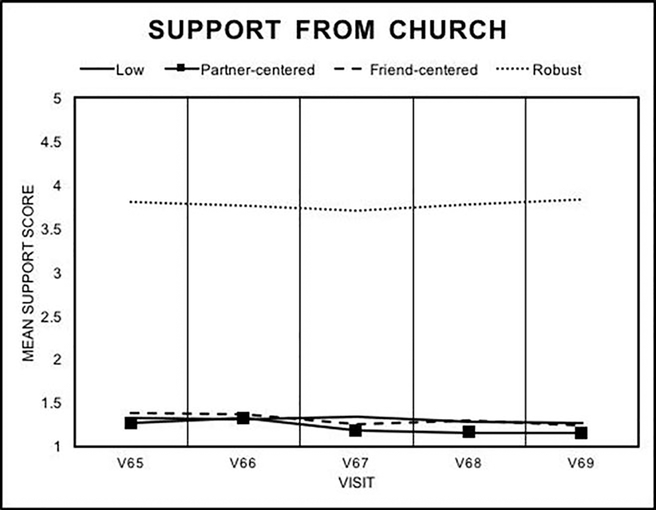
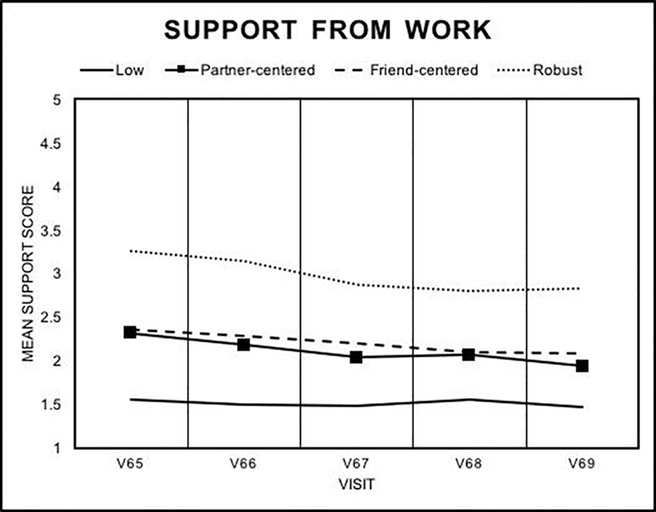
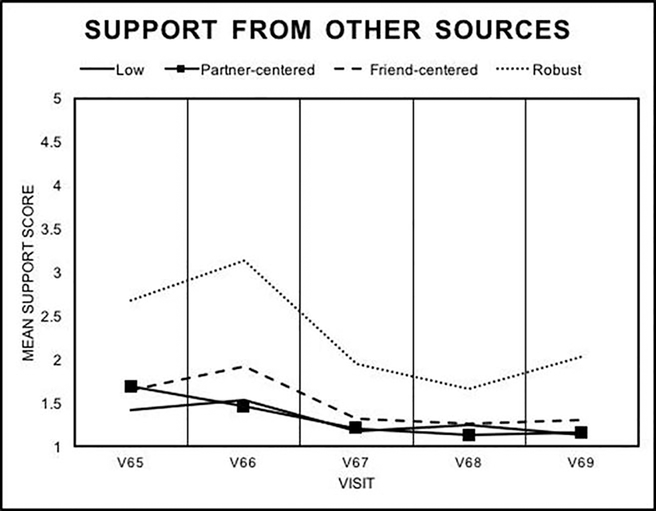
According to fit statistics for LLCA solutions (Table 2), the AIC and BIC continued to decrease as the number of classes increased, favoring the 7-class solution. The VLMR LRT was significant for the 2- and 3-class models, indicating a better fit compared to the 1- and 2-class models, respectively, and was significant when comparing the 4-class model to the 3-class model. The AvePP were greater than 0.7 and the OCC were greater than 0.5 for all solutions (data not shown). We selected the 4-class solution due to fit statistics and interpretability. Figures 1–8 show the class-specific profile plots, depicting the mean support scores on all indicator variables for each class.
TABLE 2.
Class Enumeration Fit Indices and Qualities for Longitudinal Latent Class Analyses
| Classes | Free Parameters | Log-Likelihood | AIC | BIC | SSA-BIC | Entropy | BF | cmP | AWE | VLMR LRT p-value |
|---|---|---|---|---|---|---|---|---|---|---|
|
| ||||||||||
| 1 | 80 | −61,818 | 123,795 | 124,210 | 123,956 | n/a | <1 | 0.00 | 125,019 | n/a |
| 2 | 121 | −58,864 | 117,970 | 118,597 | 118,213 | 0.876 | <1 | 0.00 | 119,821 | 0.044 |
| 3 | 162 | −57,155 | 114,634 | 115,473 | 114,959 | 0.910 | <1 | 0.00 | 117,112 | 0.032 |
| 4 | 203 | −56,383 | 113,171 | 114,223 | 113,578 | 0.929 | <1 | 0.00 | 116,277 | 0.034 |
| 5 | 244 | −55,546 | 111,580 | 112,844 | 112,069 | 0.918 | <1 | 0.00 | 115,313 | 0.230 |
| 6 | 285 | −54,931 | 110,433 | 111,909 | 111,004 | 0.925 | <1 | 0.00 | 114,793 | 0.394 |
| 7 | 326 | −54,621 | 109,895 | 111,584 | 110,548 | 0.916 | n/a | 1.00 | 114,882 | 0.242 |
Note. Boldface indicates the model we selected. Models were estimated with a sample of 1,120 participants.
Abbreviations: AIC = Akaike information criterion; AWE = Approximate weight of evidence criterion; BF = Bayes factor; BIC = Bayesian information criterion; cmP = correct model probability; df = degrees of freedom; n/a = not applicable; VLMR LRT = Vuong-Lo-Mendell-Rubin likelihood ratio test.
The likelihood ratio χ2 goodness-of-fit tests could not be computed in Mplus because the latent class indicator model was too large.
Class 1 (28%) was labeled “low support.” Low levels of support were found across all sources of support and time points. Class 2 (35%) was labeled “partner-centered support.” This class was characterized by “quite a bit” to “a great deal” of support from one’s partner(s). Individuals in this class “somewhat” received support from friends, biological family, and created family, but displayed low levels of support from acquaintances, church, work, or other sources. The mean scores of support were relatively stable across time; however, mean scores from work and other sources decreased slightly from visit 65 to visit 69.
Class 3 (20%) was labeled “friend-centered support.” Mean scores indicated that these individuals received “quite a bit” of support from friends and created family, “somewhat” received support from biological family and acquaintances, but received “none” to “very little” support from partner(s), church, work, and other sources of support. Mean scores of support were relatively stable across time; however, scores from partner(s), work, and other sources decreased slightly from visit 65 to visit 69.
Finally, Class 4 (17%) was labeled “robust support.” Individuals in this class received “quite a bit” of support from partner(s), biological and created family, friends, and church. Mean scores also indicated that acquaintances and work provided “some” support. Across these sources of support, the mean scores of support were stable across time. However, “other” support was inconsistent: individuals in this class indicated “some” support from other sources at visits 65 and 66, but “very little” support at the final three visits.
Associations Between Demographic Characteristics and Social Support Class Memberships
Tables 3 and 4 present the bivariate and adjusted associations of demographic variables and social support classes, respectively. Older MSM had higher odds than younger MSM of being the in the “robust support” compared to the “low support” class (adjusted odds ratio [aOR]: 1.84, 95% confidence interval [CI]: 1.03, 3.30). Gay-identified MSM had higher odds than all other MSM of being in the “partner-centered support” compared to the “low support” class (aOR: 3.86, 95% CI: 1.39, 10.69). Black MSM had higher odds of being in the “robust support” compared to the “low support” class than White MSM (aOR: 3.74, 95% CI: 2.13, 6.58). MSM categorized as “other” race had higher odds than white MSM of being in the “robust support” compared to the “low support” class (aOR: 4.84, 95% CI: 2.16, 10.85) and being in the “partner-centered support” class compared to the “low support” class (aOR: 2.85, 95% CI: 1.06, 7.67).
TABLE 3.
Bivariate Sociodemographic Characteristics of Longitudinal Latent Classes of Social Support
| Class 1 (Low) | Class 2 (Partner-Centered) | Class 3 (Friend-Centered) | Class 4 (Robust) | p Value | |
|---|---|---|---|---|---|
|
| |||||
| n (%) | n (%) | n (%) | n (%) | ||
|
| |||||
| Age cohort | |||||
| Midlife (40–64 years) | 243 (27.1) | 330 (36.8) | 175 (19.5) | 148 (16.5) | .107 |
| Older (65+ years) | 113 (29.9) | 112 (29.6) | 83 (21.9) | 70 (18.5) | |
| Sexual identity | |||||
| Gay | 326 (27.1) | 438 (36.4) | 250 (20.8) | 191 (15.9) | <.001 |
| Othera | 44 (40.0) | 20 (18.2) | 14 (12.7) | 32 (29.1) | |
| Race | |||||
| Black | 84 (32.9) | 42 (16.5) | 50 (19.6) | 79 (30.9) | <.001 |
| White | 259 (27.6) | 370 (39.4) | 194 (20.7) | 116 (12.4) | |
| Otherb | 27 (22.3) | 46 (30.0) | 20 (16.5) | 28 (23.1) | |
| Employment | |||||
| Employed | 223 (25.0) | 345 (36.7) | 179 (20.1) | 145 (16.3) | <.001 |
| Unemployedc | 75 (43.1) | 32 (18.4) | 33 (18.9) | 34 (19.5) | |
| Retired | 72 (28.9) | 81 (32.5) | 52 (20.9) | 44 (17.7) | |
| Education | |||||
| High school or less | 54 (28.7) | 44 (23.4) | 31 (16.5) | 59 (31.4) | <.001 |
| Some college or more | 303 (27.9) | 398 (36.6) | 227 (20.9) | 160 (14.7) | |
| Relationship Status | |||||
| Married or partnered | 63 (10.2) | 417 (67.8) | 33 (5.4) | 102 (16.6) | <.001 |
| Single | 286 (45.6) | 21 (3.4) | 218 (34.8) | 102 (16.3) | |
| HIV status | |||||
| Positive | 194 (30.7) | 199 (31.5) | 137 (21.7) | 102 (16.1) | .030 |
| Negative | 163 (25.3) | 243 (37.7) | 121 (18.8) | 117 (18.2) | |
Bisexual, queer, pansexual, heterosexual.
American Indian/Alaska native, Hispanic/Latino, Asian, multiple races, or other.
Unemployed, students, or unable to work due to disability.
Note. Boldface indicates statistical significance at p < .05.
TABLE 4.
Results of Multinomial Logistic Regression Models Predicting Social Support Class Membership
| Partnered-Centered versus Low | Friend-Centered versus Low | Robust versus Low | ||||
|---|---|---|---|---|---|---|
|
| ||||||
| aOR (95% CI) | p Value | aOR (95% CI) | p Value | aOR (95% CI) | p Value | |
|
| ||||||
| Older (65+ years) | 0.88 (0.48, 1.60) | .665 | 0.77 (0.45, 1.31) | .337 | 1.84 (1.03, 3.30) | .041 |
| Gay | 3.86 (1.39, 10.69) | .009 | 1.82 (0.75, 4.44) | .189 | 1.69 (0.81, 3.55) | .163 |
| Race | ||||||
| White | Reference | Reference | Reference | |||
| Black | 0.56 (0.27, 1.15) | .112 | 0.96 (0.56, 1.67) | .897 | 3.74 (2.13, 6.58) | <.001 |
| Othera | 2.85 (1.06,7.67) | .038 | 1.02 (0.46, 2.27) | .966 | 4.84 (2.16, 10.85) | <.001 |
| Employment | ||||||
| Employed | Reference | Reference | Reference | |||
| Retired | 1.09 (0.57, 2.09) | .790 | 0.85 (0.49, 1.47) | .554 | 0.81(0.44, 1.50) | .495 |
| Unemployedb | 0.57 (0.27, 1.22) | .149 | 0.49 (0.27, 0.89) | .019 | 0.62 (0.33, 1.17) | .139 |
| High school or less | 1.25 (0.60, 2.58) | .550 | 0.85 (0.46, 1.58) | .611 | 2.52 (1.42,4.47) | .002 |
| Single | 0.004 (0.001, 0.014) | <.001 | 1.74 (0.91, 3.35) | .096 | 0.18 (0.11, 0.30) | <.001 |
| HIV-negative | 1.03 (0.62, 1.72) | .902 | 0.95 (0.63, 1.43) | .808 | 1.72 (1.10, 2.70) | .019 |
American Indian/Alaska native, Hispanic/Latino, Asian, multiple races, or other.
Unemployed, students, or unable to work due to disability.
Note. Boldface indicates statistical significance at p < .05.
Abbreviations: aOR = adjusted odds ratio; CI = confidence interval.
MSM who were unemployed versus employed had lower odds of belonging to the “friends-centered support” compared to the “low support” class (aOR: 0.49, 95% CI: 0.27, 0.89). MSM with a high school degree or less compared to those with some college or more had higher odds of belonging to the “robust support” compared to the “low support” class (aOR: 2.52, 95% CI: 1.42, 4.47). MSM who were married or partnered had higher odds compared to those who were single of belonging to the “partner-centered support” class versus the “low support” class (aOR: 255.19, 95% CI: 72.36, 899.89) and the “robust support” class versus the “low support” class (aOR: 5.45, 95% CI: 3.31, 8.99). Finally, MSM living without HIV compared to MSM living with HIV had higher odds of being in the “robust support” versus the “low support” class (aOR: 1.72, 95% CI: 1.10, 2.70).
Associations of Social Support Class Membership and Depression
Table 5 presents the bivariate and adjusted associations of social support classes and depression at visit 69. MSM in the “partner-centered,” “friend-centered,” and “robust” compared to those in the “low” support classes had lower odds of depressions (aORs range from 0.48 to 0.64). After adjusting for sociodemographic variables and HIV status into the model, social support class remained significantly associated with depression.
TABLE 5.
Results of Multivariable Logistic Regression Models Predicting Depression from Longitudinal Latent Class Membership
| Model 1 | Model 2 | Model 3 | ||||
|---|---|---|---|---|---|---|
|
| ||||||
| OR (95% CI) | p Value | aOR (95% CI) | p Value | aOR (95% CI) | p Value | |
|
| ||||||
| Longitudinal latent class | ||||||
| Low | Reference | Reference | Reference | |||
| Partner-centered | 0.51 (0.37, 0.71) | <.001 | 0.48 (0.29, 0.80) | .005 | 0.48 (0.29, 0.80) | .005 |
| Friend-centered | 0.48 (0.33, 0.71) | <.001 | 0.51 (0.32, 0.80) | .003 | 0.51 (0.32, 0.80) | .003 |
| Robust | 0.64 (0.44, 0.95) | .025 | 0.57 (0.35, 0.92) | .022 | 0.57 (0.35, 0.92) | .022 |
| Older (65+ years) | 1.04 (0.68, 1.59) | .854 | 1.04 (0.68, 1.59) | .854 | ||
| Gay | 0.74 (0.27, 2.05) | .277 | 0.74 (0.27, 2.05) | .277 | ||
| Race | ||||||
| White | Reference | Reference | ||||
| Black | 1.22 (0.80, 1.88) | .365 | 1.22 (0.79, 1.88) | .365 | ||
| Othera | 1.45 (0.86, 2.44) | .169 | 1.44 (0.85, 2.45) | .169 | ||
| Employment | ||||||
| Employed | Reference | Reference | ||||
| Retired | 0.71 (0.44, 1.15) | .161 | 0.71 (0.44, 1.15) | .161 | ||
| Unemployedb | 2.17 (1.44, 3.28) | <.001 | 2.16 (1.42, 3.29) | <.001 | ||
| High school or less | 1.68 (1.10, 2.57) | .016 | 1.68 (1.10, 2.57) | .016 | ||
| Single | 0.83 (0.54, 1.28) | .400 | 0.83 (0.54, 1.28) | .400 | ||
| HIV-negative | 0.98 (0.70, 1.37) | .923 | ||||
American Indian/Alaska native, Hispanic/Latino, Asian, multiple races, or other.
Unemployed, students, or unable to work due to disability.
Note. Boldface indicates statistical significance at p < .05.
Abbreviations: aOR = adjusted odds ratio; CI = confidence interval; OR = odds ratio..
DISCUSSION
This study identified that midlife and older MSM exhibit four distinct patterns of social support, ordered from most to least common: “partner-centered support” (35%), “low support” (28%), “friend-centered support” (20%), and “robust support” (17%). Members of these classes differed in the quantity of support received across time from various sources of support including primary partner(s), biological family, chosen family, friends, acquaintances, church, work, or other sources. Members of these classes also differed in age, race, employment status, education, sexual identity, relationship status, and HIV status. Furthermore, this study demonstrates that provided social support was present, it appeared to have a protective effect against depressive symptoms in MSM, regardless of whether that support predominately emerged from a partner, friends, or a broad spectrum of people.
The largest class was the “partner-centered support” class which included 35% of the sample, followed by the “low support” class which included 28% of the sample, and the “friend-centered support” class which included 20% of the sample. Finally, 17% of MSM belonged to the “robust support” class. These findings support research showing that older gay men commonly receive support from friends, while some MSM receive support from a variety of sources, including chosen and biological families and larger community.21,31 In this study MSM received the highest support from partners, but prior studies found that gay men most commonly receive support from friends, 21,32 These studies found that friends provided support in the form of socializing or acting as activity companions, whereas partners were the most common source of emotional support.21,32 Our question assessing support did not prompt participants to consider socializing as a form of support. The differences in how support is explicitly defined in surveys may influence how participants conceptualize the construct.
We found that compared to White MSM, Black MSM and MSM of other races had higher odds of belonging to the “robust support” group relative to the “low support” group. Little is known about social support networks among older racial/ethnic minority MSM. In the general population, faith-based communities are important sources of support for older adults, particularly those in racial/ethnic minority communities.33 These factors may explain the higher proportion of racial/ethnic minority MSM in the “robust support” class; however, this research may not be relevant to the experiences of nonheterosexual men.34
Finally, MSM who were single or unemployed had higher odds of belonging to the “low support” class. Job loss can directly affect the availability of social support through loss of coworkers, changes in stress, or changes in one’s financial situation.35 In one study of sexual minority older adults, participants cited ageism as a barrier to re-gaining employment following job loss.36 In the same study, over half of participants did not have place to socialize, citing ageism as a deterrent to attending LGB-affirming events and spaces.36 Thus, increasing opportunities for socialization and employment counseling may provide much needed support for this vulnerable population.
The Healthy Aging study is a substudy of the MACS that collected data over a three-year period only. While the use of longitudinal data allowed us to examine how social support changes over time, a period of three years is too short to fully understand the dynamics of social support in midlife and older adulthood. The social support variable was not assessed at any other time points in the MACS; however, it is possible that a lagged effect of social support class on depression may emerge when considering time periods greater than five years. Similarly, levels of social support were relatively static over three years, but additional time points are needed to investigate the broader stability of social support over time. Future research could explore other factors (e.g., personality traits) that may explain this stability over time.
Second, although we compared our results to several other studies that used samples of sexual minority older adults, our sample included MSM only. Given that gay and bisexual men have less social support than lesbian and bisexual women,13 the differences that emerged between studies may indicate that social support functions differently, on average, for sexual minority men and women. Finally, the Healthy Aging Study did not assess actual or perceived need for social support. It is possible that the “low support” class included individuals who both need and didn’t need support. Similarly, the “robust support” class may have included individual who have a greater demand for support. Nevertheless, our study results demonstrate that, on average, being in the “low support” group was associated with depression regardless of whether those individuals did or did not need the support. An important area for future study would be to identify whether the associated between low social support and depression differs depending on the need for support.
This study also did not examine potential bidirectional effects of social support class and depression over time, as our aims and hypotheses were specifically defined as prospectively forward. Furthermore, the analytic technique used to answer the primary research question cannot be used to robustly disentangle whether the social support class caused depressive symptoms to emerge, or whether depressive symptoms affected one’s social support class. Future research can use longitudinal structural equation modeling or variants of mixed models to examine bidirectional relationships between these two variables.
CONCLUSIONS
MSM exhibit several distinct patterns of social support. A substantial proportion (28%) of MSM had low social support and were at greater risk of developing depressive symptoms. Additional efforts are needed to investigate the social needs of MSM with low social support as they enter older adulthood. Furthermore, future research should examine how to increase social support among MSM to subsequently decrease the mental health burden in this population.
Statement of Public Health Significance:
In this study, midlife and older MSM most commonly received the highest degree of social support from partners. However, the presence of any social support, regardless of the source, protected against depressive symptoms. Encouraging social support may help to decrease the mental health burden in this population.
Acknowledgments.
The authors are indebted to the participants of the Multicenter AIDS Cohort Study (MACS) Healthy Aging Study. The authors thank the staff at the four sites for implementation support and Montserrat Tarrago and Kate McGown for administrative support of this study.
Funding.
This study is funded by the National Institute for Minority Health Disparities (grant R01 MD010680 Plankey & Friedman). Additional data used in this manuscript were collected by the MACS/WIHS Combined Cohort Study (MWCCS): Baltimore/DC (Brown & Margolick), U01-HL146201-01; Data Analysis and Coordination Center (D’Souza, Gange & Golub), U01-HL146193-01; Chicago-Northwestern CRS (Wolinsky), U01-HL146240-01; Los Angeles CRS (Detels), U01-HL146333-01; Pittsburgh CRS (Martinson & Rinaldo), U01-HL146208-01; The MWCCS is funded primarily by the National Heart, Lung, and Blood Institute (NHLBI), with additional co-funding from the Eunice Kennedy Shriver National Institute Of Child Health & Human Development (NICHD), National Human Genome Research Institute (NHGRI), National Institute On Aging (NIA), National Institute Of Dental & Craniofacial Research (NIDCR), National Institute Of Allergy And Infectious Diseases (NIAID), National Institute Of Neurological Disorders And Stroke (NINDS), National Institute Of Mental Health (NIMH), National Institute On Drug Abuse (NIDA), National Institute Of Nursing Research (NINR), National Cancer Institute (NCI), National Institute on Alcohol Abuse and Alcoholism (NIAAA), National Institute on Deafness and Other Communication Disorders (NIDCD), National Institute of Diabetes and Digestive and Kidney Diseases (NIDDK). The MACS/WIHS Combined Cohort Study website is located at http://www.mwccs.org/. This work was partially supported by the National Institute of Mental Health (T32MH094174 awarded to ERH).
APPENDIX
Figure A1.
Mean levels of support from primary partner(s) over time for each class.
Figure A2.
Mean levels of support from biological family over time for each class.
Figure A3.
Mean levels of support from created family over time for each class.
Figure A4.
Mean levels of support from friends over time for each class.
Figure A5.
Mean levels of support from acquaintances over time for each class.
Figure A6.
Mean levels of support from church over time for each class.
Figure A7.
Mean levels of support from work over time for each class.
Figure A8.
Mean levels of support from other sources over time for each class.
Footnotes
Disclosure. The authors have no relevant financial interest or affiliations with any commercial interests related to the subjects discussed within this article.
REFERENCES
- [1].Grant JM. Outing Age 2010: Public Policy Issues Affecting Gay, Lesbian, Bisexual, and Transgender Elders. National Gay and Lesbian Task Force Policy Institute. https://www.lgbtagingcenter.org/resources/pdfs/OutingAge2010.pdf. Published January 2010. Accessed January 14, 2020. [Google Scholar]
- [2].Institute of Medicine. The Health of Lesbian, Gay, Bisexual, and Transgender People: Building a Foundation for Better Understanding. Washington, DC: The National Academies Press; 2011. [PubMed] [Google Scholar]
- [3].Cochran SD, Mays VM, Sullivan JG. Prevalence of mental disorders, psychological distress, and mental health services use among lesbian, gay, and bisexual adults in the United States. J Consult Clin Psychol. 2003;71(1):53–61. doi: 10.1037/0022-006X.71.1.53. [DOI] [PMC free article] [PubMed] [Google Scholar]
- [4].Fredriksen-Goldsen KI, Kim H, Barkan SE, et al. Health disparities among lesbian, gay, and bisexual older adults: results from a population-based study. Am J Public Health. 2013;103(10):1802–1809. doi: 10.2105/AJPH.2012.301110. [DOI] [PMC free article] [PubMed] [Google Scholar]
- [5].Wight RG, Harig F, Aneshensel CS, Detels R. Depressive symptom trajectories, aging-related stress, and sexual minority stress among midlife and older gay men: linking past and present. Res Aging. 2015;38(4):427–452. doi: 10.1177/0164027515590423. [DOI] [PMC free article] [PubMed] [Google Scholar]
- [6].Stall R, Mills TC, Williamson J, et al. Association of co-occurring psychosocial health problems and increased vulnerability to HIV/AIDS among urban men who have sex with men. Am J Public Health. 2003;93(6):939–942. doi: 10.2105/AJPH.93.6.939. [DOI] [PMC free article] [PubMed] [Google Scholar]
- [7].Uthman OA, Magidson JF, Safren SA, Nachega JB. Depression and adherence to antiretroviral therapy in low-, middle- and high-income countries: a systematic review and meta-analysis. Curr HIV/AIDS Rep. 2014;11(3):291–307. doi: 10.1007/s11904-014-0220-1. [DOI] [PMC free article] [PubMed] [Google Scholar]
- [8].Friedman MR, Coulter RW, Silvestre AJ, et al. Someone to count on: social support as an effect modifier of viral load suppression in a prospective cohort study. AIDS Care. 2017;29(4):469–480. doi: 10.1080/09540121.2016.1211614. [DOI] [PMC free article] [PubMed] [Google Scholar]
- [9].Friedman MR, Stall R, Silvestre AJ, et al. Effects of syndemics on HIV viral load and medication adherence in the multicentre AIDS cohort study. AIDS. 2015;29(9):1087–1096. doi: 10.1097/QAD.0000000000000657. [DOI] [PMC free article] [PubMed] [Google Scholar]
- [10].Wight RG, LeBlanc AJ, de Vries B, Detels R. Stress and mental health among midlife and older gay-identified men. Am J Public Health. 2012;102(3):503–510. doi: 10.2105/AJPH.2011.300384. [DOI] [PMC free article] [PubMed] [Google Scholar]
- [11].Hatzenbuehler ML, Phelan JC, Link BG. Stigma as a fundamental cause of population health inequalities. Am J Public Health. 2013;103(5):813–821. doi: 10.2105/AJPH.2012.301069. [DOI] [PMC free article] [PubMed] [Google Scholar]
- [12].Kimmel D. Lesbian, gay, bisexual, and transgender aging concerns. Clin Gerontologist. 2014;37:49–63. doi: 10.1080/07317115.2014.847310. [DOI] [Google Scholar]
- [13].Fredriksen-Goldsen KI, Emlet CA, Kim H, et al. The physical and mental health of lesbian, gay male, and bisexual (LGB) older adults: the role of key health indicators and risk and protective factors. Gerontologist. 2013;53(4):664–675. doi: 10.1093/geront/gns123. [DOI] [PMC free article] [PubMed] [Google Scholar]
- [14].Wallace SP, Cochran SD, Durazo EM, Ford CL. The health of aging lesbian, gay and bisexual adults in California. Policy Brief UCLA Cent Health Policy Res. 2011;PB2011–2:1–8. [PMC free article] [PubMed] [Google Scholar]
- [15].Lyons A, Pitts M, Grierson J. Growing old as a gay man: psychosocial well-being of a sexual minority. Res Aging. 2012;35(3):275–295. doi: 10.1177/0164027512445055. [DOI] [Google Scholar]
- [16].Fredriksen-Goldsen KI, Kim H, Shiu C, et al. Successful aging among LGBT older adults: physical and mental health-related quality of life by age group. Gerontologist. 2015;55(1):154–168. doi: 10.1093/geront/gnu081. [DOI] [PMC free article] [PubMed] [Google Scholar]
- [17].Monin JK, Mota N, Levy B, et al. Older age associated with mental health resiliency in sexual minority US veterans. Am J Geriatr Psychiatry. 2017;25(1):81–90. doi: 10.1016/j.jagp.2016.09.006. [DOI] [PMC free article] [PubMed] [Google Scholar]
- [18].Emlet CA, Fredriksen-Goldsen KI, Kim H. Risk and protective factors associated with health-related quality of life among older gay and bisexual men living with HIV disease. Gerontologist. 2013;53(6):963–972. doi: 10.1093/geront/gns191. [DOI] [PMC free article] [PubMed] [Google Scholar]
- [19].Lyons A, Pitts M, Grierson J. Factors related to positive mental health in a stigmatized minority: an investigation of older gay men. J Aging Health. 2013;25(7):1159–1181. doi: 10.1177/0898264313495562. [DOI] [PubMed] [Google Scholar]
- [20].Weston K Families We Choose: Lesbians, Gays, Kinship. New York, NY: Columbia University Press; 1991. [Google Scholar]
- [21].Grossman AH, D’Augelli AR, Hershberger SL. Social support networks of lesbian, gay, and bisexual adults 60 years of age and older. J Gerontol B Psychol Sci Soc Sci. 2000;55(3):171–179. doi: 10.1093/geronb/55.3.P171. [DOI] [PubMed] [Google Scholar]
- [22].Masini BE, Barrett HA. Social support as a predictor of psychological and physical well-being and lifestyle in lesbian, gay, and bisexual adults aged 50 and over. J Gay Lesbian Soc Serv. 2008;20(1–2):91–110. doi: 10.1080/10538720802179013. [DOI] [Google Scholar]
- [23].Fiori KL, Jager J. The impact of social support networks on mental and physical health in the transition to older adulthood: a longitudinal, pattern-centered approach. Int J Behav Dev. 2012;36(2):117–129. doi: 10.1177/0165025411424089. [DOI] [Google Scholar]
- [24].Kim HJ, Fredriksen-Goldsen KI, Bryan AEB, Muraco A. Social network types and mental health among LGBT older adults. Gerontologist.. 2017;57(1 Suppl):84–94. doi: 10.1093/geront/gnw169. [DOI] [PMC free article] [PubMed] [Google Scholar]
- [25].Lanza ST, Collins LM. A mixture model of discontinuous development in heavy drinking from ages 18 to 30: the role of college enrollment. J Stud Alcohol Drugs. 2006;67(4):552–561. doi: 10.15288/jsa.2006.67.552. [DOI] [PubMed] [Google Scholar]
- [26].Asparouhov TM, Muthén B. Auxiliary variables in mixture modeling: three-step approaches using Mplus. Struct Equ Modeling. 2014;21(3):329–341. doi: 10.1080/10705511.2014.915181. [DOI] [Google Scholar]
- [27].Murdock TB, Miller A. Teachers as sources of middle school students’ motivational identity: variable-centered and person-centered analytic approaches. Elem Sch J. 2003;103(4):383–399. doi: 10.1086/499732. [DOI] [Google Scholar]
- [28].Dudley J, Jin S, Hoover D, et al. The multicenter AIDS cohort study: retention after 9 ½ years. Am J Epidemiology. 1995;142(3):232–330. doi: 10.1093/oxfordjournals.aje.a117638. [DOI] [PubMed] [Google Scholar]
- [29].Radloff LS. The CES-D scale: a self-report depression scale for research in the general population. Appl Psychol Meas. 1977;1:385–401. doi: 10.1177/014662167700100306. [DOI] [Google Scholar]
- [30].Armstrong NM, Surkan PJ, Treisman GJ, et al. Optimal metrics for identifying long term patterns of depression in older HIV-infected and HIV-uninfected men who have sex with men. Aging Ment Health. 2019;23(4):507–514. doi: 10.1080/13607863.2017.1423037. [DOI] [PMC free article] [PubMed] [Google Scholar]
- [31].de Vries B, Megathlin D. The meaning of friendship for gay men and lesbians in the second half of life. J GLBT Fam Stud. 2009;5(1–2):82–98. doi: 10.1080/15504280802595394. [DOI] [Google Scholar]
- [32].Tester G, Wright ER. Older gay men and their support convoys. J Gerontol B Psychol Sci Soc Sci. 2017;72(3):488–497. [DOI] [PubMed] [Google Scholar]
- [33].Litwin H, Shiovitz-Ezra S. Social network type and subjective well-being in a national sample of older Americans. Gerontologist. 2011;51(3):379–388. doi: 10.1093/geront/gnq094. [DOI] [PMC free article] [PubMed] [Google Scholar]
- [34].Ward EG. Homophobia, hypermasculinity and the US black church. Cult Health Sex. 2005;7(5):493–504. doi: 10.1080/13691050500151248. [DOI] [PubMed] [Google Scholar]
- [35].Atkinson T, Liem R, Liem JH. The social costs of unemployment: Implications for social support. J Health Soc Behav. 1986;27(4):317–331. doi: 10.2307/2136947. [DOI] [PubMed] [Google Scholar]
- [36].Brennan-Ing M, Seidel L, Larson B, Karpiak SE. Social care networks and older LGBT adults: challenges for the future. J Homosex. 2014;61(1):21–52. doi: 10.1080/00918369.2013.835235. [DOI] [PubMed] [Google Scholar]


