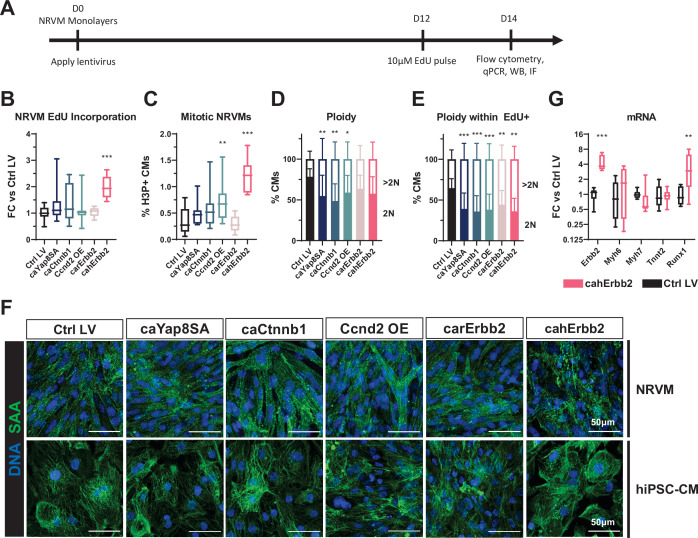
Figure 2. cahErbb2 induces NRVM cycle entry in monolayers and promotes sarcomere disassembly in NRVMs and hiPSC-CMs.
(A) Schematic of experimental design in NRVM monolayers. (B–E) Flow cytometry analysis of mCherry+ NRVMs showing (B) fold-change (FC) in EdU incorporation relative to control LV-treated NRVMs, (C) percentage of H3P+ CMs, and (D, E) percentage of 2N and >2N cells in all CMs (D) and EdU+ CMs (E). (F) Representative immunostaining images of sarcomeric α-actinin showing sarcomeric structure in LV transduced NRVMs and hiPSC-CMs. (G) Relative expression of Erbb2, sarcomeric genes (Myh6, Myh7, and Tnnt2), and dedifferentiation marker Runx1 in cahErbb2-transduced versus control hiPSC-CMs. Data: box and whiskers showing distribution and min to max. Column graphs showing mean+ SD (*p<0.05, **p<0.01, ***p<0.001 vs. Ctrl LV). hiPSC-CM, human-induced pluripotent stem cell-derived cardiomyocyte; LV, lentiviral vector; NRVM, neonatal rat ventricular myocyte.


