

Abstract
Objective:
Current guidelines for elective surgery of ascending thoracic aortic aneurysms (aTAAs) use aneurysm size as primary determinant for risk stratification of adverse events. Biomechanically, dissection may occur when wall stress exceeds wall strength. Determining patient-specific aTAA wall stresses by finite element analysis (FEA) can potentially predict patient-specific risk of dissection. This study compared peak wall stresses in patients with ≥5.0cm vs <5.0cm aTAAs to determine correlation between diameter and wall stress.
Methods:
Patients with aTAA ≥5.0cm (n=47) and <5.0cm (n=53) were studied. Patient-specific aneurysm geometries obtained from ECG-gated computed tomography were meshed and pre-stress geometries determined. Peak wall stresses and stress distributions were determined using LS-DYNA FEA software with user-defined fiber-embedded material models under systolic pressure.
Results:
Peak circumferential stresses at systolic pressure were 530±83kPa for aTAA ≥5.0cm vs. 486±87kPa for aTAA <5.0cm (p=0.07), while peak longitudinal stresses were 331±57kPa vs 310±54kPa (p=0.08), respectively. For aTAA ≥5.0cm, correlation between peak circumferential stresses and size was 0.41, while correlation between peak longitudinal wall stresses and size was 0.33. However, for aTAA <5.0cm, correlation between peak circumferential stresses and size was 0.23, while correlation between peak longitudinal stresses and size was 0.14.
Conclusion:
Peak patient-specific aTAA wall stresses overall were larger for ≥5.0cm than aTAA <5.0cm. While some correlation between size and peak wall stresses was found in aTAA≥5.0cm, poor correlation existed between size and peak wall stresses in aTAA<5.0cm. Patient-specific wall stresses are particularly important in determining patient-specific risk of dissection for aTAA <5.0cm.
Introduction
Dissection or rupture of ascending thoracic aortic aneurysms (aTAAs) is a lethal cardiovascular emergency1, 2. Pre-hospital mortality is 40%, with a 1% per hour mortality thereafter without surgery3. Elective surgical replacement of the ascending aorta is the mainstay of aTAA treatment to prevent acute dissection. Current guidelines for elective aTAA surgical repair are based primarily on aneurysm size, where aTAAs≥5.0cm in diameter are recommended for surgery in the presence of symptoms, growth, or family history of connective tissue disorder or sudden death and ≥5.5cm in the absence of these factors1, 3, 4. Aneurysms below surgical threshold size are subjected to conservative monitoring. Management of these small aneurysm patients is currently challenging. On one hand, rupture/dissection risk of these small aneurysms is low, with annual incidence rate reported of ~2%5. On the other hand, observational data suggests >50% of acute type A dissection patients have aneurysm diameters below the threshold for surgical intervention2, 6. Developing a more accurate predictor of patient-specific risk of dissection is crucial for aTAA patients who do not meet the current criteria for surgical intervention.
From a biomechanics perspective, dissection is a mechanical failure that could occur when aneurysm wall stress exceeds wall strength7, 8. In aortic dissection, separation of the media along the longitudinal direction occurs with one or more intimal tears. Many intimal tears are located in the sinotubular junction (STJ) or ascending aorta (AscAo) and the majority occur along the transverse direction9. The precise mechanism of dissection has yet to be understood—whether the intimal tear occurs before separation of media is unknown. However, in rare cases such as intramural hematoma without an intimal tear10, separation of the medial layer is the initiating event. Regardless of the dynamic process within the dissection, there is role for computational modeling and biomechanics to aid in understanding how aneurysm geometry and material properties affect wall stress which may indicate risk of dissection.
Aneurysm diameter is currently used as a surrogate for wall stress based upon the Law of LaPlace. However, determining patient-specific wall stress would ideally better predict aortic dissection than aneurysm diameter. Unfortunately, it is not possible to noninvasively measure wall stress or wall strength in vivo. Finite element analysis (FEA) is a widely used engineering tool which can determine wall stresses, using zero-pressure geometry, material properties, and hemodynamic loading conditions. Using FEA, we previously determined in vivo aortic wall stresses on a patient-specific basis11–13. We demonstrated the importance of determining pre-stress geometry, i.e. zero-pressure geometry on wall stress results and also found significant differences in wall stresses in the sinotubular junction between aTAAs from bicuspid (BAV) vs. tricuspid aortic valve (TAV) patients12. In this study, our goal was to determine the relationship between wall stress and aneurysm diameter for larger ≥5cm versus. smaller aneurysms <5cm.
Materials and Methods
Patients and data acquisition
We retrospectively reviewed aTAA patients from our surgical clinic database at the San Francisco Veterans Affairs Medical Center (SFVAMC). Patients were referred to our clinic only when aTAAs were ≥4.0cm. We included patients with small aTAA<5.0cm that were being followed clinically with ECG-gated CT angiography (CTA) as well as patients with large aTAA≥5.0cm, some of whom were still followed by CTA imaging while others underwent surgical intervention. Patients were excluded if they had a prior surgical aortic valve replacement, primarily aortic root or aortic arch dilatation, or poor CTA image quality. No patients had connective tissue disorder. A total of 100 consecutive clinic patients whose aTAA size ranged 4cm to 7.5cm met our inclusion criteria: 53 aTAA<5.0cm and 47 aTAA≥5.0cm. The study was approved by Committee on Human Research at University of California San Francisco Medical Center and Institutional Review Board at SFVAMC. De-identified images were used to reconstruct 3-dimensional (3D) geometries of left ventricular outflow tract (LVOT), aortic annulus, aortic sinuses, sinotubular junction (STJ), ascending aorta (AscAo), aortic arch, and portion of descending thoracic aorta (DTA).
Development of Finite Element Model
To create a finite element (FE) model for each patient, CTA images were imported into MeVisLab (http://www.mevislab.de/home/about-mevislab) for aortic lumen segmentation. Segmented data were imported into GeoMagic for 3D surface reconstruction. Patient-specific 3D aTAA geometries, from LVOT to DTA, were reconstructed from CTA slices orthogonal to the long axis of the aorta. Reconstructed surfaces were then imported into TrueGrid for FE mesh generation(Figure 1). Convergence studies were performed to determine optimal mesh density. The mesh was refined until the stress results varied <1% for two subsequent mesh refinements. Ultimately, each model was three elements thick, and each individual model’s mesh contained ~6,300 elements. These meshes were imported into LS-DYNA (LSTC Inc, Livermore, CA), a commercially available FE software package. LS-DYNA was used for pressure loading simulations and data analysis.
Figure 1.
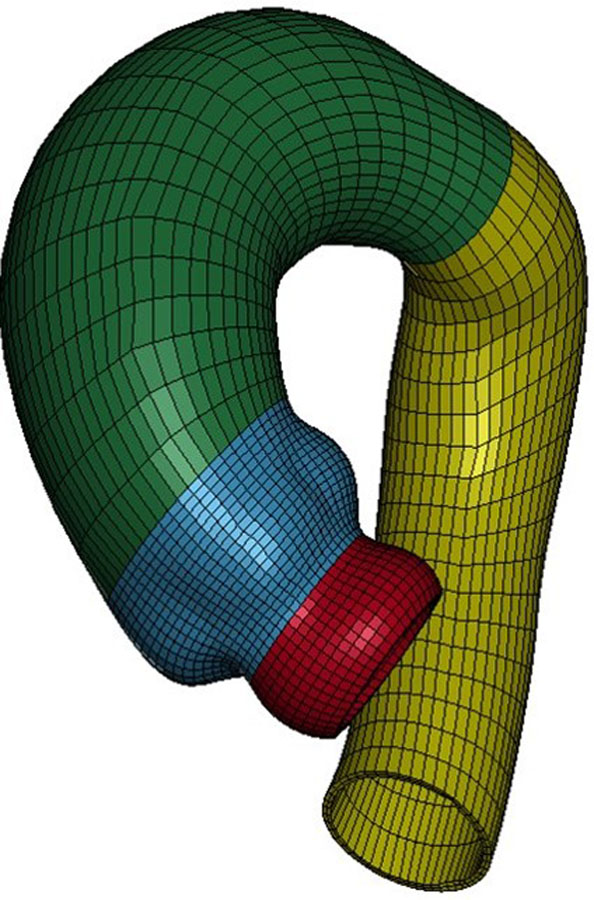
Representative mesh for aTAA FE simulation (red LVOT, blue sinuses, green AscAo and arch, yellow DTA
Zero-Pressure Geometry
CT images used to reconstruct patient-specific 3-D aTAA geometry represented geometry under in vivo physiologic blood pressure conditions and was therefore considered prestressed. Based on these geometries, FE simulations would load from 0mmHg to physiologic blood pressure and thus add stress to already prestressed geometry. We and others have demonstrated the importance of accounting for this prestress to accurately determine in vivo wall stress12, 14, 15. We used a modified updated Lagrangian method to calculate prestress16. In this framework, FE geometry is virtually fixed in space, whereas prestress deformation matrix is applied to the FE model through an iterative process.
Collagen-Embedded Hyperelastic Material Model
ATAA wall was modeled as incompressible hyperelastic material, comprised of non-collagen matrix reinforced with dispersed collagen fibers. Total strain energy density function for aTAA was derived from composite of both strain energy density function of ground matrix and that of collagen fibers as:
| (1) |
where is isochoric part of the right Cauchy-Green deformation tensor and is Jacobian of deformation gradient. enforces the incompressibility of aortic tissue. Ground matrix was assumed to be isotropic and to have neoHookean-like strain energy density function:
| (2) |
where is the first invariant of and is a material constant. We assumed two collagen fibers distributed symmetrically along the circumferential direction with dispersed collagen fibers17:
| (3) |
where is an invariant that reflects the impact of each fiber family deformation on strain energy function17(Figure 2); k1 and k2 are material parameters determined by mechanical testing of the material18, as shown in Table 1.
Figure 2.
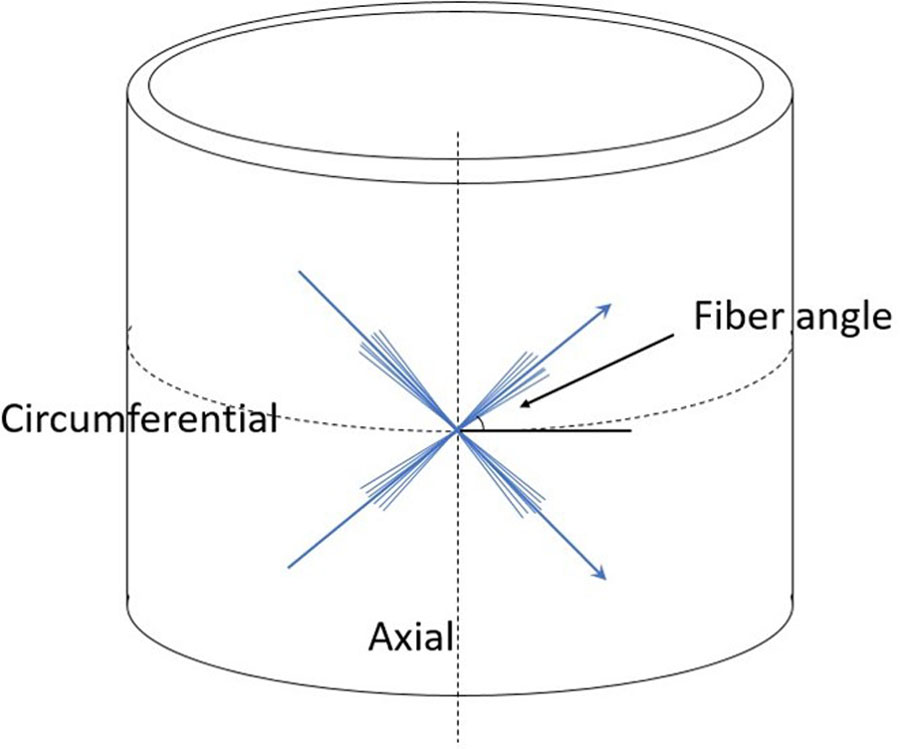
Sketch of fiber angle dispersion with respect to circumferential and axial directions
Table 1.
Material properties of BAV- and TAV-aTAAs.
| Material parameters | k1 | k2 | Fiber angle (degree) |
|---|---|---|---|
| Bicuspid | 76.99 | 18.31 | 43.43 |
| Tricuspid | 78.58 | 9.76 | 44.73 |
Finite Element Simulation
LS-DYNA was used to perform FE simulations with the specified collagen-embedded hyperelastic material model(Eq. 1). Three-dimensional brick elements with an average element size of ~1.5mm were used to reconstruct aTAA wall surface from LVOT to DTA. Aortic wall thickness was set at 1.75mm uniform throughout the model, derived from our prior aneurysm experimental studies19. Aortic root is a dynamic structure with movement during the cardiac cycle. Translational motion was fixed proximally at LVOT, 20mm below the annulus to allow aortic root motion during the cardiac cycle and fixed distally at DTA to account for the physiologic effect of the ligamentum arteriosum without constraints to rotational motion. Simulations were then performed by applying physiologic arterial pressure loading conditions to the inner lumen of the aorta, mimicking normal cardiac cycles. Physiologic blood pressure was assumed for all patients in order to consistently compare wall stress magnitudes at the same pressure. Cardiac cycle of 800ms duration was applied, comprising a 300ms increase from diastolic to systolic pressure followed by a decrease back to diastolic pressure over 500ms. ATAA material properties were obtained from our laboratory’s previous biaxial stretch testing of BAV- and TAV-aTAA tissue with appropriate valve phenotype averaged material properties applied to individual models (Table 1)18.
Statistical Analysis
The 99th percentile wall stress was used for statistical analysis since this has previously been shown to be more reproducible than peak wall stress because it avoids non-physiologic peak wall stresses that occur from inhomogeneities in the FE mesh20. Thus, for simplicity references to peak wall stress represent 99th-percentile wall stress. Reproducibility was tested with 3 independent lab investigators developing n=17 subset of patient-specific FE models, and running FE simulations. Peak stress results among the 3 investigators were compared. Peak and mean circumferential and longitudinal wall stresses were calculated at the sinuses of Valsalva, STJ, and AscAo. Wall stresses in these regions were compared using one-way repeated measures analysis of variance (ANOVA) with Greenhouse-Geisser correction for sphericity departure. Post-hoc Tukey HSD test was utilized for pairwise comparisons when ANOVA showed statistical significance. Moreover, STJ and aTAA together were further subdivided into greater and lesser curvature anatomic regions and compared using paired sample t-test. Continuous measurements of aTAA size, patient age, and wall stress were presented as median and range. Categorical measurements were presented as numbers and percentage. Because peak wall stresses were not normally distributed, peak stresses from aTAA<5cm and aTAA≥5cm group were compared using Mann-Whitney U-test and Kruskal-Wallis test21. Pearson correlation coefficients were used to determine relationship between aneurysm diameter and peak wall stresses. Chi-square test was used to determine the difference between the large and small aTAA groups based on aortic valve subtype. A linear threshold regression model with a segmented-type change point was fitted for the relationship between both the circumferential and longitudinal stresses and aneurysm diameter22. P-value <0.05 was considered statistically significant. Statistical analyses were performed using R (R 3.4.0 www.r-project.org).
Results
Patient Demographics
Small and large aneurysm patients had similar age(67.0 vs. 66.3years, p=0.98). Average aneurysm diameters were 4.5cm and 5.4cm for small and large aneurysm groups, respectively. The incidence of aortic valve disease was similar between the two groups(Table 2).
Table 2.
Clinical data of aTAA<5cm vs. aTAA≥5cm
| <5cm (n=53) | ≥5cm (n=47) | |||
|---|---|---|---|---|
| aTAA diameter (cm) | 4.5±0.2 (4.1–4.9) | 5.43±0.41 (5.00–6.50) | ||
| Age | 67 ±7 (49–86) | 66±10 (48–90) | ||
| No. | % | No. | % | |
|
| ||||
| Aortic stenosis | ||||
| None | 42 | 79.2 | 29 | 56.5 |
| Mild | 1 | 1.9 | 6 | 15.2 |
| Moderate | 1 | 1.9 | 4 | 10.9 |
| Severe | 9 | 17.0 | 8 | 17.0 |
| Aortic insufficiency | ||||
| None | 37 | 69.8 | 24 | 45.7 |
| Mild | 5 | 9.4 | 7 | 21.7 |
| Moderate | 10 | 18.9 | 7 | 13.0 |
| Severe | 1 | 1.9 | 9 | 19.6 |
Peak Wall Stresses for aTAA<5cm at Systole
At systolic pressure, peak circumferential wall stresses for aTAA<5cm was 486±87kPa, ranging from 221kPa to 769kPa. Peak longitudinal wall stress for aTAA<5cm were 310±54kPa, ranging from 130kPa to 466kPa. Representative wall stress profiles are shown in Figure 3.
Figure 3.
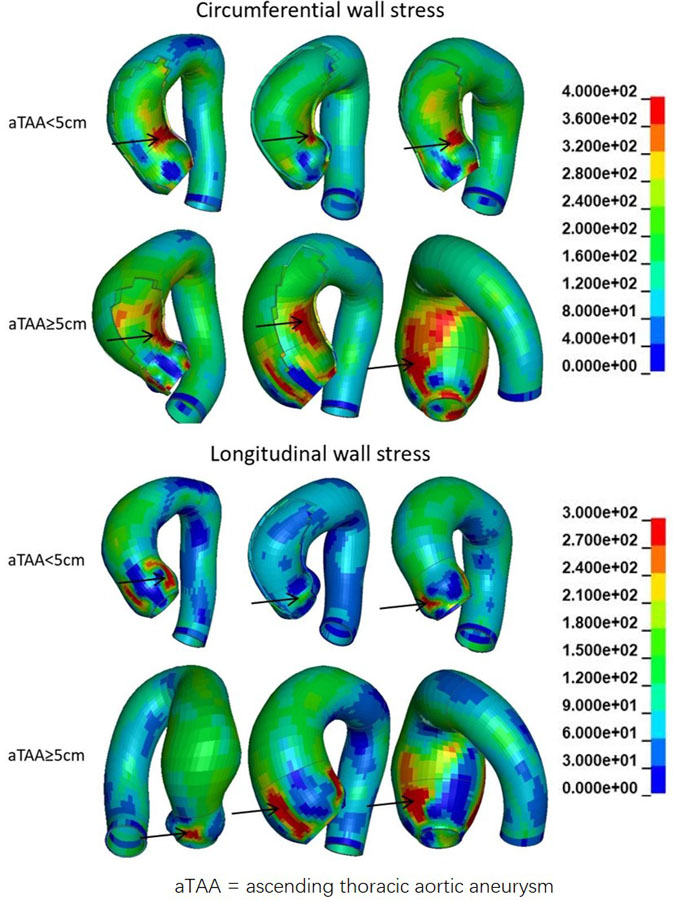
Representative circumferential and longitudinal wall stress distribution in aTAA≥5cm and aTAA<5cm. Arrow is peak wall stresses. Color legend of wall stress magnitudes in kPa.
Significant differences in peak circumferential and longitudinal wall stresses existed among the aneurysm’s anatomic regions. Peak circumferential wall stresses at regions were: sinuses (441±81kPa), STJ (502±118kPa), and AscAo (341±44kPa) [F=59.8, p<1e-15]. Peak longitudinal wall stresses at regions were: sinuses (341±54kPa), STJ (252±57kPa), and AscAo (201±33kPa) [F=104.3, p<1e-15].
Peak Wall Stresses for aTAA≥5cm at Systole
For aTAA≥5.0cm, longitudinal peak stresses were 331±57kPa (p=0.08), ranging from 232kPa to 474kPa. Peak circumferential wall stresses were 530±83kPa at systolic pressure, ranging from 346Pa to 753kPa (p=0.07). There were again significant regional differences of peak circumferential wall stresses for the anatomic regions: sinuses of Valsalva (457±96kPa), STJ (568±185kPa), and AscAo (403±70kPa) [F= 34.3, p<1e-12]. Peak longitudinal wall stresses at regions were: sinuses of Valsalva (373±70kPa), STJ (300±66kPa), and AscAo (231±36kPa) and also differed by region [F=67.5, p<1e-15].
Compared with wall stresses of aTAAs<5.0cm, aTAAs≥5.5cm had higher peak longitudinal (p<1e-5) and circumferential (p<1e-5) stresses on AscAo. However, there existed large overlap of both longitudinal and circumferential stresses between the two groups. Lastly, reproducibility of stress analyses was seen by developing n=17 subset of patient-specific FE models and running FE simulations. Inter-investigator variability had an overall mean percentage difference of 7%±4% and 5%±2% for peak circumferential and longitudinal wall stresses, respectively, without significant differences(p=0.4) among investigators.
ATAA wall stress correlation with maximum diameter
Maximum aortic diameter and peak aTAA wall stresses were correlated in a linear relationship. For aTAAs<5.0cm, maximum aTAA diameter showed poor correlation with circumferential and longitudinal wall stresses. Correlation coefficients for peak circumferential and longitudinal wall stresses versus aTAA diameter were 0.23 (p=0.1) and 0.14 (p=0.33), respectively. For aTAA ≥5.0cm, improved but not good correlation was found between aTAA size and peak wall stresses (Figures 4–5). Correlation coefficients were 0.41 (p=0.004) and 0.33 (p=0.02) for peak circumferential and longitudinal stresses versus diameter, respectively. These findings of reduced correlation of peak circumferential or longitudinal wall stresses versus aTAA diameter when aTAAs<5.0cm but improved correlation when aTAAs≥5.0cm remained even when subset of BAV and TAV aTAAs were examined. For the whole aTAA cohort, the correlation between aTAA size and peak wall stresses was 0.32 (p=0.001) for circumferential and 0.31 (p=0.002) for longitudinal stresses when analyzed as continuous variables. The segmented-threshold linear regression analysis revealed there were no statistically significant points (p=0.90 and 0.74 for circumferential and longitudinal stresses respectively) where the relationship changed between both circumferential and longitudinal stresses and the aneurysm diameter. There was a better linear relationship between maximum aortic diameter and peak wall stresses in AscAo region. For aTAAs<5.0cm, correlation coefficients for AscAo wall stresses on circumferential (341±44kPa) and longitudinal (201±33kPa) direction versus aTAA diameter were 0.41 (p=0.002) and 0.15 (p=0.28), respectively. For aTAA≥5.0cm, an even better correlation was found between aTAA size and peak wall stresses. Correlation coefficients were 0.60 (p<1e-5) and 0.34 (p=0.02) for peak circumferential (403±70kPa) and longitudinal stress (231±36kPa) versus diameter, respectively.
Figure 4.
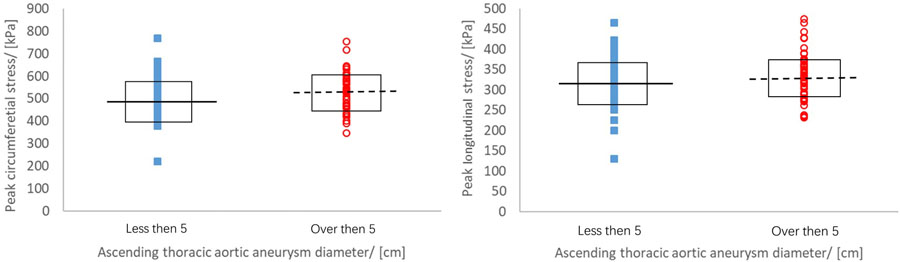
Peak wall stress of aTAA<5cm (squares) and aTAA≥5cm (circles) at systolic pressure with median value from aTAA<5cm (solid line) and aTAA≥5cm (dashed line).
Figure 5.
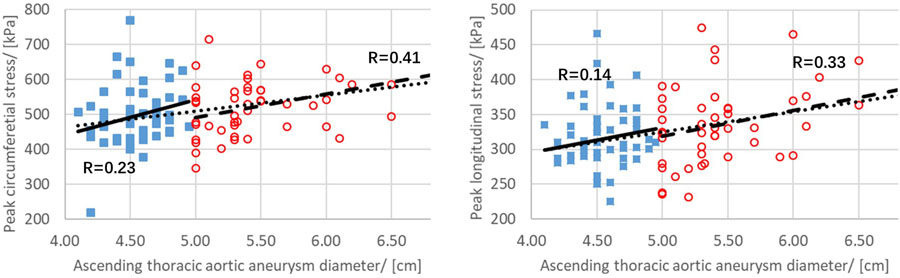
Relationship between peak circumferential and longitudinal stress and aTAA maximum diameter for aTAA<5cm (squares) and aTAA≥5cm (circles). Correlation coefficient r is shown as solid line for aTAA<5cm and dashed line for aTAA≥5cm. Linear correlation for the entire population based on continuous variables is shown as dotted line.
Wall Stress of Greater vs Lesser Curvature at Systole
Peak AscAo circumferential wall stresses were located at the lesser curvature in 41 of 53 aTAAs<5.0cm (77.4%) (333±47kPa vs. 304±37kPa) and 42 of 47 aTAAs≥5.0cm (89.4%) (401±72kPa vs. 330±46kPa). Similarly, peak STJ circumferential wall stresses were also located at the lesser curvature in 39 cases in aTAAs<5.0cm (83.0%) (502±123kPa vs. 393±73kPa) and 52 aTAAs≥5.0cm (98.1%) (568±187kPa vs. 405±84kPa). However peak longitudinal stresses were larger on the greater curvature side at STJ for both aTAA groups.
Discussion
We demonstrated that poor correlation exists between aTAA size and peak wall stresses in the circumferential and longitudinal directions for aTAA<5.0cm with improved but not good correlation for aTAA≥5.0cm. Overall, when analyzed as continuous variables, correlation between peak wall stresses either circumferential or longitudinal with aneurysm diameter was poor. There was no diameter threshold that led to sharp change of the correlation between wall stress and aneurysm diameter, as used in the clinical guidelines. Larger aneurysms tended to have higher peak circumferential and longitudinal stresses than smaller aneurysms; however, there exists significant overlap of peak stresses between the two groups. This could partly explain why a significant portion of acute type A aortic dissection occurs in small aneurysm patients. The clinically used diameter-based approach has limitations and is not sufficient for patient-specific risk stratification of aortic dissection, especially for those patients whose aTAA size do not meet current criteria for surgical intervention.
Risk of Aortic Dissection
Aortic dissection occurs with an estimated annual incidence rate ranging from 5–30 cases/million people, and is highly lethal, with mortality rate of 1–2%/hour early after the onset of symptoms. Aortic dissection risk for aTAAs increases as size increases, with observed annual rate of dissection increasing from 2% for small aneurysms, to 3% for aneurysms between 5–5.9 cm, and then to 6.9% for aneurysms >6cm5. Elective surgical repair of aTAA >6cm has been shown to restore patient survival to that of normal age matched population. The American College of Cardiology/American Heart Association guidelines in 2016 recommended elective aTAA repair when size ≥5.5cm unless family history of dissection or growth rate ≥0.5cm/year was present. These guidelines reflected epidemiologic studies demonstrating a correlation between very large aneurysms and dissection risk4, 5, 23, 24. Similarly, current European guidelines of aneurysm size for elective aTAA surgery is 5.5cm25, 26. We chose to study wall stress using diameter cutoffs of 5cm because our study included both BAV- and TAV-aTAA and patients at 5cm are eligible for elective repair when symptomatic or with a family history of dissection or sudden death. Additionally, some patients >5cm are too anxious to wait for 5.5cm and have also elected to undergo elective repair. Since we routinely operated on BAV patients with 5.0cm based on prior guidelines, we opted to capture patients ≥5.0cm. None of our patients had connective tissue disorder.
Acute type A aortic dissection has been shown known to occur in aTAAs smaller than the surgical threshold size27, 28. Observational data from the International Registry of Acute Aortic Dissection (IRAD) suggested that 60% of dissection patients had aortic diameters <5.5cm and 40% <5cm, suggesting size alone had poor predictive power in determining dissection risk28. Biomechanics-based risk evaluation has the potential to improve aTAA management, since biomechanically, aortic dissection may occur as a mechanical failure when aortic wall stress exceeds wall strength. One biomechanics strategy is to use patient-specific wall stress as a surrogate for aortic dissection risk to identify small aTAA patients whose risk profile is comparable to that of larger aTAA patients. If an individual small aTAA patient has high wall stresses similar to that of large aTAA patients, then that small aTAA patient may be at increased risk for dissection than expected based upon their small aTAA size. Such a patient may be counseled to consider elective aneurysm repair if their operative risk is considered lower than their risk of dissection.
In our study, we found that overall peak circumferential and longitudinal wall stresses were greater in aTAA≥5cm than in aTAA<5cm. These results are consistent with clinical observations of higher dissection rates for larger aneurysms5. However, we also observed significant overlap of both circumferential and longitudinal stresses between small and large aneurysm groups(Figures 4–5). Such large overlap may explain why a large portion of observed aortic dissections occurs in small aneurysm patients27, 28. Patients with high wall stress in the small aneurysm group could have similar risk of rupture/dissection as that of the large aneurysm group. Large overlap of wall stresses has been previously noted between small and large abdominal aortic aneurysms29.
Study Limitations
A major limitation of the current study is that aTAA imaging was derived from male patients, reflective of the patient population treated at the SFVAMC. Previous studies suggest male sex confers protective factor in terms of aortic dissection risk5. Future studies will need to include aTAAs from female patients. Another limitation is the assumption in the model geometry that wall thickness is uniform based on average aneurysm thickness from surgical specimens. Currently, resolution of in-vivo CT scans is not sufficient to accurately ascertain regional aortic wall thickness. The present study also did not consider FSI or blood flow patterns specific to aTAA. A left-handed circumferential flow with slower-moving helical pattern was found in the aneurysm’s center for BAV-aTAAs. Wall stress is about five orders of magnitude larger than wall shear stress with respect to dissection and rupture risk30. Lastly, inclusion of aTAAs from patients that subsequently develop clinical type A aortic dissection would be valuable to study. At the time of study undertaking, we did not have access to CT scans of pre-dissection aTAA patients. Pre-dissection CT scans would aid this study by examining locations of peak wall stress and intimal tear site. Such information will be pursued in future studies as the data becomes available.
Conclusions
Patients with aTAA diameters under the surgical size thresholds for intervention are managed with clinical surveillance. However, observational studies show a large proportion of dissections occurring in smaller aTAAs. Patient-specific biomechanical FEA analysis may provide a more reliable risk stratification tool than the current diameter-based approach. In this study, we determined patient-specific wall stresses in patients with aTAA<5cm versus aTAA≥5cm. Correlations between peak wall stresses and size were poor for aTAA<5cm. Peak wall stress may be considered an independent risk factor for dissection. Our results highlight the need for patient-specific aTAA wall stress analyses to evaluate dissection risk and optimize timing of operative intervention, especially for those patients aTAA<5cm.
Supplementary Material
Supplemental Video. Study methodology showing FE model development and central results of peak longitudinal stresses of 100 aTAA patients.
Central Message.
Patient-specific wall stresses may identify small aneurysm patients with similar wall stresses and possible dissection risk as larger aneurysm patients.
Perspective Statement.
Biomechanically, dissection may occur when wall stress exceeds wall strength. Aneurysm size has been used to estimate wall stress via LaPlace’s law and thus dissection risk. However, using patient-specific models, we found poor correlation between peak wall stresses and size. Determining peak patient-specific wall stresses is critical for determining dissection risk particularly in small aneurysms.
Acknowledgements
The study was funded by the National Institutes of Health, R01HL119857-01A1.
Glossary of Abbreviations
- aTAA
ascending thoracic aortic aneurysm
- FE
finite element
- FEA
finite element analyses
- CT
computed tomography
- CTA
computed tomography angiography
- cm
centimeter
- kPa
kilopascal
Footnotes
Disclosure
Dr. Yue Xuan has disclosed grants from The American Heart Association and the Marfan Foundation. Dr. Julius Guccione has disclosed grants from NIH. The other authors have no conflicts of interest.
Presented at Western Thoracic Surgical Association 2018, June 27–30, 2018, Goleta, CA.
IRB number: 10-03594, 13-109932
References
- 1.Coady MA, Rizzo JA, Hammond GL, Kopf GS, Elefteriades JA. Surgical intervention criteria for thoracic aortic aneurysms: A study of growth rates and complications. The Annals of thoracic surgery. 1999;67:1922. [DOI] [PubMed] [Google Scholar]
- 2.Kim JB, Spotnitz M, Lindsay ME, MacGillivray TE, Isselbacher EM, Sundt TM. Risk of aortic dissection in the moderately dilated ascending aorta. Journal of the American College of Cardiology. 2016;68:1209–1219 [DOI] [PubMed] [Google Scholar]
- 3.Hiratzka LF, Bakris GL, Beckman JA, Bersin RM, Carr VF, Casey DE, Eagle KA, Hermann LK, Isselbacher EM, Kazerooni EA. 2010 accf/aha/aats/acr/asa/sca/scai/sir/sts/svm guidelines for the diagnosis and management of patients with thoracic aortic disease. Journal of the American College of Cardiology. 2010;55:e27–e129 [DOI] [PubMed] [Google Scholar]
- 4.Elefteriades JA. Natural history of thoracic aortic aneurysms: Indications for surgery, and surgical versus nonsurgical risks. The Annals of thoracic surgery. 2002;74:S1877–S1880 [DOI] [PubMed] [Google Scholar]
- 5.Davies RR, Goldstein LJ, Coady MA, Tittle SL, Rizzo JA, Kopf GS, Elefteriades JA. Yearly rupture or dissection rates for thoracic aortic aneurysms: Simple prediction based on size. The Annals of thoracic surgery. 2002;73:17–28 [DOI] [PubMed] [Google Scholar]
- 6.Pape LA. Aortic risk redux. J Am Coll Cardiol. 2016;68:1220–1222 [DOI] [PubMed] [Google Scholar]
- 7.Thubrikar MJ, Agali P, Robicsek F. Wall stress as a possible mechanism for the development of transverse intimal tears in aortic dissections. J Med Eng Technol. 1999;23:127–134 [DOI] [PubMed] [Google Scholar]
- 8.Pasta S, Phillippi JA, Gleason TG, Vorp DA. Effect of aneurysm on the mechanical dissection properties of the human ascending thoracic aorta. The Journal of thoracic and cardiovascular surgery. 2012;143:460–467 [DOI] [PMC free article] [PubMed] [Google Scholar]
- 9.Hirst AE Jr., Johns VJ Jr., Kime SW Jr. Dissecting aneurysm of the aorta: A review of 505 cases. Medicine 1958;37:217–279 [DOI] [PubMed] [Google Scholar]
- 10.Hagan PG, Nienaber CA, Isselbacher EM, Bruckman D, Karavite DJ, Russman PL, Evangelista A, Fattori R, Suzuki T, Oh JK. The international registry of acute aortic dissection (irad) new insights into an old disease. JAMA 2000;283:897–903 [DOI] [PubMed] [Google Scholar]
- 11.Wang Z, Wood NB, Xu XY. A viscoelastic fluid–structure interaction model for carotid arteries under pulsatile flow. International journal for numerical methods in biomedical engineering 2015;31 [DOI] [PubMed] [Google Scholar]
- 12.Xuan Y, Wang Z, Liu R, Haraldsson H, Hope MD, Saloner DA, Guccione JM, Ge L, Tseng E. Wall stress on ascending thoracic aortic aneurysms with bicuspid compared to tricuspid aortic valve. The Journal of thoracic and cardiovascular surgery 2018 [DOI] [PMC free article] [PubMed] [Google Scholar]
- 13.Wang Z, Xuan Y, Guccione JM, Tseng EE, Ge L. Impact of patient-specific material properties on aneurysm wall stress: Finite element study. J Heart Valv Dis 2018;In Press [PMC free article] [PubMed] [Google Scholar]
- 14.Krishnan K, Ge L, Haraldsson H, Hope MD, Saloner DA, Guccione JM, Tseng EE. Ascending thoracic aortic aneurysm wall stress analysis using patient-specific finite element modeling of in vivo magnetic resonance imaging. Interactive cardiovascular and thoracic surgery 2015;21:471–480 [DOI] [PMC free article] [PubMed] [Google Scholar]
- 15.Wisneski AD, Mookhoek A, Chitsaz S, Hope MD, Guccione JM, Ge L, Tseng EE. Patient-specific finite element analysis of ascending thoracic aortic aneurysm. The Journal of heart valve disease 2014;23:765–772 [PMC free article] [PubMed] [Google Scholar]
- 16.Gee MW, Förster C, Wall W. A computational strategy for prestressing patient‐specific biomechanical problems under finite deformation. International Journal for Numerical Methods in Biomedical Engineering 2010;26:52–72 [Google Scholar]
- 17.Gasser TC, Ogden RW, Holzapfel GA. Hyperelastic modelling of arterial layers with distributed collagen fibre orientations. Journal of the royal society interface 2006;3:15–35 [DOI] [PMC free article] [PubMed] [Google Scholar]
- 18.Azadani AN, Chitsaz S, Mannion A, Mookhoek A, Wisneski A, Guccione JM, Hope MD, Ge L, Tseng EE. Biomechanical properties of human ascending thoracic aortic aneurysms. Ann Thorac Surg 2013;96:50–58 [DOI] [PubMed] [Google Scholar]
- 19.Azadani AN, Chitsaz S, Matthews PB, Jaussaud N, Leung J, Wisneski A, Ge L, Tseng EE. Biomechanical comparison of human pulmonary and aortic roots. European journal of cardio-thoracic surgery : official journal of the European Association for Cardio-thoracic Surgery 2012;41:1111–1116 [DOI] [PubMed] [Google Scholar]
- 20.Speelman L, Bosboom EM, Schurink GW, Hellenthal FA, Buth J, Breeuwer M, Jacobs MJ, van de Vosse FN. Patient-specific aaa wall stress analysis: 99-percentile versus peak stress. Eur J Vasc Endovasc Surg 2008;36:668–676 [DOI] [PubMed] [Google Scholar]
- 21.Linhartová K, Beránek V, Sefrna F, Hanisová I, Sterbáková G, Pesková M. Aortic stenosis severity is not a risk factor for poststenotic dilatation of the ascending aorta. Circulation Journal 2007;71:84–88 [DOI] [PubMed] [Google Scholar]
- 22.Fong Y, Huang Y, Gilbert PB, Permar SR. Chngpt: Threshold regression model estimation and inference. BMC Bioinformatics 2017;18:454. [DOI] [PMC free article] [PubMed] [Google Scholar]
- 23.Coady MA, Rizzo JA, Hammond GL, Mandapati D, Darr U, Kopf GS, Elefteriades JA. What is the appropriate size criterion for resection of thoracic aortic aneurysms? The Journal of thoracic and cardiovascular surgery 1997;113:476–491 [DOI] [PubMed] [Google Scholar]
- 24.Juvonen T, Ergin MA, Galla JD, Lansman SL, Nguyen KH, McCullough JN, Levy D, de Asla RA, Bodian CA, Griepp RB. Prospective study of the natural history of thoracic aortic aneurysms. The Annals of thoracic surgery 1997;63:1533–1545 [DOI] [PubMed] [Google Scholar]
- 25.members ATF, Erbel R, Aboyans V, Boileau C, Bossone E, Bartolomeo RD, Eggebrecht H, Evangelista A, Falk V, Frank H. 2014 esc guidelines on the diagnosis and treatment of aortic diseases: Document covering acute and chronic aortic diseases of the thoracic and abdominal aorta of the adult the task force for the diagnosis and treatment of aortic diseases of the european society of cardiology (esc). European heart journal 2014;35:2873–2926 [DOI] [PubMed] [Google Scholar]
- 26.Rozado J, Martin M, Pascual I, Hernandez-Vaquero D, Moris C. Comparing american, european and asian practice guidelines for aortic diseases. Journal of thoracic disease 2017;9:S551. [DOI] [PMC free article] [PubMed] [Google Scholar]
- 27.Jaussaud N, Chitsaz S, Meadows A, Wintermark M, Cambronero N, Azadani A, Saloner D, Chuter T, Tseng E. Acute type a aortic dissection intimal tears by 64-slice computed tomography: A role for endovascular stent-grafting? The Journal of cardiovascular surgery 2013;54:373–381 [PubMed] [Google Scholar]
- 28.Pape LA, Tsai TT, Isselbacher EM, Oh JK, O’Gara PT, Evangelista A, Fattori R, Meinhardt G, Trimarchi S, Bossone E. Aortic diameter≥ 5.5 cm is not a good predictor of type a aortic dissection: Observations from the international registry of acute aortic dissection (irad). Circulation 2007;116:1120–1127 [DOI] [PubMed] [Google Scholar]
- 29.Fillinger MF, Marra SP, Raghavan ML, Kennedy FE. Prediction of rupture risk in abdominal aortic aneurysm during observation: Wall stress versus diameter. Journal of vascular surgery 2003;37:724–732 [DOI] [PubMed] [Google Scholar]
- 30.Pasta S, Rinaudo A, Luca A, Pilato M, Scardulla C, Gleason TG, Vorp DA. Difference in hemodynamic and wall stress of ascending thoracic aortic aneurysms with bicuspid and tricuspid aortic valve. Journal of biomechanics 2013;46:1729–1738 [DOI] [PMC free article] [PubMed] [Google Scholar]
Associated Data
This section collects any data citations, data availability statements, or supplementary materials included in this article.
Supplementary Materials
Supplemental Video. Study methodology showing FE model development and central results of peak longitudinal stresses of 100 aTAA patients.