

Abstract
Attenuation correction has been one of the main methodological challenges in the integrated positron emission tomography and magnetic resonance imaging (PET/MRI) field. As standard transmission or computed tomography (CT) approaches are not available in integrated PET/MRI scanners, MR-based attenuation correction approaches had to be developed. Aspects that have to be considered for implementing accurate methods include the need to account for attenuation in bone tissue, normal and pathological lung and the MR hardware present in the PET field-of-view, to reduce the impact of subject motion, to minimize truncation and susceptibility artifacts, and to address issues related to the data acquisition and processing both on the PET and MRI sides. The standard MR-based attenuation correction techniques implemented by the PET/MRI equipment manufacturers and their impact on clinical and research PET data interpretation and quantification are first discussed. Next, the more advanced methods, including the latest generation deep learning-based approaches that have been proposed for further minimizing the attenuation correction related bias are discussed. Finally, a future perspective focused on the needed developments in the field is given.
1. Introduction
The integrated positron emission tomography (PET) and magnetic resonance imaging (MRI) human scanners introduced over the last decade have enabled investigators to begin to study the benefits of simultaneously acquiring the complementary information provided by the two modalities. To fully exploit this opportunity, the quality of the datasets collected using integrated PET/MRI scanners must be at least similar to that obtained with the equivalent stand-alone devices. On the hardware side, this required the development of novel types of PET and MRI technology to minimize the potential for mutual interference. On the methodological side, the main challenge in the PET/MRI field has been attenuation correction. Among the several corrections that must be applied to the raw PET data to estimate the radiotracer concentration, attenuation correction has the biggest impact on data quantification. To perform this correction, the attenuation of the 511 keV annihilation photons has to be either directly measured or estimated from the data obtained with another imaging modality. In the former approach used in stand-alone PET scanners, the attenuation along each line-of-response joining two detectors was measured with a rotating transmission source (filled with a positron or gamma-ray emitter). Although this method is considered the gold standard for PET attenuation correction as it measures the attenuation at the same energy as the annihilation photons, acquiring the data was slow and the measurements were noisy (Nakamoto et al 2002). Deriving this information from another modality gained popularity with the introduction of integrated PET and computed tomography (PET/CT) scanners (Beyer et al 2000). Several methods have been proposed for converting the CT’s Hounsfield unit (HU) values to linear attenuation coefficients at 511 keV (Kinahan et al 1998, Burger et al 2002, Bai et al 2003). Although the CT-based approach is not without limitations, it has become the accepted standard for PET attenuation correction. As neither approach is available in integrated PET/MRI scanners, this correction has to be performed using the MRI (and PET) data instead.
Several aspects must be considered when implementing an MR-based attenuation correction method (Fig. 1). The MR signal intensity, which depends on proton density and tissue relaxation times, does not directly reflect electron density, which is relevant for attenuation correction. This makes bone tissue difficult to visualize using the data acquired using conventional MR sequences. Similarly, MR imaging of lung tissue is challenging given its low proton density, susceptibility artifacts at the many air-tissue interfaces, tissue fraction effects, respiratory motion, etc. Subject motion leads to mismatches between the MR and the emission data. The patient’s arms are positioned along the body for PET/MRI studies and thus extend outside the uniform region of the MR field-of-view, leading to truncation artifacts. Foreign objects (e.g. dental implants and prostheses) can cause susceptibility artifacts in the MR images. Intravenous contrast agents often used for clinical purposes can change the contrast between different structures. Over the last decade, the equipment manufacturers and academic groups have proposed methods to address most of these challenges and reduce the impact of the remaining ones.
Figure 1:
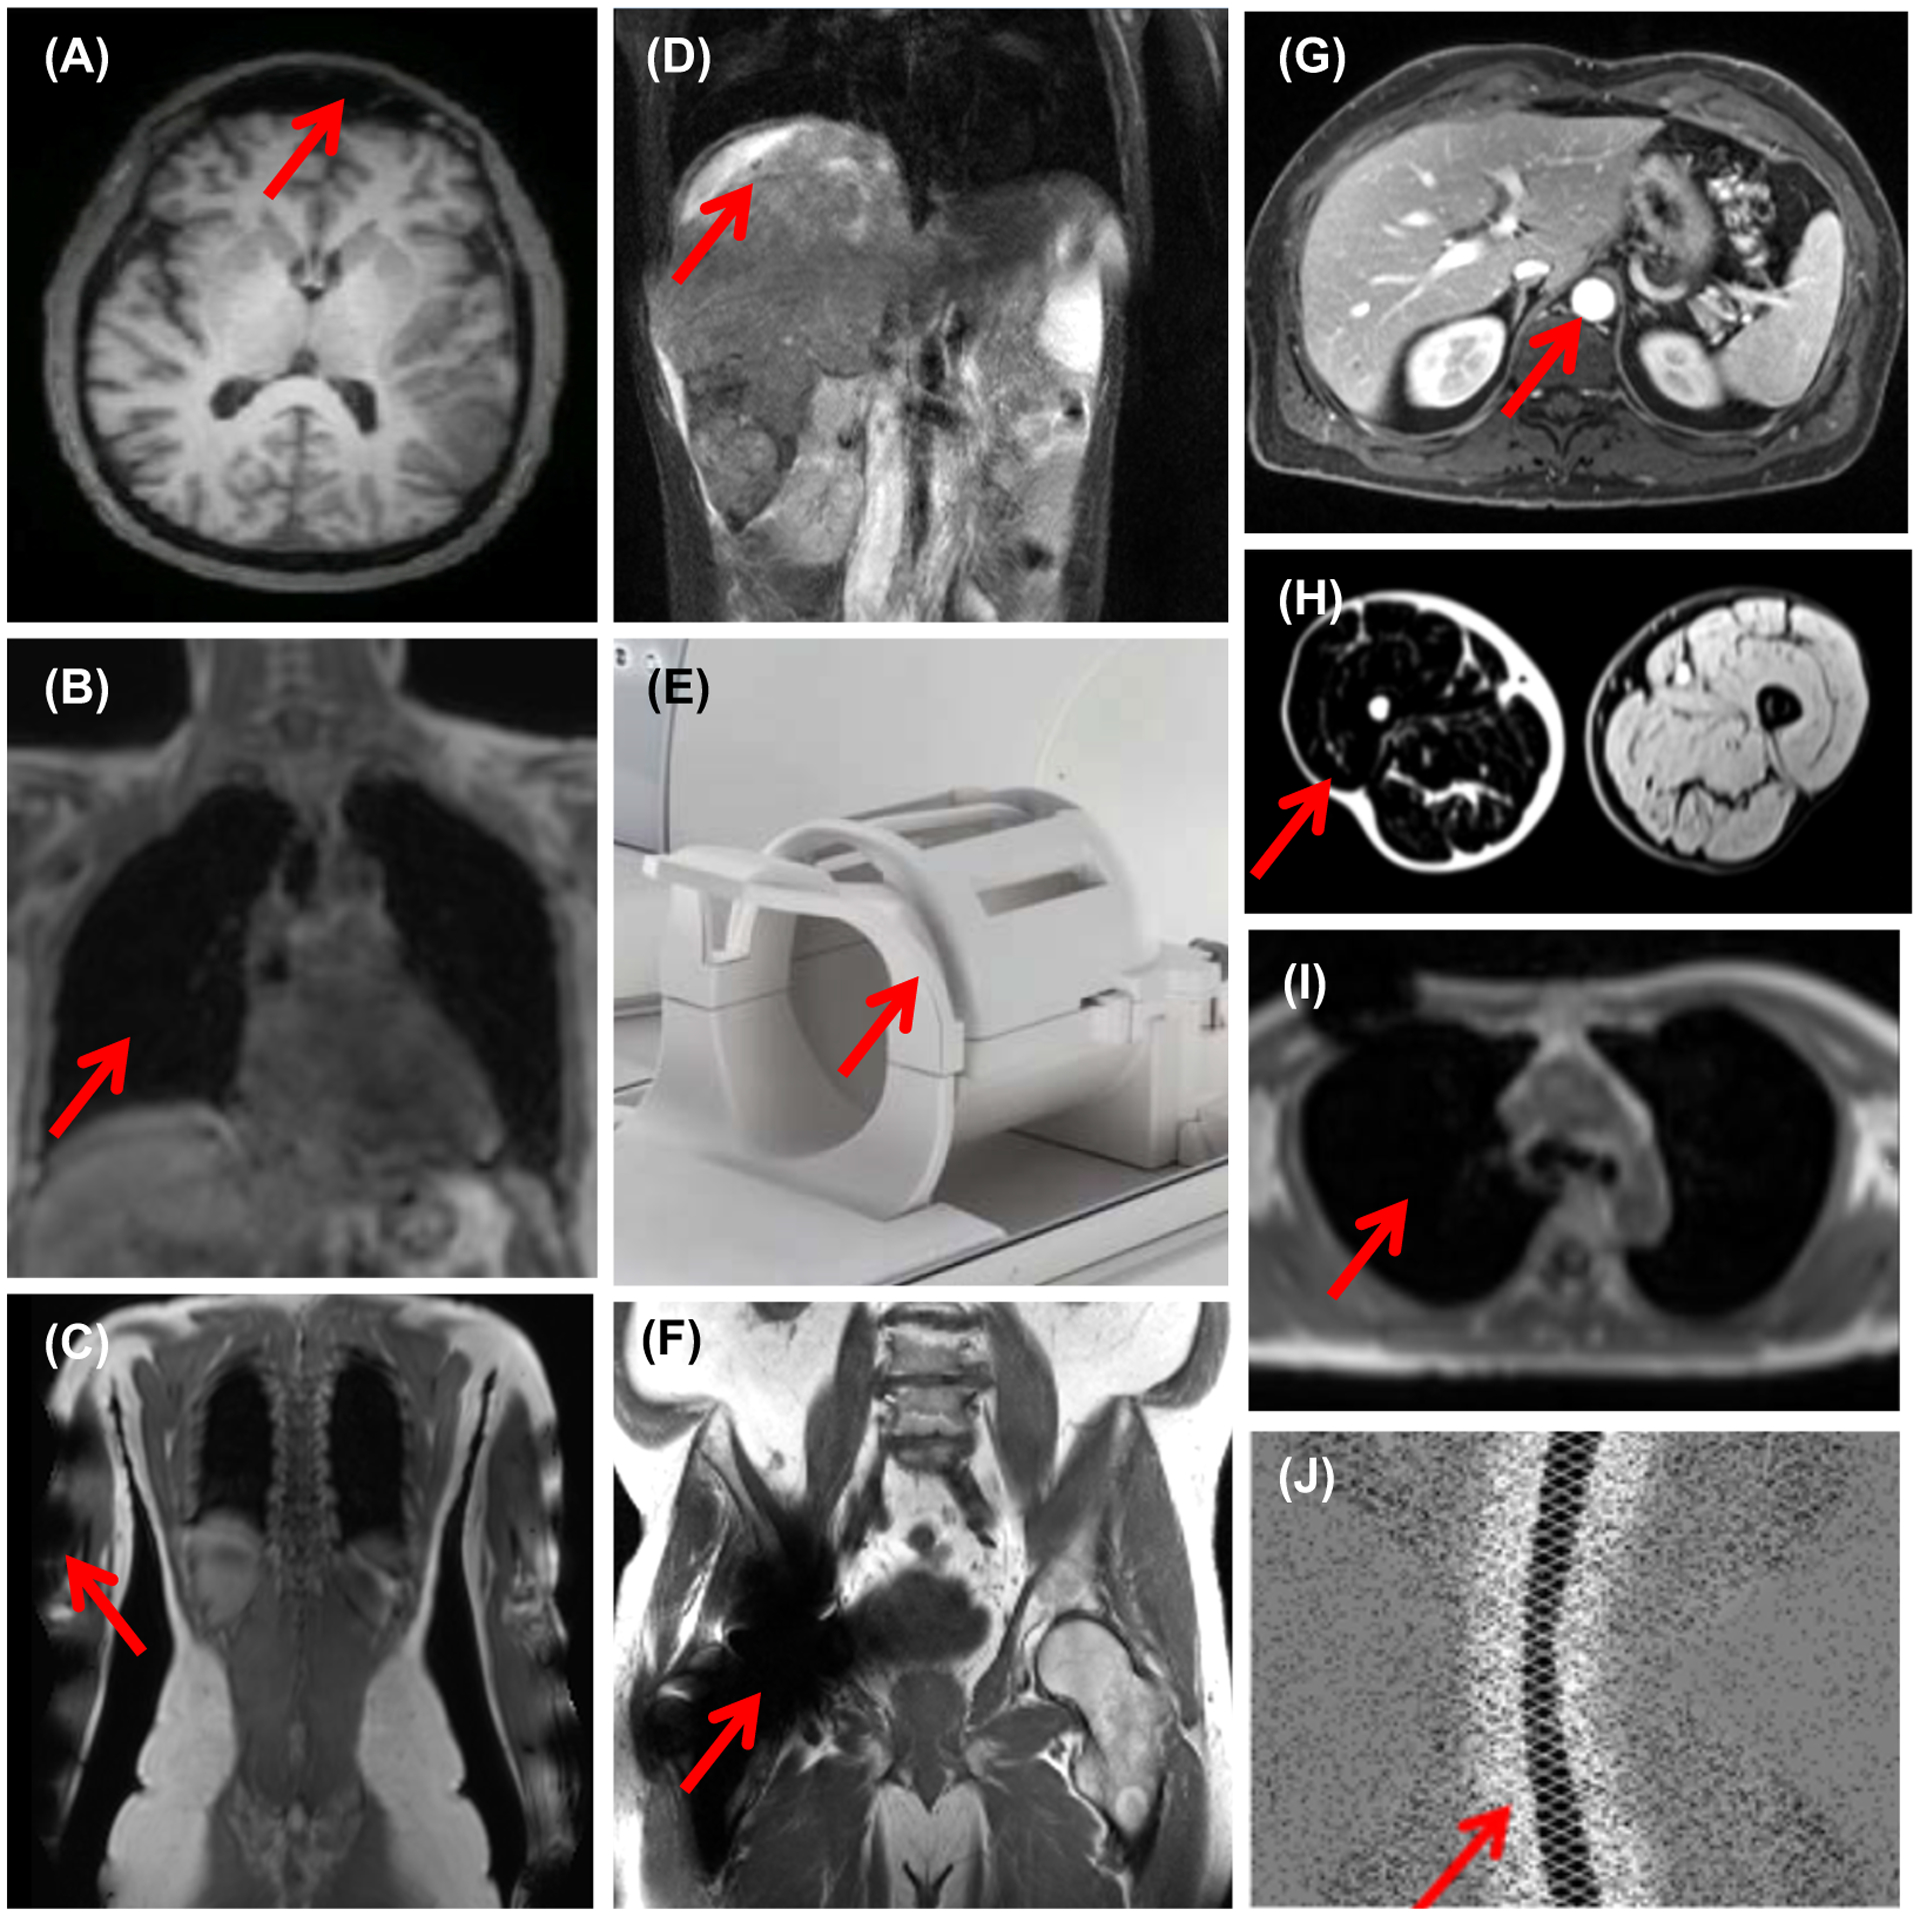
Examples of challenges in MR-based attenuation correction: (A) Skull tissue cannot be easily distinguished from frontal sinus air cavities; (B) Lung has low and uniform signal intensity in the MR images acquired with conventional sequences; (C) The subject’s arms are truncated due to the limited MR transaxial field-of-view; (D) Respiration-induced liver motion leads to attenuation-emission data mismatches; (E) The radiofrequency MR head&neck coil array is placed between the subject’s head and the PET detectors; (F) The hip implant leads to susceptibility artifacts; (G) The MR contrast agent changes the signal intensity in various organs (e.g. aorta, kidneys, liver, etc.); (H) Fat-water inversion affects one of the legs (figure originally published in (Glocker et al 2016)); (I) A susceptibility artifact makes the lung appear connected to the background air; (J) Negative values in the prompts sinogram due to scatter overcorrection (figure originally published in (Heußer et al 2017)). The red arrows point to the specific issue or region affected in each case.
In this review, these challenges and their impact on the generation of the MR-based attenuation maps is briefly described, the standard methods supplied by the vendors available for clinical PET/MRI studies and their influence on PET data quantification are presented, the advanced methods proposed for further minimizing the attenuation correction related bias are discussed and a future perspective focused on the needed developments in the PET/MRI field is given.
2. Challenges in performing MR-based attenuation correction
2.1. Bone tissue MR imaging
Bone tissue has a very short T2* relaxation time (0.05–2 ms), which makes it virtually indistinguishable from air cavities in the images obtained using conventional MRI sequences (Fig. 1A). As bone tissue and air have the highest and lowest linear attenuation coefficients, their misclassification can introduce substantial bias in the resulting PET images. The bone-air and bone-soft tissue misclassifications are particularly relevant when imaging the brain (Catana et al 2010a, Andersen et al 2014, Hitz et al 2014), pelvis (Schramm et al 2015), spine and extremities (Samarin et al 2012), but could also affect the PET data quantification in posterior parts of the lungs (Seith et al 2017).
2.2. Lung tissue MR imaging
Lung tissue is also very difficult to image using MRI because of its short T2* relaxation time, low proton density, susceptibility artifacts and respiratory motion (Fig 1B). Additionally, there is large inter- and intra-subject variability in lung density during the respiratory cycle and in different pathological conditions (Marshall et al 2012, Seith et al 2017). An excellent lung-focused review that covers all these aspects and potential solutions in more detail was recently published (Lillington et al 2020).
2.3. Truncation artifacts due to the limited MR field-of-view
Geometrical distortions are present outside the uniform region of the MR field-of-view, which is usually limited to 45–50 cm in diameter (Fig. 1C). These spatial distortions are caused by B0 field inhomogeneity and non-linearity of the gradient field. Consequently, the MR-derived attenuation maps are truncated, leading to bias in PET quantification up to 15% globally and 50% locally, particularly in the thorax, abdomen, and pelvis in the case of larger subjects (Delso et al 2010). Additionally, truncation artifacts can also be introduced if the MR imaging field-of-view is smaller than the body part being imaged. The resulting wrap-around artifacts lead to incomplete attenuation maps and decreased MR image quality. Interestingly, even minimally cropping the tip of the nose can introduce large biases in brain studies performed with PET radiotracers that exhibit extremely high signal in the nasal cavity (unpublished observation). This is obviously not due to the minimal under attenuation correction of the missing tissue but due to substantial over scatter correction when the high counts erroneously assumed outside the incomplete attenuation map are used to scale the estimated scatter sinogram.
2.4. Subject motion
In addition to image blurring, subject motion (e.g. rigid-body head motion, non-rigid body respiratory and cardiac motion, peristalsis, bladder filling, positional readjustment, etc.) introduces a mismatch between the emission and MRI data acquired for attenuation correction purposes, which leads to biased quantification (Yang et al 2018a, Kolbitsch et al 2018, Bousse et al 2017, Fayad et al 2017) (Fig 1D). Although not the focus of this review, integrated PET/MRI scanners offer an unique opportunity to address this issue by using MR-derived motion estimates for PET data motion compensation (Catana 2015).
2.5. MRI hardware in the PET field-of-view
The radiofrequency MR coil arrays are often placed as close as possible to the subject and thus inside the PET field-of-view (Fig. 1E) and can interact with the 511 keV photons before they reach the PET detectors. In addition to redesigning the coil to minimally attenuate 511 keV photons, the equipment manufacturers provide the attenuation maps for the majority of the fixed RF coil arrays routinely used for clinical purposes (e.g. head and neck, spine) as well as for the patient table. These maps were obtained either from transmission or CT scans or generated from the CAD drawings of the coil (Eldib et al 2016, Paulus and Quick 2016). The hardware and human attenuation map are combined automatically for each bed position to generate the final map to be used for attenuation correction. Methods have also been proposed for reducing the bias (e.g. up to 15% in the adjacent regions) introduced by the flexible coils (Paulus et al 2012). A similar approach can be used for deriving and integrating the attenuation maps of custom-made application-specific RF coils (Sander et al 2015, Oehmigen et al 2016, 2018b, Farag et al 2020).
2.6. Foreign objects
The numerous foreign objects (e.g. dental implants, surgical clips and wires, orthopedic screws and plates, prosthetic devices, etc.) that can be present in the subject lead to susceptibility artifacts in the MR images (Hargreaves et al 2011) that propagate as signal voids in the corresponding attenuation maps (Fig 1F). A relatively simple solution to minimizing their effect is to fill the signal void with soft tissue (Ladefoged et al 2013, Lassen et al 2019). Alternatively, the location, shape and linear attenuation coefficient of the implant can be estimated using a joint reconstruction of the activity and attenuation algorithm (Fuin et al 2017). Alternatively, advanced MR sequences have been specifically implemented to minimize susceptibility artifacts (Ai et al 2012, Sutter et al 2012, Zho et al 2013).
2.7. MR contrast agents
As MR contrast agents are often used clinically, the possibility of them influencing the MR-based attenuation correction has been raised. Although their presence does not directly increase the 511 keV photon attenuation, they could lead to intensity changes in the MR images used for generating attenuation maps in integrated PET/MRI scanners (Fig. 1G). As will be discussed in the next sections, many of these methods rely on fixed thresholds or tissue contrasts for determining the contour of the body or segmenting various tissue classes. Studies performed to investigate the impact of ferumoxil, gadobutrol (Lois et al 2012) and ferumoxytol (Borra et al 2015, Muehe et al 2019) reported only relatively minor issues (e.g. stomach or liver tissue misclassification) in very specific scenarios. Liver tissue was also misclassified as lung tissue in the case of one liver transplantation patient due to iron overload likely caused by multiple blood transfusion (Büther et al 2017). The overall conclusion of these studies was that the administration of MR contrast agents does not require special considerations in clinical PET/MRI studies.
2.8. Fat-water tissue inversion
Intensity thresholds are also used to segment the various tissue classes from the MR images. Changes in the relative signal intensities due to raw data acquisition/processing factors can lead to errors in the tissue classification. For example, partial or complete fat-water tissue inversion has been reported in ~8% of the 283 patients who underwent brain and head&neck PET/MRI examinations (Fig. 1H). In the case of brain examination, the complete inversion can lead to a spatially varying bias pattern, with the errors increasing towards the center of the head. Partial tissue inversion can lead to artifacts in the resulting PET images (Ladefoged et al 2014).
2.9. Tissue classification/segmentation errors
Segmentation errors due to artifacts, reduced image quality or inadequate performance of the algorithms used for this purpose can result in misclassification of lung as air (Fig. 1I), liver as lung, air pockets in the stomach or bowel as lung or soft tissue (Keller et al 2013, Attenberger et al 2015). The artifacts caused by blood flow in the lung can lead to soft tissue/lung misclassification. Similarly, the aorta can be misclassified as air due to blood flow.
2.10. Halo artifacts
In the case of studies performed using highly specific radiotracers (e.g. [68Ga]PSMA-11), the large differences between the radiotracer concentrations in the urinary bladder (and kidney) and the soft tissue background can lead to over scatter correction (Fig. 1J). Given the non-negativity constraint of the iterative image reconstruction algorithms available on integrated PET/MRI scanners, zero values are enforced in the voxels surrounding these organs, which manifests as a “halo” (or photopenic) artifact (Afshar-Oromieh et al 2014, Heußer et al 2017). Modifications of the scatter correction algorithms such as limiting the maximum scatter fraction to 40% (Heußer et al 2017), increasing the number of axial subsamples in the scatter estimation step and including an additional offset factor in the tail scaling step (Wangerin et al 2018) or using an unrenormalized absolute scatter correction (Lindemann et al 2019a) have been shown to minimize these artifacts.
3. Attenuation correction methods available for clinical PET/MRI
3.1. Vendor-provided MR-based attenuation correction methods
Philips Healthcare
An automatic, three-class MR-based attenuation correction procedure was implemented for the Ingenuity TF sequential PET/MRI scanner (Philips Healthcare, Cleveland, OH, USA) (Schulz et al 2011). Briefly, the MR data are acquired with a free-breathing 3D T1-weighted turbo spin-echo sequence (24 seconds acquisition time per bed position) using the body RF coil in multiple bed positions, each covering 6 cm slabs in the axial direction and with a transaxial field-of-view of 46 cm. To avoid the signal drop-off at the edges of the slabs from propagating in the attenuation map, a “stitching” algorithm was implemented to smooth the images in the axial direction. Next, the outer contour of the body is determined automatically based on a threshold obtained from the Laplace-weighted histogram (Wiemker and Pekar 2001) of all the voxels and using a slice-wise region growing algorithm. To segment the lung, a 2D region growing algorithm (based on a threshold obtained from the Laplace histogram) is applied to each of the 7 equally spaced coronal slices centered on the coronal slice with the maximum body cross-section. The pixels corresponding to the lung are determined as those belonging to clusters satisfying certain criteria (e.g. there should be only two clusters per slice, each with dimensions in a certain range, etc.). As the last step, the whole lungs are segmented using a 3D region growing algorithm (Sensakovic and Armato 2008). Predefined linear attenuation coefficients are assigned to soft and lung tissue (0.096 cm−1 and 0.024 cm−1, respectively) (Schulz et al 2011). An evaluation of this approach against transmission scanning revealed “reasonable quantitative accuracy” with average relative differences less than 10% in most structures except cerebellum, lung, and mediastinum (Schramm et al 2013a).
To minimize the truncation artifacts, potentially affected areas are first determined automatically. Next, the contour of the body is estimated from the non-attenuation corrected PET images. Finally, soft tissue linear attenuation coefficients are assigned to all the areas outside the truncated attenuation map but inside the body contour (Kalemis et al 2013). As artifacts (e.g. residual air cavities, background segmented as soft tissue) were still present in the truncation-corrected attenuation maps, using the attenuation corrected PET images (without truncation correction) and delineating the truncated areas in a volume-oriented fashion was proposed as an alternative to the vendor-provided approach (Schramm et al 2013b).
Siemens Healthineers
In the approach adopted for the Biograph mMR scanner (Siemens Healthineers, Erlangen, Germany), the whole-body is segmented into four tissue classes (background air, lung, fat and soft tissue) from the MR data collected using a 2-point Dixon volume interpolated breath-hold exam (VIBE) sequence (19 seconds acquisition time per bed position). Only the data in the thorax are acquired at breath-hold. In-phase and out-phase as well as water and fat images are generated at each bed position. The voxels corresponding to fat and soft tissue are obtained by applying thresholds to the fat and water images. The lungs are identified by connected component analysis of the internal air cavities. To minimize the misclassification of bone, heart, and aorta as air, a morphological closing filter is applied. Predefined linear attenuation coefficients are assigned to the background air, lung, fat and water classes identified (0, 0.022, 0.085, 0.100 cm−1, respectively). Finally, a 3D Gaussian filter is applied to generate the attenuation map (Martinez-Moller et al 2009) that is combined with the hardware attenuation map during the reconstruction. In the initial evaluation, the largest bias in PET quantification was observed in bone lesions (8%±3% average changes in standardized uptake values, SUVs), followed by neck lesions (4%±2% average SUV changes) and lung lesions (2%±3% average SUV changes) (Martinez-Moller et al 2009). An additional work-in-progress method to generate the head attenuation map that relies on a dedicated MR sequence will be discussed in Section 4.1 as it was not initially approved for clinical use.
The truncation artifact was initially minimized by approximating the missing arms with a pair of cylinders and using the non-attenuation corrected PET images to guide their placement (Delso et al 2010). Subsequently, a modified maximum reconstruction of attenuation and activity (MLAA) algorithm was used to recover the missing data by alternatively updating the activity or attenuation map at each iteration, while maintaining the other one constant (Nuyts et al 1999, 2013). This method was shown to reduce the error in the SUV estimation from 15–50% to less than 5% (Nuyts et al 2010). As the performance of this algorithm is radiotracer dependent, a novel MR sequence was proposed for extending the transaxial field-of-view to 60 cm, an approach called B0 homogenization using gradient enhancement (HUGE) (Blumhagen et al 2013). The MR data collected with the HUGE and Dixon-VIBE sequences are combined to generate more accurate extended attenuation maps (Blumhagen et al 2014). One limitation of this approach was that 20 mm slice spacing was used to minimize the total acquisition time, which led to errors in the body contour estimation. Subsequently, the HUGE acquisition was combined with continuous table motion, which allowed the acquisition of all the data at the isocenter, where the distortions due to B0 inhomogeneity and gradient nonlinearity are known. This reduced the total time required for acquiring the HUGE data on both sides of the body to 40–90 seconds, depending on the size of the subject. A landmark-based registration was implemented to fuse the Dixon- and HUGE-derived attenuation maps. Smaller regional and global bias was noted for this method compared to the MLAA approach (Fig. 2) (Lindemann et al 2017).
Figure 2:
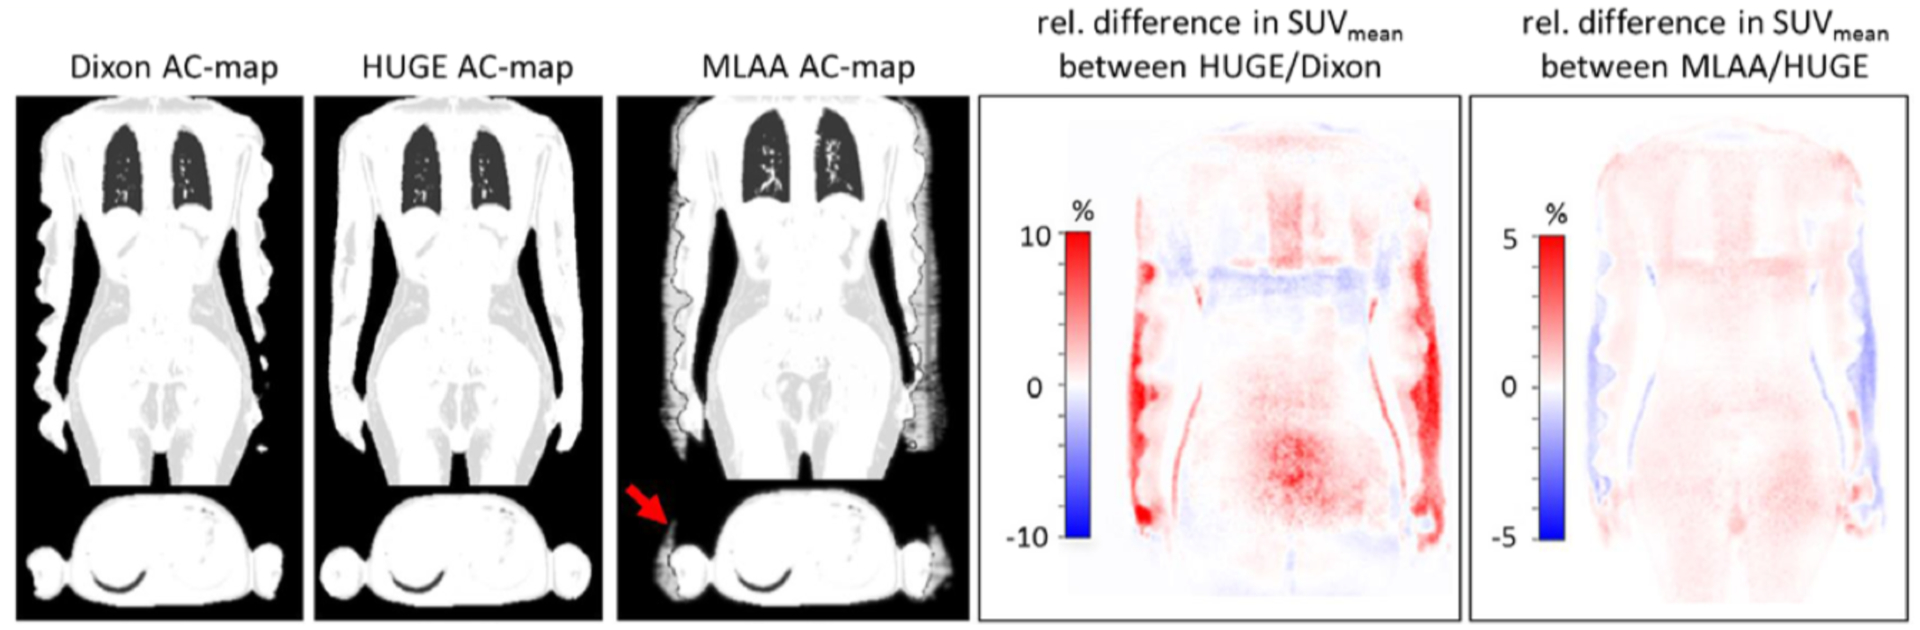
Examples of Dixon-based attenuation map truncation compensation using the HUGE and MLAA approaches and their impact on PET data quantification. Figures originally published in Medical Physics (Lindemann et al 2017).
A model-based segmentation algorithm was later proposed to add bone information to the Dixon-derived attenuation map (Paulus et al 2015). The bone model was obtained offline from 200 Dixon-VIBE MR images and bone mask pairs for each major body bone (i.e. left and right upper femur, left and right hip, spine, and skull). To generate the attenuation map for a new subject, the model MR image is registered to the subject MR image for each major bone individually. In the first stage, a landmark-based similarity registration (Zhan et al 2008) is performed using the out-of-phase and fat MR images. In the second stage, a more accurate intensity-based deformable registration is applied to the in-phase and fat MR images. Finally, the corresponding model bone mask is transferred to the subject space and the continuous-valued bone information is combined with the Dixon-based attenuation map. The first evaluation in 20 subjects showed the model-based method can reduce the bias in bony structures from the −25.5%±7.9% observed with the Dixon-based 4-compartment approach to −4.9%±6.7%. The two methods performed similarly in soft tissue (i.e. ~2.5%±2.5% and ~5%±5% bias in background regions and lesions, respectively) (Paulus et al 2015). For generating the head attenuation map using this model-based method, the linear attenuation coefficient assigned to soft tissue was later changed from 0.1 to 0.098 cm−1. An evaluation in 16 subjects with suspected cognitive impairment showed a −0.3% whole-brain SUVmean bias, with all but three of the brain regions of interest showing less than 5% bias. The authors hypothesized the larger biases in the frontal pole, rostral middle frontal and pars triangularis regions (10.5%, 6.1%, and 7.0%, respectively) were due to variability in frontal bone thickness and sinus pneumatization (Koesters et al 2016).
One of the remaining limitations of this method was that the Dixon images were not of clinical diagnostic quality as they were acquired in coronal orientation and reformatted in axial orientation with 4.1×2.6×3.1 mm3 resolution. Recently, the generalized autocalibrating partially parallel acquisition (GRAPPA) algorithm was extended using controlled aliasing in parallel imaging results in higher acceleration (CAIPIRINHA) to collect high-resolution (1.9×1.4×3.2 mm3) images in the transaxial orientation. The image quality of the CAIPIRINHA-accelerated breath-hold Dixon-VIBE 3D data acquired in 19 seconds per bed position was deemed “good” (4.2±0.8 on a 1–5 Likert scale) and of diagnostic quality (Freitag et al 2017).
After successfully testing the latest implementations of the model-based and HUGE approaches available in the software version E11P in 51 patients with oncological diseases, the authors concluded these methods are ready for clinical use (Oehmigen et al 2018a).
General Electric Healthcare
For the Signa time-of-flight PET/MRI scanner (GE Healthcare, Chicago, IL), the Dixon MR data are acquired using the built-in body radiofrequency coil arrays and a liver-accelerated volume acquisition (LAVA)-Flex sequence in 18 seconds. At each table position, the body contour is first determined and then tissue classes (e.g. lung and trachea or air pockets in the abdomen) are segmented using a phase-field-based approach. The Dixon fat-water images are next used to assign continuous values in the 0.086–0.100 cm−1 range to the soft tissue voxels. A linear attenuation coefficient of 0.0180 cm−1 is assigned to lung voxels. Truncation correction is performed from the time-of-flight non-attenuation corrected PET images. SUVmax biases of 5.7% and 1.5% were reported in the liver and in the FDG-avid features (Wollenweber et al 2013b).
GE supplies an atlas-based method to generate the head attenuation map from the data acquired using the same sequence. The probabilistic atlas was created from the CT images obtained from 50 subjects. All the images were first registered to the reference using an affine followed by a non-rigid B-spline registration and then averaged to obtain the bone atlas. The generation of the attenuation map for a new subject is performed starting from the in-phase LAVA images. The bone information is transformed from the atlas by performing a two-step registration of the bone-enhanced MR and the atlas-derived skull. The same transformation is applied to the non-segmented atlas to obtain the head contour, soft tissue and sinuses using intensity thresholding. Finally, the pseudo-CT obtained by combining the bone and soft tissue information is converted to an attenuation map (Wollenweber et al 2013a, Sekine et al 2016a). The pseudo-CT method tested in 13 subjects was shown to reduce the bias compared to the CT-based approach to 0.2% (Wollenweber et al 2013a). Similar magnitude whole-brain mean bias (2.19%±1.40%) was observed in a different group of 8 patients, with higher values in regions close to the skull base (e.g. cerebellum, temporal lobe, caudate nucleus, putamen, pallidum, thalamus, etc.) (Sekine et al 2016a).
The additional head attenuation map generation method based on the data acquired using a dedicated MR sequence will be discussed in Section 4.1.
United Imaging Healthcare
United Imaging Healthcare (Shanghai, China) recently introduced another integrated PET/MRI scanner called uPMR 790. A 3D Dixon sequence (TR/TE = 4.87/2.24 ms; flip angle = 10°; matrix size = 512×732; pixel size = 0.68×0.68 mm; slice thickness = 2mm; 5-fold acceleration with compressed sensing) is used for attenuation correction purposes. The data are acquired using the head and neck, body array and spine coils. The acquisition time is 70 seconds per bed position in the abdomen and thorax when using triggered acquisition and 35 seconds per bed position in the other regions. The Dixon in-phase are also used as T1-weighted images for diagnostic purposes.
To generate the head attenuation map, four tissue classes (i.e. air, soft tissue, fat and cortical bone) are segmented from the in-phase and out-of-phase images using a deep neural network (U-Net). For the body, the in-phase and out-of-phase images are used to calculate water- and fat-only images and then segmented into air, soft tissue and fat, lung, and bone. Lung segmentation is achieved through a deep neural network (U-Net) that does not require any manual input. A continuous-valued bone component is also generated using a pretrained deep neural network (ResNet). The linear attenuation coefficients used are 0.02, 0.080, 0.096 and 0.161 cm−1 for lung, fat, soft tissue and skull, respectively (Fig. 3).
Figure 3:

Vendor-provided whole-body attenuation correction method. The in-phase, out-of-phase, water-only, fat-only MR images and corresponding attenuation map are shown for one representative subject. Images courtesy of United Imaging.
The attenuation maps for hardware components inside the PET field-of-view, including patient bed and solid MR coils (i.e. spine and head coils), were generated from CT scans and are included in the correction procedure, while flexible surface coils (i.e. body array coil) are ignored (Liu et al 2019).
3.2. Impact of standard MR-based attenuation correction on clinical and research PET data interpretation and quantification
The studies mentioned in the previous section were aimed primarily at assessing the performance of the MR-based attenuation correction methods from a technical perspective. In this section, examples of studies specifically aimed at studying the impact of attenuation correction on clinical and research data interpretation are discussed. Most of these studies followed a single-injection dual-scan protocol (i.e. PET/CT followed by PET/MR examination without an additional radiotracer administration). Hence, the contribution of other technical or biological factors to the observed changes in semiquantitative values could not always be disentangled from the attenuation correction effects. It should also be noted that the performance of MR-based attenuation correction methods was also assessed indirectly in numerous other studies (not discussed here) aimed at comparing the diagnostic performance of PET/CT and PET/MRI modalities in various clinical scenarios (Spick et al 2016).
Brain
Early studies have suggested the misclassification of bone tissue could have a large impact on PET data quantification in neurological studies as it introduces bias both locally, in the adjacent cortical regions and globally, throughout the whole brain (Catana et al 2010a). Indeed, when bone was misclassified as soft tissue in the first method approved for clinical use (Martinez-Moller et al 2009), several groups reported spatially varying bias (Andersen et al 2014) and region-dependent differences (Hitz et al 2014) in patients evaluated for suspected dementia, as well as substantial differences in kinetic parameters (Lassen et al 2017). Only after the model-based approach was introduced on the Biograph mMR scanner, attenuation correction was deemed clinically acceptable for lesions adjacent to bone structures as well as for tumors located within the brain (Rausch et al 2017).
The atlas-based method implemented on the Signa PET/MRI scanner was evaluated in 8 patients without pathological changes in the brain. The visual comparison of the MR- and CT-based attenuation maps revealed an underestimation of the linear attenuation coefficients in the mastoid processes, temporal bone, and base of the skull. A good agreement between the [18F]FDG uptake values was observed across the brain. The whole-brain [18F]FDG uptake was underestimated by 2.19%±1.40%, with larger relative changes observed in structures located in the cerebellum (3.69%±1.43%), and temporal lobe (3.25%±1.42%) (Sekine et al 2016a). The same method evaluated in 50 subjects with cognitive impairment who underwent [18F]FDG examinations showed a bias of 4.5%±6.1%, with overestimations and underestimations close to the vertex and in the cerebellum, respectively (Sgard et al 2019). In the context of Alzheimer’s disease, the diagnostic accuracy and predictive value of FDG PET after MR-based attenuation correction were assessed using simulated data generated by combining the PET error maps that reflect the differences between the PET images obtained using the atlas- and CT-based approaches from 47 patients with 203 ADNI datasets. Although a minor reduction in sensitivity was reported, the accuracy and specificity of the FDG PET obtained using the atlas-based attenuation correction method were maintained (Sekine et al 2020).
The impact of MR-based attenuation correction on the kinetic parameters obtained from dynamic data was also evaluated. For example, when using the Dixon-based approach (Martinez-Moller et al 2009), the PET kinetic parameters obtained from dynamic [18F]FDOPA data analyzed using the Gjedde-Patlak graphical method were overestimated by 5–9% and 7–10% when using the cerebellar cortex and the occipital pole as reference regions, respectively (Cabello et al 2019). In a different study, the total and specific volumes of distribution and occupancy of the serotonin transporter were calculated from the dynamic data attenuation corrected using several methods, including the Dixon-based and bone demonstrator (based on (Paulus et al 2015)). Using the former, a −11%±1.7 mean relative difference in the total volume of distribution with respect to the value obtained with the CT-based approach was observed in the temporal lobe. The differences in specific volumes of distribution were less than 9% but varied in the regions investigated. Using the latter approach, the largest relative differences in the total (−6.0%±1.6%) and specific (−11.1%±5.0%) volumes of distribution were observed in the temporal lobe. The largest relative differences in occupancy were observed in the anterior cingulate cortex for both methods (−8.7%±16.0% and −8.3%± 24.9%, respectively) (Rischka et al 2019).
Head and neck
PET/CT and PET/MRI examinations were performed in 14 patients with head and neck cancers after a single injection of [18F]FDG using the Philips Ingenuity TF PET/MR scanner and the 3-compartment model (i.e. air, lung and soft-tissue) (Schulz et al 2011). Very high correlations were observed between the PET/CT and PET/MRI SUVmax for the primary tumors, lymph nodes and metastatic lesions in the lung, liver and bone. Statistically significant higher values were obtained from the PET/MRI data for lymph nodes and metastatic lesions (Partovi et al 2014).
Carotid PET/MR imaging using the Biograph mMR scanner in patients with increased atherosclerosis risk showed a high correlation between the SUVmean and SUVmax values obtained with the PET/MR and PET/CT, with a small (−0.14 for SUVmax) but statistically significant underestimation when using the former (Ripa et al 2013). The Dixon-based approach was used for attenuation correction. As pointed by the authors, the MR allowed the delineation of the carotid vessel wall, which enabled a more detailed analysis of the [18F]FDG accumulation in the vessel wall and the possibility of improving the quantification by performing MR-based partial volume effects correction.
A similar study performed using the Philips Ingenuity TF PET/MRI scanner and the default attenuation correction procedure demonstrated excellent correlation with the values obtained using the PET/CT scanner, with percent differences of 5.4% and 2.7% in the left and right carotid arteries, respectively (Bini et al 2015). Subsequently, the same group demonstrated the feasibility of adding a bone compartment to a continuous-valued version of the Dixon-based 4-compartment attenuation map. Although this approach resulted in the best correlation and lowest mean difference with respect to the CT-based method, the authors concluded the quantification errors due to bone tissue misclassification does not substantially affect the quantification in the carotid arteries and suggested the more straightforward default method is more appropriate for clinical use (Bini et al 2016).
Heart
The Dixon-based 4-compartment approach implemented on the Biograph mMR scanner was evaluated for cardiac PET/MRI studies by several groups. No differences in myocardial [18F]FDG uptake were observed in 10 myocardial infarction patients (Nensa et al 2013). In a different study, the data acquired with a chest phantom and 30 oncologic patients who underwent separate PET/CT and PET/MR examinations were used for the same purpose. The phantom study revealed a minimal 3% underestimation due to the presence of the phased arrays MR coil. For lung linear attenuation coefficients ranging from 0.0224 to 0.0289 cm−1 (corresponding to HU values ranging from −767 to −699), the difference in myocardium SUV estimation was 2.2%. No statistically significant differences between the mean myocardial SUVs obtained by PET/CT and PET/MR were observed (Lau et al 2017). A similar study performed on the GE Signa PET/MRI scanner in 23 oncological patients showed a minimal 2.08% underestimation of the myocardial tracer uptake when using the default Dixon-based method compared to the values obtained by PET/CT. This bias was further reduced to 1.29% with the addition of time-of-flight information. Excellent correlation with narrow limits of agreement was noted between the two modalities on a segmental basis (Vontobel et al 2015).
The authors of a recent study performed in 20 consecutive heart failure patients who underwent myocardial perfusion and metabolism studies on the Biograph mMR scanner reported susceptibility artifacts in 50%, truncation artifacts in 100%, respiratory misalignment in 90% and tissue inversion in 30% of the patients. Large regional differences in uptake were observed after applying simple corrections for the susceptibility artifacts. Although no significant changes in the clinical assessment were seen in 85% of the patients, false-positive findings were reported in 3 patients when not accounting for these artifacts. The average misalignment due to respiratory motion was 7±4 mm, with misalignment larger than 10 mm leading to a severe underestimation of the myocardial uptake (i.e. up to 291% in the anterior wall) (Lassen et al 2019). In another study, mismatches between the attenuation map obtained using the breath-hold Dixon sequence and the emission data were also reported, leading to truncation of the PET data in the lateral wall. The authors proposed an alternative motion-robust multi-echo MR sequences that allows the generation of attenuation maps with multiple tissue classes (i.e. water, fat, lung and background air) (Robson et al 2020). It should be noted that minimizing the mismatch between the attenuation map and the emission data by performing MR-assisted PET motion correction is possible in an integrated PET/MRI scanner (Kolbitsch et al 2018), although implementing such an approach for patients with irregular breathing patterns or when using breath-hold protocols (common in cardiac MRI studies) is challenging due to the breathing mismatches between the PET and MRI data acquisitions.
Compared to the standard Dixon-VIBE approach, both the HUGE and MLAA-based truncation artifact correction were shown to lead to increases (5.4% ± 2.0% and 8.5% ± 3.4%, respectively) in the PET signal over the left ventricle in 32 patients. A limitation of this study was that the CT-based approach was not used as the gold standard. However, this allowed the authors to minimize the impact of other factors (e.g. different patient positioning for the PET/CT and PET/MR examinations, tracer kinetics in the case of sequential acquisitions, image registration) and focus only on the impact of truncation correction and bone segmentation (Lindemann et al 2019b).
Lung
The performance of the Dixon-based method implemented on the Biograph mMR scanner for the detection and characterization of pulmonary lesions was evaluated in 41 patients with known or suspected malignancy. The same number of lesions (including 10 lesions smaller than 1 cm in diameter) were detected in the PET images obtained with the two modalities. There was a strong correlation between the SUVs of lung lesions and no statistically significant differences between the two modalities (Rauscher et al 2014). In a different study, 121 oncologic patients were analyzed retrospectively. A strong positive correlation between the SUVmax and SUVmean between PET/MRI and PET/CT was found but both measures were significantly higher for the former (Sawicki et al 2016a). On the other hand, the SUVmax obtained from 108 pulmonary tuberculosis lesions were significantly lower on PET/MR than PET/CT (Thomas et al 2017). A strong correlation between the SUVmax determined using PET/MR and PET/CT in 105 lung metastases (from breast cancer) was reported, with the former values being significantly higher (5.6 ± 2.8 vs 4.9 ± 1.8, p=0.001) (Sawicki et al 2016b).
In a different study, 11 patients with advanced non-small cell lung cancer underwent up to five PET/MRI examinations on the Biograph mMR scanner. This allowed the authors to assess the presence of artifacts in the Dixon-based attenuation maps, their impact on the reconstructed PET images and the scan-rescan SUV agreement. Critical artifacts (i.e. trachea artifact, tissue misclassification, body contour, metal, respiratory and lung border artifacts) that could introduce substantial bias were seen in 30% of the maps analyzed. As truncation artifacts were seen in all the cases, they were not even included in the analysis. The scan-rescan variation observed was within ±20% in 95% of the cases, with higher values in those affected by respiratory motion (Olin et al 2018). 25 lung cancer patients who underwent two examinations on the Biograph mMR scanner were included in another study aimed at investigating the frequency and test-retest (i.e. different time points, same imaging session) repeatability of attenuation correction artifacts. Like the earlier studies, truncation artifacts were presented in all the attenuation maps, while tissue inversion and susceptibility artifacts were seen in 52% and 12% of the attenuation maps, respectively. The susceptibility artifacts were seen in all the retest scans, while tissue inversion artifacts were reproduced in the retest scans in 37% of the patients. Correcting the attenuation maps for the missing bone (Paulus et al 2015) and truncation (Nuyts et al 2013) artifacts had minimal effect on the lung tumor SUVs. Susceptibility artifacts correction (Lassen et al 2019) led to up to 28.7% relative differences in SUVmax, with large test-retest variability (Kuttner et al 2019).
The results of analytic simulations suggest the quantification errors when using the 4-compartment attenuation maps that ignore bone can only minimally be reduced in lung tissue (from −3.4% ± 11.5% to −2.9% ± 7.1%) when incorporating the time-of-flight information (Fig. 4) (Mehranian and Zaidi 2015b).
Figure 4:

Relative change maps demonstrating the bias introduced by the 4-compartment model versus the CT-based approach and the impact of using the time-of-flight information for two patients with high (left) and low (right) body mass indexes. Figure originally published in the Journal of Nuclear Medicine (Mehranian and Zaidi 2015b)
Breast
A comparison of the quantification of breast cancer lesions was performed in 36 consecutive patients who underwent [18F]FDG PET/CT followed by PET/MRI examinations on the Biograph mMR scanner. No statistically significant differences in SUVmax, SUVmean or metabolic tumor volume were seen in the 25 primary lesions visualized. SUVmax and SUVmean were 54% and 26% higher in the PET/MRI than the PET/CT measurements (Pace et al 2014).
It should be noted that dedicated breast MR coils may be needed to obtain the highest MR performance required for the characterization of the primary tumor. A novel 16-channel RF breast coil was designed for and successfully tested with the Biograph mMR scanner in phantoms and 10 female patients diagnosed with local breast cancer (Oehmigen et al 2016).
Abdominopelvic organs
The impact of MR-based attenuation correction on the semiquantitative evaluation of lesions in abdominopelvic organs was evaluated by several groups. For example, 45 patients with abdominal and pelvic cancers underwent a single-injection dual-imaging protocol that included PET/CT and PET/MR examinations, using the Philips TF PET/MR scanner. Strong correlations were observed between the SUVmax and SUVmean in the 49 lesions observed with both modalities. Both values were significantly higher for PET/CT (11.94±6.96 vs. 11.00±7.65, p=0.004 and 7.72±4.70 vs. 7.04±4.89, p=0.001 for SUVmax and SUVmean, respectively). The SUVmean of background organs (liver, spleen, muscle and bone marrow) were also higher for PET/CT (0.97±0.11 vs. 0.61±0.13, p=0.001) (Xin et al 2016).
Studies aimed at comparing the diagnostic performance of PET/CT and PET/MRI in lymphoma patients, reported strong correlation between the SUVs obtained from the PET data corrected using the 4-compartment attenuation correction method and the CT-based approach (Atkinson et al 2016, Giraudo et al 2016, Afaq et al 2017). These results are particularly relevant as a large number of nodal and extra-nodal lesions located throughout the body were included in the analyses.
18 patients with gynecological malignancies completed a single-injection dual-imaging protocol using the Biograph mMR scanner and the 4-compartment Dixon-based approach. Statistically significant differences in SUVmax (21.5±10.8 vs. 16.5±7.1), with decreased values were observed for PET/MRI (Schwartz et al 2018).
The model-based approach (similar to (Paulus et al 2015) but using CAIPIRINHA Dixon VIBE data) was assessed in 26 patients evaluated for prostate cancer. They were first scanned using the Biograph mMR scanner after the administration of 68Ga-PSMA-11 and underwent an additional PET/CT examination (Domachevsky et al 2020). Statistically significant higher SUVs were observed after including the bone in the attenuation map in the prostatic lesions (12%, p=0.005) and normal prostatic tissue (8%, p=0.003). There was a trend for higher correlation with the CT-derived values for the 5- vs 4-compartment model in all the regions investigated (e.g. gluteus maximus, sacrum, normal prostatic tissue, intra prostatic cancer, metastatic lesions). Smaller but still statistically significant differences in SUVmax (2.5%, p<0.001) between the two MR-based approaches were reported in a different study in which primary and recurrent prostate cancer patients underwent [18F]fluciclovine PET/MRI studies. Interestingly, bone registration errors that led to bias in the 4.4–20.2% range were observed near the primary tumor in 64% of the cases (Elschot et al 2018).
Bone
In one of the largest studies aimed at comparing PET/CT and PET/MR for the evaluation of malignant bone lesions, 98 bone lesions (located in the cervical, thoracic or lumber spine, pelvis, upper extremity or shoulder, legs, ribs or sternum, etc.) and 630 regions of normal bone were analyzed. The study was performed using the Biograph mMR scanner and the 4-compartment Dixon-VIBE method. The SUVmean and SUVmax obtained from the two modalities were significantly correlated, but they were significantly lower (12.4% ± 15.5% for bone lesions and 30.1% ± 27.5% for normal bone) for PET/MR. Based on these findings, the authors concluded that the misclassification of cortical bone does not have a clinical impact on the detection of [18F]FDG bone lesions, although they recommend using the same scanner for longitudinal studies (Eiber et al 2014). The diagnostic value of the morphological MRI data was considered superior to CT for providing anatomical correlates to the [18F]FDG lesions. The diagnostic confidence in the detection of bone metastases was also deemed superior for PET/MRI compared to PET/CT after the analysis of 86 [18F]FDG-positive bone lesions in patients with various malignant tumors (Samarin et al 2015).
Assigning a higher attenuation coefficient to the bone tissue identified as those voxels with a SUV higher than 2 from the [18F]NaF images led to reductions of SUVmax in pelvic and spinal lesions of 8.8% ± 2.7% and 8.1% ± 1.9%, respectively, compared to the 4-compartment approach (Schramm et al 2015). Similarly, a mean increase in SUVmax of 5.4%±6.4% (range −4.3% to 28.4%) was observed in 69 bone lesions after including the bone model and addressing the truncation artifacts using the HUGE method (Grafe et al 2020).
The results of analytic simulations suggest the quantification errors when using the 4-compartment attenuation maps can be reduced in bone tissue from −21.8% ± 2.9% to −15.3% ± 2.3% when incorporating the time-of-flight information (Fig. 4) (Mehranian and Zaidi 2015b).
4. Advanced attenuation correction methods for use in research PET/MRI studies
4.1. Direct bone tissue imaging using dedicated MR sequences
Several dedicated MR sequences have been proposed for imaging tissues with short T2* relaxation time: ultra-short echo time (UTE) (Reichert et al 2005, Robson and Bydder 2006), short-echo time (STE) and zero echo time (ZTE) (Weiger et al 2013, Wiesinger et al 2016b). The methods proposed for using the data acquired with these dedicated sequences for generating attenuation maps in the head, thorax and pelvis are discussed in this section.
Head
In the case of the UTE acquisitions, the free induction decay is sampled as soon as possible after the radiofrequency excitation (e.g. less than 200 μs) to minimize the signal loss. Early work using dual- and triple-echo UTE sequences (Catana et al 2010b, Keereman et al 2008, Berker et al 2012) allowed the generation of segmented head attenuation maps by identifying the voxels corresponding to bone tissue as those showing the largest intensity differences in the data acquired at different echo times. An approach based on dual-echo UTE data was also provided as a work-in-progress package on the Biograph mMR scanner. Subsequently, combining the dual-echo UTE and T1-weighted MR data using probabilistic atlases allowed the generation of substantially improved segmented attenuation maps (Poynton et al 2014). However, one of the main limitations of early generation UTE-based methods was that only three compartments (i.e. soft tissue, bone, and air cavities) could be identified. An approach to synthesize CT-like images from the UTE data used matching UTE-CT patches from a reference dataset. For each subject UTE patch, several corresponding CT reference patches were selected and combined based on a statistical model (Roy et al 2014). Alternatively, continuous-valued bone linear attenuation coefficients were obtained from the dual-echo UTE images by postprocessing the data obtained at each echo (Cabello et al 2015).
In another approach to generate continuous-valued linear attenuation coefficients for bone, regression analysis was performed to identify a five-parameter sigmoid model to map the parameters derived from the UTE data to HU values (Juttukonda et al 2015). To further reduce the tissue misclassification observed when global thresholds are applied to the UTE-derived parameters, a region-specific optimization of continuous linear attenuation coefficients based on UTE (RESOLUTE) was suggested (Ladefoged et al 2015). Specifically, different attenuation coefficients were automatically assigned to several tissue interfaces and classes (i.e. air, air/tissue, air/low-density bone, soft tissue, cerebral spinal fluid, brain, air/bone, tissue/bone, bone) (Fig. 5). To obtain continuous values for bone tissue, a mapping from R2* measures (derived from the UTE images (Keereman et al 2010)) to HU values was obtained from 10 subjects. A quantitative evaluation of the method in a different group of 154 patients showed the average error in the brain was 0.1%±2.8% (mean absolute error 3.4%±1.6%), which was substantially better than the performance of the UTE- and Dixon-based approaches provided by the manufacturer.
Figure 5:

UTE-based head attenuation map generation. The attenuation maps generated for a representative subject using the vendor provided UTE- (A), RESOLUTE- (B), and CT-based (C) approaches are displayed in 3 orientations. Figure originally published in Physics in Medicine and Biology (Ladefoged et al 2015).
Continuous-valued attenuation maps were also obtained from dual-echo UTE and T1-weighted MR data using probabilistic atlases (Chen et al 2017), from UTE data by combining Gaussian mixture models with probabilistic tissue maps (Baran et al 2018) or from accelerated UTE and multi-echo Dixon acquisitions (Han et al 2020).
One limitation of UTE-based approaches is the long acquisition time. To address this issue, dual-echo ramped hybrid encoding was proposed to acquire the data in 35 seconds, while maintaining high spatial resolution (1 mm3). Using this approach, PET errors of less than 1% were reported (Jang et al 2018a).
Although promising results have been obtained using UTE data, these sequences are not yet widely available or used clinically. As the signal from bone can also be detected at short echo times (i.e. 0.5–1ms), STE sequences have been proposed as an alternative. These sequences allowed the generation of segmented attenuation maps using simple thresholding (Khateri et al 2013). For increased accuracy, the STE and Dixon data were later combined using a segmentation protocol based on fuzzy C-means clustering and morphological operations (Khateri et al 2015). More recently, advanced level-set segmentation was used to reliably generate segmented attenuation maps only from the MR data acquired at a single STE (Fathi Kazerooni et al 2017).
ZTE sequences were also developed for imaging bone tissue (Fig. 6). Instead of relying on the differences between the signal intensities at two or more echo times, ZTE sequences allow bone identification from a single echo proton density-weighted acquisition (Wiesinger et al 2016b). A careful analysis of the skull segmentation accuracy revealed the ZTE-derived bone masks were more similar to the CT-derived bone mask than previously reported for UTE acquisitions throughout the whole head, although some areas with a mixture of tissues (e.g. sinuses and inner ear) remained challenging (Delso et al 2015). One disadvantage of the first implementation of the ZTE sequence was the relatively long acquisition time (i.e. 172 seconds). Accelerated versions (i.e. less than 50 seconds) subsequently implemented by reducing the image resolution were shown to produce similar (Okazawa et al 2019) or better (Sekine et al 2016c) results than the atlas-based approach provided by the manufacturer. To decrease the tissue misclassification, a sinus/edge correction method consisting of morphological processing and edge detection was implemented. This method that does not rely on anatomical prior knowledge outperformed the standard ZTE- and atlas-based methods in terms of PET quantification accuracy and precision. Of particular relevance, the bias in the cerebellum was reduced from 8.1%±3.5% to 0.6%±2.7% after performing this additional correction (Yang et al 2017). A similar approach was shown to reduce the PET bias to −0.04%±1.68% (as well to allow MR-guided radiotherapy planning with absolute dose difference over the target volume of 0.23%±0.42%, which is well below the acceptance criteria) (Wiesinger et al 2018).
Figure 6:

ZTE-based head segmentation results in a representative subject. The RF bias‐ corrected, inverse log‐scaled images, corresponding segmentation results are shown in the first three rows and 3D renderings of the skull and the head contour are displayed in the last row. Figure originally published in Magnetic Resonance in Medicine (Wiesinger et al 2016b).
Other improvements have been suggested for further addressing the issues noted in the ZTE-based attenuation maps. For example, the relationship between the ZTE intensities and HU values was determined and used to generate continuous linear attenuation coefficients for the bone tissue to account for intra- and inter-subject variability in bone density. Additionally, to minimize the misclassification of the teeth, which have low intensities similar to air in the ZTE images, a teeth mask obtained by registering the Zubal phantom template was applied. Furthermore, the spatial resolution was increased from 2.4 to 1.6 mm to minimize partial volume effects. Interestingly, this method was also successfully used to generate an attenuation map for baboons (Khalifé et al 2017).
The ZTE-based approach was shown to have lower interindividual and inter-regional variabilities and increased accuracy compared to the default atlas-based method even in difficult scenarios such as evaluating the pituitary gland, located adjacent to the nasal passages and sphenoid sinus (Delso et al 2019). It was also successfully used to improve the PET data quantification and minimize the impact of metal artifacts in patients with oral cavity cancer (Tsujikawa et al 2020).
A comparison to transmission data revealed a high correlation between the SUVs obtained using the ZTE- and atlas-based attenuation correction methods provided by the manufacturer, although a 6–8% biased was also noted, suggesting the linear attenuation coefficients used in the MR-based approaches are higher than those obtained from the transmission images (Sousa et al 2018). The ZTE-based attenuation correction approach implemented on the Signa GE PET/MRI scanner is now approved for clinical use.
Thorax
Progress has also been made in optimizing UTE sequences for pulmonary applications (e.g. idiopathic pulmonary fibrosis and cystic fibrosis) (Torres et al 2019) and these methods could be used for MR-based attenuation correction. For example, a method to generate synthetic CT images of the thorax from UTE and Dixon data was proposed (Su et al 2019). As a first step, the air voxels outside and inside the subject are identified by thresholding the sum of the images acquired at the three echoes (0.14, 1.14 and 2.14 ms) and the water-fraction images, respectively. In the next step, fuzzy-C-means clustering is used to assign all the voxels to one of the six clusters based on the combination of the Dixon-water, Dixon-fat and water fraction values. A lung mask is generated next by thresholding the R2* (=1/T2*) images and applying morphologic operations. Finally, fixed HU values are assigned to the voxels in each of the six classes identified corresponding to air, lung, fat, soft tissue, spongeous and dense bone. As this study was performed in healthy volunteers, CT images were not available and reference CT images generated using a model-based method from the XCAT phantom were instead used for validation. The synthetic and reference thoracic CT images had a mean absolute difference of less than 50 HUs (Su et al 2019). Future studies are needed to validate MR-based attenuation correction methods in patients with lung parenchymal changes, especially given the recent development of a collagen-targeted radiotracer and the potential to combine these measurements with MR-derived parameters in idiopathic pulmonary fibrosis patients (Montesi et al 2019, Desogere et al 2017).
Pelvis
The data collected using dedicated MR sequences have also been used to generate pelvis attenuation maps. A patient-based method was proposed to segment the images obtained using an STE sequence into five classes (cortical bone, background air, internal air, fat and soft tissue). As a first step after applying MRI inhomogeneity correction, a spatial fuzzy C-means algorithm was applied to cluster the voxels into the bone-air, soft tissue and fat classes. The cortical bone internal air cavities are separated by analyzing the morphological characteristics of the objects identified in the bone-air cluster (e.g. the pelvis bony structures are symmetric with respect to the midline) (Shandiz et al 2017). Subsequently, the same group proposed using a time-resolved angiography with interleaved stochastic trajectories sequence to acquire higher-quality STE data in the pelvis and a hybrid segmentation protocol that also uses the longer echo time data. Numerical simulations suggest using the resulting segmented attenuation maps for PET attenuation correction would lead to mean relative errors of ~14% in the bone regions, substantially lower than the ~36% bias noted when misclassifying cortical bone (Shandiz et al 2018).
Translating the UTE- and ZTE-based methods to the pelvis was more difficult because of the larger field-of-view. A hybrid ZTE/Dixon-based method was implemented to generate continuous-valued attenuation maps (Fig. 7). Bone tissue was segmented from the ZTE data using automatic (i.e. filtering, rescaling, thresholding and morphologic) operations and manual correction. The normalized ZTE values corresponding to the segmented bone were mapped to HU values based on a model generated from seven co-registered CT and ZTE pelvis datasets. The quantification root-mean-square error was reduced compared to the Dixon-based approach from l1.02% and 7.79% for bone and soft tissue pelvic lesions to 3.28% and 3.94%, respectively (Leynes et al 2017). Preliminary results suggest a ZTE approach could also be used in other parts of the body (Wiesinger et al 2016a).
Figure 7:

ZTE-based pelvis attenuation map generation. Bone segmentation process (a) and 3D renderings of the CT- (b) and ZTE-segmented (c) bone are shown. Figures originally published in Medical Physics (Leynes et al 2017).
4.2. Atlas/template/patch/model-based methods
Atlas/template-based
Methods to generate attenuation maps from the MR images were proposed even before the first integrated PET/MRI human scanners were developed. For example, a template obtained by anatomic standardization of the transmission or CT images (Montandon and Zaidi 2005, Rota Kops and Herzog 2008) was brought into the subject space by registration to the morphological MR images. Local pattern recognition was combined with atlas registration to minimize the impact of image registration errors (Hofmann et al 2008). A multi-algorithm approach has allowed the use of a multimodality optical flow deformable model to warp a CT-based atlas to the patient-specific MR images (Schreibmann et al 2010).
More recently, an SPM-based method was implemented for generating head attenuation maps from a single morphological MRI dataset obtained with the MPRAGE sequence routinely collected in research neurological studies (Izquierdo-Garcia et al 2014). After intensity normalization, the MR images are segmented into six tissue classes using the “New Segment” SPM tool and then registered to a previously created template using a diffeomorphic non-rigid image registration algorithm (SPM DARTEL). The inverse transformation is applied to obtain the pseudo-CT images in the subject space. Using this approach, the voxel- and regional-based quantification errors compared to the scaled CT method were 3.87±5.0% and 2.74±2.28%, respectively. This method was also demonstrated to work in patients with modified anatomy (e.g. glioblastoma patients post-surgery) (Fig. 8) (Izquierdo-Garcia et al 2014). Another approach also uses the “new segment” SPM tool and the ICBM tissue probabilistic atlas to generate a bone probability map from the MPRAGE images. These maps are then postprocessed and combined with the Dixon-based maps to generate the final segmented attenuation map for the subject (Anazodo et al 2015).
Figure 8:

Head attenuation correction in a patient with a brain tumor and skull surgical alternations: MPRAGE images (A), pseudo-CT (B) and CT-based (C) attenuation maps. Figures originally published in the Journal of Nuclear Medicine (Izquierdo-Garcia et al 2014).
The training data could also be used to generate multiple atlases, consisting of pairs of CT and T1-weighted MR images. All the MRIs from the database are registered (affine followed by non-rigid registration) to the target MRI and the resulting transformation is used to map the corresponding atlas CTs to the target subject. The pseudo-CT is synthesized based on local morphological similarity measures that monitor the quality of the match between the target MRI and each of the registered MRIs. The CT value at each voxel is obtained from the atlas CTs by applying a weighted average, with the weights being related to the registration accuracy (Burgos et al 2014). The multi-atlas approach was shown to reduce the bias by 20% compared to the single-atlas method, with significant improvements being reported in the temporal lobe and cerebellum (Sekine et al 2016b). Similarly, the multi-atlas method performed slightly better than the single-atlas one (Izquierdo-Garcia et al 2014) in patients scanned with [18F]FDG and [18F]florbetapir, with reported average differences compared to the CT-based approach of less than 2% for both tracers (Burgos et al 2015).
The bias in the estimation of the volumes of distribution and nondisplaceable binding potential of [11C]Cimbi-36 obtained when using the multi-atlas (Burgos et al 2014) approach was also evaluated. Kinetic modeling was performed from the dynamic data generated using the MR- and CT-based attenuation correction approaches with the simplified reference tissue model and the cerebellum as the reference region, and the standard two tissue compartment model. The percent differences in regional uptake values ranged from 1%±8% in the temporal lobe to −7%±−6% in the cerebellum. The percent differences in PET outcome measures were below 6% in all the regions investigated and no statistically significant bias was observed for any of the outcome parameters (Mansur et al 2018).
The impact of using the vendor-provided methods, as well as the dual-UTE (Cabello et al 2015) and multi-atlas (Burgos et al 2014) approaches were evaluated using dynamic [18F]FDOPA data analyzed using the Gjedde-Patlak graphical method. The PET kinetic parameters obtained using non-vendor provided methods agreed within 2% when using the cerebellar cortex as the reference region (and within 6% when using the occipital pole as the reference region) (Cabello et al 2019).
Other approaches have been suggested for performing the registration of the atlas to the target MRIs or for generating the target CT. For example, the deformed CT atlases were first segmented into three tissue classes, majority voting was used to assign a tissue class label to each voxel and the final value was determined by averaging the HU values of the CT atlases belonging to the majority class for that particular voxel (Mérida et al 2017, Merida et al 2015). Using this approach called MaxProb, the mean bias in FDG quantification was less than 1% for the majority of the brain regions analyzed and the results were better than those obtained using a single-atlas approach (Schreibmann et al 2010). Similarly, using dynamic [18F]MPPF data, regional errors ranging from −1 to +3% in the nondisplaceable binding potential were noted when using the multi-atlas method (Mérida et al 2017). In a different implementation, a deformable registration algorithm was used to register each of the ten atlas MRI volumes to the target MRI. The resulting displacement fields were applied to the corresponding atlas CTs. However, instead of simple averaging, the deformed CT volumes were iteratively registered to the voxel wise mean obtained at the previous iteration (Sjölund et al 2015).
Patch-based
An obvious limitation of atlas-based approaches is that they require computationally intensive image registration between the atlas(es) and target MRI volumes. As an alternative to intensity-based registration, the HU values can be estimated by identifying similar patterns of intensities (“patches”) in the neighborhood of a particular voxel. Analogous to atlas-based methods, the patch-based approaches use databases consisting of matching MR and CT patches. The patches can be obtained from MR data collected using UTE (Roy et al 2014) or standard MR sequences (Andreasen et al 2015, Torrado-Carvajal et al 2016). The assumption is that after intensity-normalization, the composition of tissues determines the pattern observed in the patches. Instead of selecting a single patch from the database, two “nearest” matching patches can be combined using a Bayesian framework (Roy et al 2014) or the similar patches can be extracted from the database averaged using similarity-weighs to assign the HU value (Andreasen et al 2015). Instead of computing the similarity between the subject and each of the target patches from the database, the search can be restricted to those patches in the neighborhood of a certain voxel (e.g. 11×11×11 voxels). The HU value can then be obtained as a weighted linear groupwise combination of these patches, with the weights reflecting nonlocal similarities between the voxels in the subject and target images (Fig. 9). As the search process is highly parallelizable, the computation time can be substantially decreased by implementing the algorithm in a graphical processing unit (Torrado-Carvajal et al 2016).
Figure 9:

Patched-based pseudo-CT synthesis method. The patient specific MR, CT and pseudo-CT images in three orientations are shown on the left. The corresponding PET images and relative change maps are shown on the right. Figures originally published in the Journal of Nuclear Medicine (Torrado-Carvajal et al 2016).
Model-based
A registration technique was initially proposed to include bone tissue in the attenuation maps by comparing the subject MRI to the CT from a database using similarity metrics (e.g. sex, height, weight, age, body and lung geometry, fat to lean tissue ratio, etc.) (Marshall et al 2013). The subject MRI segmented into three tissue classes (Marshall et al 2011) was registered to the most similar CT using rigid and nonrigid components. Finally, the bones from the registered CT were added to the segmented pseudo-CT. Using this approach, the relative errors observed in bone tissue was reduced from −37% to −8% to −3% to 4% (Marshall et al 2013).
The approach currently implemented on the Siemens Biograph mMR scanner and described in Section 3.1 also belongs to this category (Fig. 10) (Paulus et al 2015).
Figure 10:

Model-based approach for incorporating bone in the whole-body attenuation maps. Figure originally published in the Journal of Nuclear Medicine (Paulus et al 2015).
4.3. Emission-based techniques
A radiotracer-specific approach to minimize the impact of bone tissue misclassification is to segment it from the [18F]NaF emission data. Assigning a higher linear attenuation coefficient to the voxels segmented from the [18F]NaF images was shown to reduce the quantification errors in pelvic and spinal lesions (Schramm et al 2015) as well as carotid wall (Karakatsanis et al 2019).
Throughout this review, photon attenuation has been presented only as an undesirable effect. However, the fact that photons are attenuated means the emission data inherently contain information about the attenuation properties of the tissue. Therefore, approaches to simultaneously (or jointly) reconstruct the activity and attenuation have been suggested over the last four decades (Censor et al 1979, Lange and Carson 1984, Nuyts et al 1999, Salomon et al 2011). In the context of PET/MRI, the MR information can be used to guide this joint reconstruction. Combined with the time-of-flight information (also shown to reduce the quantification bias and impact of artifacts (Mehranian and Zaidi 2015b, Boellaard et al 2014)), the joint reconstruction techniques have been shown to improve the accuracy of the MR-based estimation of the attenuation maps in the lung (Mehranian and Zaidi 2015a) and brain (Mehranian et al 2017). The algorithms for MR-based attenuation map generation and joint estimation of activity and attenuation can also be used synergistically. Specifically, the MR-derived information can preferentially be used in soft tissue and the joint estimation be given more weight in regions with unreliable MR signal (e.g. around metallic implants, internal air, bone, lung, etc.). This method was shown to work not only with [18F]FDG but also with other radiotracers with more specific uptake such as [68Ga]DOTATOC and [18F]Fluoride using data acquired with the GE Signa PET/MR scanner (Ahn et al 2018). A similar reconstruction technique was also proposed to improve the accuracy of the vendor-supplied approaches using non-time-of-flight brain data. The information obtained from the UTE-based attenuation map and the T1-weighted MR image intensity are used with a modified version of the maximum likelihood for transmission algorithm (MLTR) to obtain an attenuation map that is more consistent with the emission data. Furthermore, to minimize the cross-talk in the brain and address the scaling problem, information from the MLTR-derived attenuation map is combined with the T1-weighted MR image intensity (Benoit et al 2016).
A method that performs a joint reconstruction of radioactivity and attenuation from the non-time-of-flight emission data and an incomplete MR-based attenuation map was also proposed to determine the position, shape and linear attenuation coefficient for metallic implants. As mentioned in Section 2, the metallic implants lead to susceptibility artifacts in the MR images that propagate as signal voids in the corresponding MR-based attenuation maps. As the attenuation map has to be estimated only in the signal void and prior knowledge is available about the metal implants (i.e. zero activity and a linear attenuation coefficient higher than that of body tissue), the estimation of the attenuation map from the emission data becomes less ill-posed. This method was successfully tested in 11 subjects with various types of implants (e.g. hip chromium alloy and titanium replacements, femur replacement, titanium spine screws, dental implants) who underwent [18F]FDG-PET/MRI examinations on the Biograph mMR scanner (Fig. 11) (Fuin et al 2017).
Figure 11:

Implant PET-based attenuation map completion (IPAC) using a joint reconstruction of radioactivity and attenuation algorithm. Dixon-, CT-, and IPAC-derived attenuation maps of a right hip metallic endoprosthesis are shown on the left and the corresponding PET images on the right. Figures originally published in the Journal of Nuclear Medicine (Fuin et al 2017).
While transmission-based techniques are still considered the true gold standard for PET attenuation correction, traditional rotating transmission sources have not been integrated into the PET/MRI scanners due to obvious engineering challenges and the desire to reduce the radiation exposure. As such techniques would be valuable for improving and validating MR-based approaches, several stationary transmission sources have been suggested as alternatives. For example, simulations were performed to demonstrate that an annulus shaped transmission source filled with [18F]FDG that covers the entire axial field-of-view could be used to acquire transmission and emission data simultaneously in a scanner with time-of-flight capabilities (Mollet et al 2012). The time-of-flight information should allow, in principle, the identification of the events originating from the transmission source, although a final scaling was shown to be required (Defrise et al 2012). This method was subsequently shown to minimize the artifacts present in the MR-based 3-compartment method and reduce the bias in PET data quantification in lung, soft and bone tissue (Mollet et al 2014). Recent improvements in detector time-of-flight and count-rate performance could be used to minimize the cross-contamination of the transmission and emission data, and the dead-time effects and randoms cross-talk, respectively. In the case of scanners without time-of-flight capabilities (e.g. Biograph mMR), a single torus source filled with [18F]FDG was shown to allow the acquisition of highly accurate transmission images before radiotracer administration (Bowen et al 2016). As another alternative to incorporating a full transmission source in an integrated PET/MRI scanner, targeted positron beams generated from several fixed line sources can provide regional transmission data that can be combined with the estimated MR-based attenuation map using a modified MLAA algorithm (Watson 2014).
Finally, a transmission source that does not require any added hardware is provided by the intrinsic background radiation from Lu-176. This isotope has 2.6% abundance in the naturally occurring lutetium that is used to manufacture the scintillator crystals in current generation PET scanners. The 202 and 307 keV gamma-rays emitted as part of the Lu-176 beta decay could be detected simultaneously with the positron emission events in a time-of-flight scanner (Rothfuss et al 2014).
5. Latest generation deep learning-based attenuation correction methods
Although machine learning approaches have been suggested for generating attenuation maps from the early days of clinical PET/MRI (e.g. pattern recognition combined with atlas registration (Hofmann et al 2008, 2011), Gaussian mixture regression model (Johansson et al 2011), support vector regression technique (Navalpakkam et al 2013), structured random forests (Huynh et al 2016), multi-resolution regional learning (Shi et al 2017), feature matching with learned nonlinear local descriptors (Yang et al 2018b), etc.), the focus in this section will be on the recently introduced deep learning methods that are becoming increasingly popular as they have the potential to address many of the limitations of the previously discussed techniques, particularly in terms of accuracy and speed.
5.1. Head
In one of the first implementations, a 2D deep convolutional neural network adopted from the UNet architecture (Ronneberger et al 2015) was trained to generate synthetic CT images from T1-weighted MR images (Han 2017). Qualitatively, the synthetic and real CT images were remarkably similar, with the largest errors in the difference maps observed at the borders of the bone tissue and air cavities, likely due to high-intensity gradients at the interfaces between tissue classes and imperfect registration of the CT and MR training datasets. The average mean absolute error observed in the 18 test brain tumor subjects was significantly better than that obtained with an atlas-based method (Han 2017).
A different method to generate discrete-valued head attenuation maps from high-resolution contrast-enhanced T1-weighted MR images was developed using a deep convolutional auto-encoder network. The training data consisted of raw MR images and corresponding labels for air, bone and soft tissue obtained from unenhanced CT images. High labeling accuracy was reported for air, soft and bone tissue when comparing the resulting attenuation maps to those generated by segmenting the CT images. When using these maps for attenuation correction, the average errors reported were less than 1% for most brain regions, significantly smaller than those obtained with the Dixon-based 4-compartment approach and the registered CT-based template (Fig. 12) (Liu et al 2018a).
Figure 12:

Deep learning-based head attenuation map generation. The input MR, acquired CT and pseudo-CT images at different axial levels are shown. Figures originally published in Radiology (Liu et al 2018a).
As Dixon MR images are routinely acquired for attenuation correction purposes, a standard U-net architecture was proposed for generating continuous-valued attenuation maps from these data (Gong et al 2018). When ZTE MR images are also available, even more accurate attenuation maps can be obtained from both MR inputs using a modified U-net architecture based on group convolutional modules. The attenuation maps generated with both methods were more accurate than those obtained using the standard methods provided by the manufacturer. The mean relative errors in the reconstructed PET images were smaller than ~3% in all the brain regions analyzed, with the method using multiple contrasts producing the best results (Gong et al 2018). Alternatively, a framework proposed for improving the UTE-based attenuation maps obtained using dual-echo ramped hybrid encoding was shown to reduce the PET quantification errors to less than 1% (Jang et al 2018b). A 3D U-net convolutional neural network was also proposed for generating attenuation map from ZTE data and shown to introduce the smallest bias in PET data quantification when compared to the atlas- and standard ZTE-approaches (Blanc-Durand et al 2019). Another network based on the U-net architecture was shown to produce clinically acceptable attenuation maps in pediatric brain tumor patients, a particularly challenging patient population due to the age-related physiological differences in head shape and conformation and the presence of disease-specific morphological changes in the brain (Ladefoged et al 2019).
Alternatively, instead of generating the attenuation maps from the MR data, a deep convolutional encoder-decoder network was trained to generate pseudo-CT images from the uncorrected [18F]FDG-PET images (Liu et al 2018b). Using this approach, the mean PET image errors compared to the CT-based correction were below 2% for all the regions analyzed. Interestingly, the patients used for training the network were scanned with their arms either up or down, which suggests the method could be used to generate attenuation maps for other body regions, although this would likely require different models. A concern when using these architectures is overfitting. As a solution, generative adversarial networks (Goodfellow et al 2014) have successfully been used to translate PET into CT images (as well as for other tasks such as MR motion correction and PET image denoising). This framework consists of two distinct networks that are trained in competition, one to generate “fake” images that look realistic and the second one to binary classify the real and synthetic images. Qualitative and quantitative analyses showed the CT images generated using this framework are very similar to the ground truth (Armanious et al 2018). A slight underestimation (below 5%) of the [18F]FDG-PET SUVs was observed when performing the correction using the resulting attenuation maps (Armanious et al 2019). To regularize the synthetic CT generation procedure, an additional segmentation generative adversarial network component can be included in the model. This added network segments the synthetic CT into four tissue classes based on predefined thresholds, which leads to higher accuracy in deriving anatomical structures, albeit at the price of slightly biased CT intensity estimation compared to atlas-based methods (Arabi et al 2019).
Instead of focusing on synthesizing the most accurate pseudo-CT image, minimizing the bias in the PET images might be optimal. This was accomplished using a combination of two networks: one that generates multiple plausible CTs using a multi-hypothesis deep learning framework and a second one that predicts the residuals between the ground-truth and reconstructed PET images obtained using each of the plausible CTs. To train the second network the authors proposed using imitation learning, a process that approximates the PET image reconstruction (Kläser et al 2019).
An even more interesting possibility enabled by deep learning techniques is to perform the attenuation correction in the image space without the need to generate the attenuation maps as an intermediary step. This is particularly challenging because the attenuation map is also used for generating the scatter correction sinogram, which means both attenuation and scatter corrections must be performed in image space when the attenuation map is not available. The feasibility of such a joint correction approach was showed using [18F]FDG-PET data (Fig. 13). A deep convolutional neural network consisting of five encoder-decoder stages based on the U-Net architecture was trained using three-slice inputs. The mean relative difference across all regions and subjects with respect to the CT based approach was ~4%. Although ~15% (range −13.4 to 63.1%) variation was reported, higher than that observed for the MR-based approach, these preliminary results suggest such an approach could be an alternative to CT- or MR-based methods in the future (Yang et al 2019). While these methods have obvious advantages (e.g. they do not require acquisition of CT or MR images, are not affected by intermodality registration, etc.), they also have limitations such as being radiotracer-dependent, could fail for radiotracers with very specific and minimal global uptake, require very large training datasets to account for the presence of pathological changes and might not work for dynamic imaging. A potential solution in the case of radiotracers with highly specific binding such as those used to study the dopaminergic system is to use convolutional neural networks to generate attenuation maps from the noisy maps obtained with the maximum-likelihood activity and attenuation reconstruction algorithm (Hwang et al 2018).
Figure 13:

Deep learning-based joint attenuation and scatter correction (ASC) in image space. The standard and deep learning workflows are shown on the left. Examples of the PET images obtained using the CT (CT-ASC), deep learning (DCNN) and MR (MR-ASC) based approaches and the corresponding difference images are shown on the right. Figures originally published in Physics in Medicine and Biology (Yang et al 2019).
5.2. Pelvis
The pelvis is another area where MR-based approaches that do not properly account for bone attenuation could lead to substantial bias in PET data quantification and deep learning approaches have been proposed to minimize this bias. Although the pelvic area has more intersubject anatomic variability than the brain, the attenuation map generation task is facilitated by its relatively stationary nature in the sense that the pelvic organs are not affected by respiratory motion (albeit peristalsis, displacement of bowel air, bowel movements, bladder filling, can all lead to mismatches between the MR and PET data). In one of the first implementation, a 3D fully convolutional network was used to predict CT patches from input MR patches. 3D convolutions were chosen to better exploit the spatial information available in the data (Nie et al 2016).
In the context of PET/MRI, a deep convolutional neural network based on the U-net architecture was first used to generate synthetic CT image patches using three Dixon contrasts and the ZTE image as inputs. The impact on PET data quantification was evaluated for two radiotracers, [18F]FDG and [68Ga]PSMA-11. The mean underestimations of the linear attenuation coefficients and PET SUVs were reduced by a factor of three and the standard deviation by a factor of two compared to the standard Dixon-based approach. A factor of four reduction in root-mean-square error in PET quantification was observed in bone lesions (Leynes et al 2018).
The obvious limitation of this method was that it required the acquisition of the ZTE data, which increases the total acquisition time by more than two minutes. Instead, pseudo-CT maps can be generated exclusively from the Dixon images (Fig. 14). Using a 2D network that takes four contrasts as inputs (water, fat, in-phase and out-of-phase Dixon-VIBE images), the mean absolute relative change in PET values in the pelvis area was 2.36%±3.15% (Torrado-Carvajal et al 2019). Alternatively, pelvis attenuation maps can be generated only from the diagnostic MR images (Bradshaw et al 2018). Specifically, axial T2- and T1-weighted images were used as inputs to a network developed starting from the multiscale 3D convolutional neural network with fully connected conditional random fields (Kamnitsas et al 2017) to generate discrete-valued attenuation maps. The reported root-mean-square error of the entire PET image was less than 5%. Even lower PET quantification errors and improved bone identification were reported when using a generative adversarial network (GAN) trained using augmented data. To increase the number of training datasets and minimize the errors introduce by inaccurate MR to CT registration, a challenging task in the pelvis, the authors generated augmented deformation fields for each of the 18 prostate cancer patients used for training the GAN (Pozaruk et al 2020).
Figure 14:

Deep learning-based pelvis attenuation map generation. Sagittal, coronal, and axial attenuation maps using the CT-, Dixon- and deep learning-based approaches are shown in the first three rows. The distribution of relative changes (RCs) between the corresponding PET images are shown in the lower two rows. Figures originally published in the Journal of Nuclear Medicine (Torrado-Carvajal et al 2019).
Similar methods to synthesize CT-like images from MR images have been developed for MR-only radiotherapy planning (Wolterink et al 2017, Maspero et al 2018, Fu et al 2019, Spadea et al 2019, Wang et al 2019, Klages et al 2020, Dinkla et al 2019). All these methods could in principle also be applied to PET attenuation correction in integrated PET/MRI scanners. Those methods that can be trained using unpaired MRI-CT datasets (Wolterink et al 2017, Jin et al 2019) are of particular interest in the body given the difficult intermodality registration task.
5.3. Other body regions
Only a limited number of deep learning methods have been proposed for generating attenuation maps outside the head and pelvis. For example, synthetic CT images of the abdomen (and pelvis) have been generated from the Dixon MR images (water, fat, in-phase and opposed-phase) using a transfer fuzzy clustering and active learning-based classification. Preliminary results obtained with this method suggest the quantification bias in the PET measurements is reduced to below 5% (Qian et al 2019). In another approach, a 3D convolutional neuronal network was used to generate whole-body attenuation maps from the imperfect maps obtained using the MLAA algorithm that also included the time-of-flight information. 3D patches were again used for training to preserve the spatial information and reduce the memory requirements. The resulting attenuation maps were less noisy than the original ones and allowed better identification of bone (Fig. 15). The peak signal-to-noise ratios and normalized root-mean-square errors for the voxel wise comparison were also better for the proposed method. The authors argued that using only the [18F]FDG emission data avoids introducing errors due to inaccurate intermodality registration or MR image segmentation, but also acknowledged the network would likely require additional training to be used for other radiotracers (Hwang et al 2019). An approach that does not require any structural information was also implemented to generate whole-body attenuation corrected PET images from the non-attenuation corrected ones. Specifically, a supervised 3D patch-based cycle-consistent GAN architecture was trained and validated using 25 whole-body [18F]FDG PET/CT datasets and tested using 30 additional datasets, all obtained from oncologic patients. Using this very promising approach, mean errors below 3.5% compared to the CT-based approach were reported in all the organs analyzed except lung (Dong et al 2020).
Figure 15:

Deep learning-based whole-body attenuation map generation from the MLAA-derived activity (A) and attenuation maps (B). The Dixon- (C), deep learning (D) and CT-based (E) attenuation maps are shown for a representative subject. Figures originally published in the Journal of Nuclear Medicine (Hwang et al 2019).
6. Reflections on the past, present and future of attenuation correction in the PET/MRI field
6.1. How far have MR-based attenuation correction techniques come in the last decade?
In the early days of clinical PET/MRI, the equipment manufacturers focused primarily on developing the hardware needed to minimize the mutual interference between the two modalities and mostly relied on academia to develop advanced attenuation correction approaches. The only method available when the first dedicated brain PET/MRI prototypes were installed consisted of fitting an ellipse to the contour of the head estimated from the non-attenuation corrected PET data and assigning a single linear attenuation coefficient to all the inner pixels. Similarly, the first approach implemented for whole-body attenuation correction three years later allowed only the generation of approximate attenuation maps, albeit from MR data. As the general opinion was that attenuation correction was the most important methodological challenge in the field, many academic groups have persevered in developing increasingly accurate approaches. Interestingly, even the standard for assessing the performance of these methods has changed over the years. While segmented CT was considered the silver standard initially when only a limited number of tissue classes could be segmented from the MR images, scaled CT and even transmission images are now used for this purpose. In addition to being used for many research studies, some of these more advanced approaches have been adopted by the equipment manufactures and are now available for clinical use. Knowing where we started a decade ago, makes it easier to appreciate being able to generate pseudo-CT maps of the head or pelvis from morphological MR data in a few seconds.
6.2. Are the vendor-provided methods sufficiently accurate for routine clinical and research applications?
At least the first part of this question can be answered in the affirmative as there are already several PET/MRI scanners approved for clinical use. Although the early attenuation correction approaches were not without limitations, the equipment manufacturers have managed to address them reasonably well and implemented more accurate methods to minimize the bias to clinically acceptable levels, which was confirmed by the majority of the studies performed to date, as discussed in Section 3.2 (and Section 4.1 for the ZTE-based approaches).
However, one can argue that settling for “routine” is equivalent to setting the bar too low for PET/MRI. As emphasized in numerous publications, PET/MRI could enable PET to go beyond qualitative or semiquantitative data analysis. In particular, PET/MRI could facilitate the adoption of true quantification, presently considered almost exclusively a research application, for the initial diagnosis or longitudinal assessment of therapy response (Catana et al 2018). This requires reducing the bias related to attenuation correction below the expected effect sizes. As first steps in this direction, cerebral glucose metabolic rates were estimated non-invasively using dynamic PET data and an automated MR-driven approach for calculating the [18F]FDG input function (Sundar et al 2019) and the whole-body [18F]FDG influx rates were measured from dynamic whole-body PET/MRI data (Johansson et al 2018). In the case of whole-body studies, the longer acquisition times required for MR imaging offers an unexpected opportunity for dynamic whole-body PET imaging, in addition to lowering the radiation exposure compared to the equivalent PET/CT examination (Rahmim et al 2019).
6.3. Which applications require even more accurate attenuation correction methods?
Quantitative imaging of bone lesions.
Notwithstanding all the focus on minimizing bone tissue misclassification in the MR-based attenuation maps, significant bias can still be present in bone lesions. Osteoblastic metastases in particular have been shown to have lower HU values than normal bone and enostoses (a type of benign bone lesion) (Ulano et al 2016). Furthermore, their attenuation properties can change during treatment, with higher HU values observed posttreatment (Elangovan and Sebro 2018). Interestingly, even low-dose CT performed for attenuation correction purposes had a lower performance than diagnostic quality CT in this setting, requiring a joint PET and CT prediction model to improve accuracy when differentiating enostoses from treated metastases (Lee et al 2020). In the case of PET/MRI, the attenuation in these lesions is still underestimated or overestimated when using 4- or 5-compartment MR-based methods, respectively.
Imaging pediatric patients.
PET/MRI has been suggested as a lower-radiation exposure modality for evaluating pediatric patients compared to PET/CT. However, very few attenuation correction methods have been specifically developed for or at least properly evaluated in this patient population, which is required given the higher anatomic variability and differences in bone and lung density (Bezrukov et al 2015). Pediatric atlases could be generated if a sufficient number of matching MR and CT data sets to reflect the variability are available (Bezrukov et al 2015). Alternatively, a deep learning approach that uses UTE data has been shown to produce accurate attenuation maps even in pediatric brain tumor patients (Ladefoged et al 2019).
Non-oncological lung imaging.
Although high resolution CT is the preferred imaging modality in the lung, providing excellent morphological and even physiological information, it is associated with high radiation exposure. PET on the other hand can provide more disease-specific measures particularly when using targeted radiotracers. For example, using a collagen-specific PET probe (Desogere et al 2017), higher collagen deposition was observed in idiopathic pulmonary fibrosis patients compared to healthy controls (Montesi et al 2019). As MRI could provide complementary readouts of morphology, physiology, metabolism and molecular processes, there is an interest in performing the data acquisition simultaneously using integrated PET/MRI scanners. However, pathological changes in the lung (e.g. fibrosis) lead to substantial changes in its attenuation properties that are not compensated by current lung attenuation map generation algorithms. Minimizing this subject- and disease stage-specific bias will require the optimization of dedicated MR sequences and implementation of advanced tissue segmentation algorithms to generate more accurate lung attenuation maps.
Machine learning multimodal imaging data integration and analysis.
Machine learning approaches for extracting additional information from multimodal images have great clinical translational potential. Although these advanced methods could be applied to the data acquired separately, an integrated PET/MRI scanner is ideal for comparing MR and PET derived image features to identify those that provide complementary information as it alleviates the limitations of software registration algorithms and minimizes the physiological changes between the two separate examinations. The most accurate attenuation correction methods are required to guarantee that PET data similar to that obtained using stand-alone devices are used as inputs for characterizing disease-specific imaging phenotype using machine learning approaches.
6.4. How can promising methods developed in academia by disseminated to other users?
In many cases this dissemination has been accomplished using a direct customer-to-customer transfer of the software packages required for generating the attenuation maps. For example, the SPM-based approach (Izquierdo-Garcia et al 2014) has been shared with at least a dozen of academic groups around the world. Ideally this transfer of knowledge should be bidirectional, in the sense that the additional data available at the “receiving” end should be used to further optimize the original method. Such an approach would be particularly useful for improving the performance of deep learning techniques and could be accomplished either by sharing the data (which is unfortunately increasingly more difficult) or using federated learning (Konečný et al 2016). Obviously, an even more efficient transfer to end users could be facilitated by the equipment manufacturers. First, they should provide the capability of importing custom-made attenuation maps on the scanner to allow the PET images to be reconstructed using the standard software. Second, academic-industrial partnership should be supported for addressing the remaining limitations of the vendor-provided approaches. The resulting techniques should be disseminated as work-in-progress packages to be tested more broadly. Finally, promising methods developed in academia should be adopted, further developed, implemented and distributed according to industry standards so they can be used for clinical purpose.
6.5. How can attenuation correction specific issues relevant to accreditation/qualification of integrated PET/MRI scanners for multicenter trials be addressed?
Relatively few studies have assessed the reproducibility of the attenuation map generation methods. As a first step in this direction, high interscan repeatability of the whole-body Dixon-based attenuation maps was reported in patients without tissue artifacts (Rausch et al 2016). Scan-rescan SUV variations smaller than ±20% were reported in 95% of the cases examined when the same method was used to generate thoracic attenuation maps (Olin et al 2018). The repeatability of the atlas- or UTE-based methods was also assessed. For example, comparable attenuation maps and PET volumes were obtained at three visits using the probabilistic atlas method (Chen et al 2017). Similar results were reported for the SPM-based method (Fig. 16) (Izquierdo-Garcia et al 2018).
Figure 16:

Inter-scanner repeatability of the head attenuation map generation method. The attenuation map obtained at three time points for a representative subject are shown on the left. The PET images obtained from the same emission data reconstructed with the three different maps are shown on the right. Figures originally published in IEEE Transactions on Radiation and Plasma Medical Sciences (Izquierdo-Garcia et al 2018).
Although this review focused almost exclusively on the methods proposed for generating attenuation maps to account for the attenuation in the subject, another factor that needs to be considered in this context is the challenging task of generating attenuation maps for the image quality phantoms. Although this approach has proved very useful in the case of PET/CT scanners, it is inadequate for PET/MRI as the algorithms optimized for generating human tissue attenuation maps cannot simply be applied to standard phantoms. Instead, this task requires dedicated phantom acquisition and processing protocols (Boellaard et al 2015) or novel fillable and easy to manufacture phantoms made from stable materials that mimic both the MR and 511 keV attenuation properties of human tissue (Rai et al 2018, Chandramohan et al 2020). Alternatively, approaches to evaluate the performance of attenuation correction methods that do not require scanning of phantoms could be implemented, albeit also requiring a revision of the criteria for qualifying hybrid scanners for a multicenter trial.
6.6. What are the priorities in the near future?
Reaching a consensus on the status of attenuation correction for various applications.
While attenuation correction will likely continue to be challenging in certain body regions (e.g. thorax), it is often considered a solved problem in others (e.g. head (Ladefoged et al 2016)). Nevertheless, as the early-generation vendor-provided methods were the only approaches available at many institutions (either due to lack of technical expertise or the requirement to use the vendor-provided methods for clinical purposes), the perception that head attenuation correction is still problematic has spread and still prevents PET/MRI from being included in multicenter studies. Substantial progress has also been made in the pelvis.
Establishing unified quantitative evaluation protocols.
In addition to the different silver/gold standards used for testing attenuation correction methods mentioned above, there was substantial variability in the number of subjects enrolled in the validation studies as well as in the radiotracers used for this purpose. The community needs to converge on a set of methods and metrics to be used to assess the performance of various methods for specific applications.
Performing multicenter studies to compare the performance of existing attenuation correction methods.
In one of the most comprehensive multicenter studies performed to date, eleven attenuation correction methods developed by academic groups and Siemens (Koesters et al 2016, Paulus et al 2015, Izquierdo-Garcia et al 2014, Burgos et al 2014, Merida et al 2015, Cabello et al 2015, Juttukonda et al 2015, Ladefoged et al 2015, Anazodo et al 2015) were compared using a large cohort of Alzheimer’s disease subjects who underwent PET studies using three different radiotracers and using a unified quantitative evaluation protocol (Fig. 17). The authors’ conclusion was “that the challenge of improving the accuracy of MR-[based attenuation correction] in adult brains with normal anatomy has been solved to an acceptable degree, with errors smaller than the quantification reproducibility in PET imaging.” (Ladefoged et al 2016). Similar studies should be performed for other applications or to assess the performance of attenuation correction in other body regions. Extending this work to a multivendor setting is also needed. Early steps in this direction were made by scanning the same volunteers on each of the scanners investigated (Beyer et al 2016). Furthermore, a cross-vendor validation was already performed when methods developed for one particular scanner were evaluated against CT data obtained from a scanner manufactured by a different vendor. Although vendor-specific formulas are used to convert the HU values to linear attenuation coefficients, the resulting attenuation map obtained from various PET/CT scanners are largely considered equivalent.
Figure 17:

Head attenuation maps generated using 11 different methods for a sample patient that minimized the difference of the overall brain error to the median error across all methods. Figure originally published in NeuroImage (Ladefoged et al 2016).
Integrating attenuation correction with other MR-based approaches for improving the PET data quantification.
Several other sources of information provided by MR can be leveraged to address confounding factors in PET (e.g. subject motion, limited spatial resolution, etc.). As an example, an efficient approach for MR-assisted PET data optimization (i.e. perform attenuation and motion correction and anatomy-aided reconstruction) for brain studies has been shown to enable more accurate assessment of pathological changes in dementia patients (Chen et al 2019). Similar pipelines for improving PET data quantification implemented for heart (Kolbitsch et al 2018), liver (Fuin et al 2018) and even lung (Fayad et al 2017) imaging could dramatically improve the performance of PET for a wide range of clinical and research applications.
8. Bibliography
- Afaq A, Fraioli F, Sidhu H, Wan S, Punwani S, Chen S, Akin O, Linch D, Ardeshna K, Lambert J, Miles K, Groves A and Kayani I 2017. Comparison of PET/MRI With PET/CT in the Evaluation of Disease Status in Lymphoma. Clin. Nucl. Med 42 e1–7 Online: http://content.wkhealth.com/linkback/openurl?sid=WKPTLP:landingpage&an=00003072-201701000-00025 [DOI] [PMC free article] [PubMed] [Google Scholar]
- Afshar-Oromieh A, Haberkorn U, Schlemmer HP, Fenchel M, Eder M, Eisenhut M, Hadaschik BA, Kopp-Schneider A and Röthke M 2014. Comparison of PET/CT and PET/MRI hybrid systems using a 68Ga-labelled PSMA ligand for the diagnosis of recurrent prostate cancer: initial experience. Eur. J. Nucl. Med. Mol. Imaging 41 887–97 Online: http://link.springer.com/10.1007/s00259-013-2660-z [DOI] [PubMed] [Google Scholar]
- Ahn S, Cheng L, Shanbhag DD, Qian H, Kaushik SS, Jansen FP and Wiesinger F 2018. Joint estimation of activity and attenuation for PET using pragmatic MR-based prior: application to clinical TOF PET/MR whole-body data for FDG and non-FDG tracers. Phys. Med. Biol 63 045006 Online: http://stacks.iop.org/0031-9155/63/i=4/a=045006?key=crossref.42c000292c4aaab6c93506ff318039b9 [DOI] [PubMed] [Google Scholar]
- Ai T, Padua A, Goerner F, Nittka M, Gugala Z, Jadhav S, Trelles M, Johnson RF, Lindsey RW, Li XM and Runge VM 2012. SEMAC-VAT and MSVAT-SPACE Sequence Strategies for Metal Artifact Reduction in 1.5T Magnetic Resonance Imaging Invest. Radiol 47 267–76 [DOI] [PubMed] [Google Scholar]
- Anazodo UC, Thiessen JD, Ssali T, Mandel J, Guenther M, Butler J, Pavlosky W, Prato FS, Thompson RT and Lawrence KS St. 2015. Feasibility of simultaneous whole-brain imaging on an integrated PET-MRI system using an enhanced 2-point Dixon attenuation correction method Front. Neurosci 8 [DOI] [PMC free article] [PubMed] [Google Scholar]
- Andersen FL, Ladefoged CN, Beyer T, Keller SH, Hansen AE, Højgaard L, Kjær A, Law I and Holm S 2014. Combined PET/MR imaging in neurology: MR-based attenuation correction implies a strong spatial bias when ignoring bone Neuroimage 84 206–16 Online: https://www.sciencedirect.com/science/article/pii/S105381191300904X [DOI] [PubMed] [Google Scholar]
- Andreasen D, Van Leemput K, Hansen RH, Andersen JAL and Edmund JM 2015. Patch-based generation of a pseudo CT from conventional MRI sequences for MRI-only radiotherapy of the brain Med. Phys 42 1596–605 [DOI] [PubMed] [Google Scholar]
- Arabi H, Zeng G, Zheng G and Zaidi H 2019. Novel adversarial semantic structure deep learning for MRI-guided attenuation correction in brain PET/MRI Eur. J. Nucl. Med. Mol. Imaging 46 2746–59 Online: http://link.springer.com/10.1007/s00259-019-04380-x [DOI] [PubMed] [Google Scholar]
- Armanious K, Jiang C, Fischer M, Küstner T, Nikolaou K, Gatidis S and Yang B 2018. MedGAN: Medical Image Translation using GANs 1–16 Online: http://arxiv.org/abs/1806.06397 [DOI] [PubMed] [Google Scholar]
- Armanious K, Küstner T, Reimold M, Nikolaou K, La Fougère C, Yang B and Gatidis S 2019. Independent brain 18F-FDG PET attenuation correction using a deep learning approach with Generative Adversarial Networks Hell. J. Nucl. Med 22 179–86 [DOI] [PubMed] [Google Scholar]
- Atkinson W, Catana C, Abramson JSJS, Arabasz G, McDermott S, Catalano O, Muse V, Blake MAMA, Barnes J, Shelly M, Hochberg E, Rosen B R B R and Guimaraes A R A R 2016 Hybrid FDG-PET/MR compared to FDG-PET/CT in adult lymphoma patients Abdom. Radiol 41 1338–48 Online: http://link.springer.com/10.1007/s00261-016-0638-6 [DOI] [PubMed] [Google Scholar]
- Attenberger U, Catana C, Chandarana H, Catalano OA, Friedman K, Schonberg SA, Thrall J, Salvatore M, Rosen BR and Guimaraes AR 2015. Whole-body FDG PET-MR oncologic imaging: pitfalls in clinical interpretation related to inaccurate MR-based attenuation correction Abdom. Imaging 40 1374–86 Online: http://link.springer.com/10.1007/s00261-015-0455-3 [DOI] [PubMed] [Google Scholar]
- Bai CY, Shao L, Da Silva AJ and Zhao Z 2003. A generalized model for the conversion from CT numbers to linear attenuation coefficients IEEE Trans. Nucl. Sci 50 1510–5 [Google Scholar]
- Baran J, Chen Z, Sforazzini F, Ferris N, Jamadar S, Schmitt B, Faul D, Shah NJ, Cholewa M and Egan GF 2018. Accurate hybrid template-based and MR-based attenuation correction using UTE images for simultaneous PET/MR brain imaging applications. BMC Med. Imaging 18 41 Online: https://bmcmedimaging.biomedcentral.com/articles/10.1186/s12880-018-0283-3 [DOI] [PMC free article] [PubMed] [Google Scholar]
- Benoit D, Ladefoged CN, Rezaei A, Keller SH, Andersen FL, Højgaard L, Hansen AE, Holm S and Nuyts J 2016. Optimized MLAA for quantitative non-TOF PET/MR of the brain Phys. Med. Biol 61 8854–74 Online: http://stacks.iop.org/0031-9155/61/i=24/a=8854?key=crossref.afd652176852962b38bf6d7e71c6b978 [DOI] [PubMed] [Google Scholar]
- Berker Y, Franke J, Salomon A, Palmowski M, Donker HCW, Temur Y, Mottaghy FM, Kuhl C, Izquierdo-Garcia D, Fayad ZA, Kiessling F and Schulz V 2012. MRI-based attenuation correction for hybrid PET/MRI systems: a 4-class tissue segmentation technique using a combined ultrashort-echo-time/Dixon MRI sequence J. Nucl. Med 53 796–804 [DOI] [PubMed] [Google Scholar]
- Beyer T, Lassen ML, Boellaard R, Delso G, Yaqub M, Sattler B and Quick HH 2016. Investigating the state-of-the-art in whole-body MR-based attenuation correction: an intra-individual, inter-system, inventory study on three clinical PET/MR systems. MAGMA 29 75–87 Online: http://link.springer.com/10.1007/s10334-015-0505-4 [DOI] [PubMed] [Google Scholar]
- Beyer T, Townsend DW, Brun T, Kinahan PE, Charron M, Roddy R, Jerin J, Young J, Byars L and Nutt R 2000. A combined PET/CT scanner for clinical oncology J. Nucl. Med 41 1369–79 [PubMed] [Google Scholar]
- Bezrukov I, Schmidt H, Gatidis S, Mantlik F, Schfer JF, Schwenzer N and Pichler BJ 2015. Quantitative evaluation of segmentation- and atlas-based attenuation correction for PET/MR on pediatric patients J. Nucl. Med 56 1067–74 [DOI] [PubMed] [Google Scholar]
- Bini J, Eldib M, Robson PM, Calcagno C and Fayad ZA 2016. Simultaneous carotid PET/MR: feasibility and improvement of magnetic resonance-based attenuation correction Int. J. Cardiovasc. Imaging 32 61–71 Online: http://link.springer.com/10.1007/s10554-015-0661-7 [DOI] [PMC free article] [PubMed] [Google Scholar]
- Bini J, Robson PM, Calcagno C, Eldib M and Fayad ZA 2015. Quantitative carotid PET/MR imaging: clinical evaluation of MR-Attenuation correction versus CT-Attenuation correction in (18)F-FDG PET/MR emission data and comparison to PET/CT. Am. J. Nucl. Med. Mol. Imaging 5 293–304 [PMC free article] [PubMed] [Google Scholar]
- Blanc-Durand P, Khalife M, Sgard B, Kaushik S, Soret M, Tiss A, El Fakhri G, Habert M-O, Wiesinger F and Kas A 2019. Attenuation correction using 3D deep convolutional neural network for brain 18F-FDG PET/MR: Comparison with Atlas, ZTE and CT based attenuation correction ed S D Ginsberg PLoS One 14 e0223141 Online: http://dx.plos.org/10.1371/journal.pone.0223141 [DOI] [PMC free article] [PubMed] [Google Scholar]
- Blumhagen JO, Braun H, Ladebeck R, Fenchel M, Faul D, Scheffler K and Quick HH 2014. Field of view extension and truncation correction for MR-based human attenuation correction in simultaneous MR/PET imaging Med. Phys 41 9. [DOI] [PubMed] [Google Scholar]
- Blumhagen JO, Ladebeck R, Fenchel M and Scheffler K 2013. MR-Based Field-of-View Extension in MR/PET: B-0 Homogenization Using Gradient Enhancement (HUGE) Magn. Reson. Med 70 1047–57 [DOI] [PubMed] [Google Scholar]
- Boellaard R, Hofman MBM, Hoekstra OS and Lammertsma AA 2014. Accurate PET/MR Quantification Using Time of Flight MLAA Image Reconstruction Mol. Imaging Biol 1–9 Online: 10.1007/s11307-013-0716-x [DOI] [PubMed] [Google Scholar]
- Boellaard R, Rausch I, Beyer T, Delso G, Yaqub M, Quick HH and Sattler B 2015. Quality control for quantitative multicenter whole-body PET/MR studies: A NEMA image quality phantom study with three current PET/MR systems. Med. Phys 42 5961–9 [DOI] [PubMed] [Google Scholar]
- Borra RJH, Cho H-S, Bowen SL, Attenberger U, Arabasz G, Catana C, Josephson L, Rosen BR, Guimaraes AR and Hooker JM 2015. Effects of ferumoxytol on quantitative PET measurements in simultaneous PET/MR whole-body imaging: a pilot study in a baboon model EJNMMI Phys. 2 [DOI] [PMC free article] [PubMed] [Google Scholar]
- Bousse A, Manber R, Holman BF, Atkinson D, Arridge S, Ourselin S, Hutton BF and Thielemans K 2017. Evaluation of a direct motion estimation/correction method in respiratory-gated PET/MRI with motion-adjusted attenuation Med. Phys 44 2379–90 [DOI] [PubMed] [Google Scholar]
- Bowen SL, Fuin N, Levine MA and Catana C 2016. Transmission imaging for integrated PET-MR systems. Phys. Med. Biol 61 5547–68 Online: http://stacks.iop.org/0031-9155/61/i=15/a=5547?key=crossref.23a728cb4141688aae185f3c9a723f1b [DOI] [PMC free article] [PubMed] [Google Scholar]
- Bradshaw TJ, Zhao G, Jang H, Liu F and McMillan AB 2018. Feasibility of Deep Learning–Based PET/MR Attenuation Correction in the Pelvis Using Only Diagnostic MR Images Tomography 4 138–47 Online: http://flipbook.tomography.org/publication/?i=529986&ver=html5&p=50 [DOI] [PMC free article] [PubMed] [Google Scholar]
- Burger C, Goerres G, Schoenes S, Buck A, Lonn AHR and von Schulthess GK 2002. PET attenuation coefficients from CT images: experimental evaluation of the transformation of CT into PET 511-keV attenuation coefficients Eur. J. Nucl. Med. Mol. Imaging 29 922–7 [DOI] [PubMed] [Google Scholar]
- Burgos N, Cardoso MJ, Thielemans K, Modat M, Dickson J, Schott JM, Atkinson D, Arridge SR, Hutton BF and Ourselin S 2015. Multi-contrast attenuation map synthesis for PET/MR scanners: assessment on FDG and Florbetapir PET tracers. Eur. J. Nucl. Med. Mol. Imaging 42 1447–58 Online: http://link.springer.com/10.1007/s00259-015-3082-x [DOI] [PMC free article] [PubMed] [Google Scholar]
- Burgos N, Cardoso MJ, Thielemans K, Modat M, Pedemonte S, Dickson J, Barnes A, Ahmed R, Mahoney CJ, Schott JM, Duncan JS, Atkinson D, Arridge SR, Hutton BF and Ourselin S 2014. Attenuation correction synthesis for hybrid PET-MR scanners: application to brain studies. IEEE Trans. Med. Imaging 33 2332–41 Online: http://ieeexplore.ieee.org/lpdocs/epic03/wrapper.htm?arnumber=6858020 [DOI] [PubMed] [Google Scholar]
- Büther F, Noto B, Auf der Springe K, Allkemper T and Stegger L 2017. An artefact of PET attenuation correction caused by iron overload of the liver in clinical PET-MRI. Eur. J. hybrid imaging 1 10 Online: http://ejhi.springeropen.com/articles/10.1186/s41824-017-0015-x [DOI] [PMC free article] [PubMed] [Google Scholar]
- Cabello J, Avram M, Brandl F, Mustafa M, Scherr M, Leucht C, Leucht S, Sorg C and Ziegler SI 2019. Impact of non-uniform attenuation correction in a dynamic [18F]-FDOPA brain PET/MRI study. EJNMMI Res. 9 77 Online: https://ejnmmires.springeropen.com/articles/10.1186/s13550-019-0547-0 [DOI] [PMC free article] [PubMed] [Google Scholar]
- Cabello J, Lukas M, Förster S, Pyka T, Nekolla SG and Ziegler SI 2015. MR-based attenuation correction using ultrashort-echo-time pulse sequences in dementia patients J. Nucl. Med 56 423–9 [DOI] [PubMed] [Google Scholar]
- Catana C 2015. Motion correction options in PET/MRI Semin. Nucl. Med 45 212–23 [DOI] [PMC free article] [PubMed] [Google Scholar]
- Catana C, van der Kouwe AJW, Benner T, Michel C, Hamm M, Fenchel M, Fischl B, Rosen BR, Schmand M and Sorensen AG 2010a. Towards Implementing an MR-based PET Attenuation Correction Method for Neurological Studies on the MR-PET Brain Prototype J. Nucl. Med in press [DOI] [PMC free article] [PubMed] [Google Scholar]
- Catana C, van der Kouwe A, Benner T, Michel CJ, Hamm M, Fenchel M, Fischl B, Rosen B, Schmand M and Sorensen AG 2010b. Toward Implementing an MRI-Based PET Attenuation-Correction Method for Neurologic Studies on the MR-PET Brain Prototype J. Nucl. Med 51 1431–8 Online: http://jnm.snmjournals.org/cgi/doi/10.2967/jnumed.109.069112 [DOI] [PMC free article] [PubMed] [Google Scholar]
- Catana C, Quick HH and Zaidi H 2018. Current commercial techniques for MRI-guided attenuation correction are insufficient and will limit the wider acceptance of PET/MRI technology in the clinic Med. Phys 45 4007–10 [DOI] [PubMed] [Google Scholar]
- Censor Y, Gustafson DE, Lent A and Tuy H 1979. A New Approach to the Emission Computerized Tomography Problem: Simultaneous Calculation of Attenuation and Activity Coefficients Nucl. Sci. IEEE Trans 26 2775–9 [Google Scholar]
- Chandramohan D, Cao P, Han M, An H, Sunderland JJ, Kinahan PE, Laforest R, Hope TA and Larson PEZ 2020. Bone material analogues for PET/MRI phantoms. Med. Phys mp.14079 Online: https://onlinelibrary.wiley.com/doi/abs/10.1002/mp.14079 [DOI] [PMC free article] [PubMed] [Google Scholar]
- Chen KT, Izquierdo-Garcia D, Poynton CB, Chonde DB and Catana C 2017. On the accuracy and reproducibility of a novel probabilistic atlas-based generation for calculation of head attenuation maps on integrated PET/MR scanners Eur. J. Nucl. Med. Mol. Imaging 44 398–407 [DOI] [PMC free article] [PubMed] [Google Scholar]
- Chen KT, Salcedo S, Gong K, Chonde DB, Izquierdo-Garcia D, Drzezga A, Rosen B, Qi J, Dickerson BC and Catana C 2019. An Efficient Approach to Perform MR-Assisted PET Data Optimization in Simultaneous PET/MR Neuroimaging Studies J. Nucl. Med 60 272–8 Online: http://jnm.snmjournals.org/lookup/doi/10.2967/jnumed.117.207142 [DOI] [PMC free article] [PubMed] [Google Scholar]
- Dickerson BC and Catana C 2019. An Efficient Approach to Perform MR-Assisted PET Data Optimization in Simultaneous PET/MR Neuroimaging Studies J. Nucl. Med 60 272–8 Online: http://jnm.snmjournals.org/lookup/doi/10.2967/jnumed.117.207142 [DOI] [PMC free article] [PubMed] [Google Scholar]
- Defrise M, Rezaei A and Nuyts J 2012. Time-of-flight PET data determine the attenuation sinogram up to a constant Phys. Med. Biol 57 885–99 Online: 10.1088/0031-9155/57/4/885 [DOI] [PubMed] [Google Scholar]
- Delso G, Gillett D, Bashari W, Matys T, Mendichovszky I and Gurnell M 2019. Clinical Evaluation of 11 C-Met-Avid Pituitary Lesions Using a ZTE-Based AC Method IEEE Trans. Radiat. Plasma Med. Sci 3 504–8 Online: https://ieeexplore.ieee.org/document/8576584/ [Google Scholar]
- Delso G, Martinez-Moller A, Bundschuh RA, Nekolla SG and Ziegler SI 2010. The effect of limited MR field of view in MR/PET attenuation correction Med. Phys 37 2804–12 [DOI] [PubMed] [Google Scholar]
- Delso G, Wiesinger F, Sacolick LI, Kaushik SS, Shanbhag DD, Hullner M and Veit-Haibach P 2015. Clinical Evaluation of Zero-Echo-Time MR Imaging for the Segmentation of the Skull J. Nucl. Med 56 417–22 Online: http://jnm.snmjournals.org/cgi/doi/10.2967/jnumed.114.149997 [DOI] [PubMed] [Google Scholar]
- Desogere P, Tapias LF, Hariri LP, Rotile NJ, Rietz TA, Probst CK, Blasi F, Day H, Mino-Kenudson M, Weinreb P, Violette SM, Fuchs BC, Tager AM, Lanuti M and Caravan P 2017. Type I collagen-targeted PET probe for pulmonary fibrosis detection and staging in preclinical models. Sci. Transl. Med 9 [DOI] [PMC free article] [PubMed] [Google Scholar]
- Dinkla AM, Florkow MC, Maspero M, Savenije MHF, Zijlstra F, Doornaert PAH, van Stralen M, Philippens MEP, van den Berg CAT and Seevinck PR 2019. Dosimetric evaluation of synthetic CT for head and neck radiotherapy generated by a patch-based three-dimensional convolutional neural network. Med. Phys 46 4095–104 [DOI] [PubMed] [Google Scholar]
- Domachevsky L, Goldberg N, Gorenberg M, Bernstine H, Groshar D and Catalano OA 2020. Prostate cancer evaluation using PET quantification in 68Ga-PSMA-11 PET/MR with attenuation correction of bones as a fifth compartment Quant. Imaging Med. Surg 10 40–7 Online: http://www.ncbi.nlm.nih.gov/pubmed/31956527 [DOI] [PMC free article] [PubMed] [Google Scholar]
- Dong X, Lei Y, Wang T, Higgins K, Liu T, Curran WJ, Mao H, Nye JA and Yang X 2020. Deep learning-based attenuation correction in the absence of structural information for whole-body positron emission tomography imaging Phys. Med. Biol 65 [DOI] [PMC free article] [PubMed] [Google Scholar]
- Eiber M, Takei T, Souvatzoglou M, Mayerhoefer ME, Furst S, Gaertner FC, Loeffelbein DJ, Rummeny EJ, Ziegler SI, Schwaiger M and Beer AJ 2014. Performance of Whole-Body Integrated 18F-FDG PET/MR in Comparison to PET/CT for Evaluation of Malignant Bone Lesions J. Nucl. Med 55 191–7 Online: http://jnm.snmjournals.org/cgi/doi/10.2967/jnumed.113.123646 [DOI] [PubMed] [Google Scholar]
- Elangovan SM and Sebro R 2018. Accuracy of CT Attenuation Measurement for Differentiating Treated Osteoblastic Metastases From Enostoses Am. J. Roentgenol 210 615–20 Online: 10.2214/AJR.17.18638 [DOI] [PubMed] [Google Scholar]
- Eldib M, Bini J, Faul DD, Oesingmann N, Tsoumpas C and Fayad ZA 2016. Attenuation Correction for Magnetic Resonance Coils in Combined PET/MR Imaging A Review PET Clin. 11 151–60 Online: https://linkinghub.elsevier.com/retrieve/pii/S1556859815001170 [DOI] [PMC free article] [PubMed] [Google Scholar]
- Elschot M, Selnæs KM, Johansen H, Krüger-Stokke B, Bertilsson H and Bathen TF 2018. The Effect of Including Bone in Dixon-Based Attenuation Correction for 18 F-Fluciclovine PET/MRI of Prostate Cancer J. Nucl. Med 59 1913–7 Online: http://jnm.snmjournals.org/lookup/doi/10.2967/jnumed.118.208868 [DOI] [PubMed] [Google Scholar]
- Farag A, Thompson RT, Thiessen JD, Biernaski H, Prato FS and Théberge J 2020. Evaluation of 511 keV photon attenuation by a novel 32-channel phased array prospectively designed for cardiovascular hybrid PET/MRI imaging Eur. J. Hybrid Imaging 4 [DOI] [PMC free article] [PubMed] [Google Scholar]
- Fathi Kazerooni A, Ay MR, Arfaie S, Khateri P and Saligheh Rad H 2017. Single STE-MR Acquisition in MR-Based Attenuation Correction of Brain PET Imaging Employing a Fully Automated and Reproducible Level-Set Segmentation Approach Mol. Imaging Biol 19 143–52 Online: 10.1007/s11307-016-0990-5 [DOI] [PubMed] [Google Scholar]
- Fayad H, Schmidt H, Küstner T and Visvikis D 2017. 4-Dimensional MRI and attenuation map generation in PET/MRI with 4-dimensional PET-derived deformation matrices: Study of feasibility for lung cancer applications J. Nucl. Med 58 833–9 [DOI] [PubMed] [Google Scholar]
- Freitag MT, Fenchel M, Bäumer P, Heußer T, Rank CM, Kachelrieß M, Paech D, Kopka K, Bickelhaupt S, Dimitrakopoulou-Strauss A, Maier-Hein K, Floca R, Ladd ME, Schlemmer H-P and Maier F 2017. Improved clinical workflow for simultaneous whole-body PET/MRI using high-resolution CAIPIRINHA-accelerated MR-based attenuation correction. Eur. J. Radiol 96 12–20 Online: https://linkinghub.elsevier.com/retrieve/pii/S0720048X17303650 [DOI] [PubMed] [Google Scholar]
- Fu J, Yang Y, Singhrao K, Ruan D, Chu F, Low DA and Lewis JH 2019. Deep learning approaches using 2D and 3D convolutional neural networks for generating male pelvic synthetic computed tomography from magnetic resonance imaging Med. Phys 46 3788–98 Online: https://onlinelibrary.wiley.com/doi/abs/10.1002/mp.13672 [DOI] [PubMed] [Google Scholar]
- Fuin N, Catalano OA, Scipioni M, Canjels LPW, Izquierdo-Garcia D, Pedemonte S and Catana C 2018. Concurrent Respiratory Motion Correction of Abdominal PET and Dynamic Contrast-Enhanced-MRI Using a Compressed Sensing Approach. J. Nucl. Med 59 1474–9 [DOI] [PMC free article] [PubMed] [Google Scholar]
- Fuin N, Pedemonte S, Catalano OA, Izquierdo-Garcia D, Soricelli A, Salvatore M, Heberlein K, Hooker JM, Van Leemput K and Catana C 2017. PET/MRI in the presence of metal implants: Completion of the attenuation map from PET emission data J. Nucl. Med 58 840–5 [DOI] [PMC free article] [PubMed] [Google Scholar]
- Giraudo C, Raderer M, Karanikas G, Weber M, Kiesewetter B, Dolak W, Simonitsch-Klupp I and Mayerhoefer ME 2016. 18F-Fluorodeoxyglucose Positron Emission Tomography/Magnetic Resonance in Lymphoma Invest. Radiol 51 163–9 Online: http://content.wkhealth.com/linkback/openurl?sid=WKPTLP:landingpage&an=00004424-201603000-00003 [DOI] [PMC free article] [PubMed] [Google Scholar]
- Glocker B, Konukoglu E, Lavdas I, Iglesias JE, Aboagye EO, Rockall AG and Rueckert D 2016. Correction of Fat-Water Swaps in Dixon MRI Medical Image Computing and Computer-Assisted Intervention - MICCAI 2016 ed Ourselin S, Joskowicz L, Sabuncu MR, Unal G and Wells W (Cham: Springer International Publishing; ) pp 536–43 [Google Scholar]
- Gong K, Yang J, Kim K, El Fakhri G, Seo Y and Li Q 2018. Attenuation correction for brain PET imaging using deep neural network based on Dixon and ZTE MR images Phys. Med. Biol 63 125011 Online: http://stacks.iop.org/0031-9155/63/i=12/a=125011?key=crossref.2fe8da2c44e8b0df65afd8ed92b7c118 [DOI] [PMC free article] [PubMed] [Google Scholar]
- Goodfellow IJ, Pouget-Abadie J, Mirza M, Xu B, Warde-Farley D, Ozair S, Courville A and Bengio Y 2014. Generative Adversarial Nets Advances in Neuroal Information Processing Systems 27 (NIPS 2014) Advances in Neural Information Processing Systems vol 27, ed K Ghahramani Z and Welling M and Cortes C and Lawrence ND and Weinberger (LA JOLLA, CA, USA: Neural Information Processing Systems (NIPS)) [Google Scholar]
- Grafe H, Lindemann ME, Ruhlmann V, Oehmigen M, Hirmas N, Umutlu L, Herrmann K and Quick HH 2020. Evaluation of improved attenuation correction in whole-body PET/MR on patients with bone metastasis using various radiotracers Eur. J. Nucl. Med. Mol. Imaging Online: http://link.springer.com/10.1007/s00259-020-04738-6 [DOI] [PMC free article] [PubMed] [Google Scholar]
- Han PK, Horng DE, Gong K, Petibon Y, Kim K, Li Q, Johnson KA, El Fakhri G, Ouyang J and Ma C 2020. MR-based PET attenuation correction using a combined ultrashort echo time/multi-echo Dixon acquisition Med. Phys Online: https://pubmed.ncbi.nlm.nih.gov/32279317/ [DOI] [PMC free article] [PubMed] [Google Scholar]
- Han X 2017. MR-based synthetic CT generation using a deep convolutional neural network method Med. Phys 44 1408–19 Online: http://doi.wiley.com/10.1002/mp.12155 [DOI] [PubMed] [Google Scholar]
- Hargreaves BA, Worters PW, Pauly KB, Pauly JM, Koch KM and Gold GE 2011. Metal-induced artifacts in MRI AJR Am J Roentgenol 197 547–55 [DOI] [PMC free article] [PubMed] [Google Scholar]
- Heußer T, Mann P, Rank CM, Schäfer M, Dimitrakopoulou-Strauss A, Schlemmer H-P, Hadaschik BA, Kopka K, Bachert P, Kachelrieß M and Freitag MT 2017. Investigation of the halo-artifact in 68Ga-PSMA-11-PET/MRI ed Thierry B PLoS One 12 e0183329 Online: https://dx.plos.org/10.1371/journal.pone.0183329 [DOI] [PMC free article] [PubMed] [Google Scholar]
- Hitz S, Habekost C, Fürst S, Delso G, Förster S, Ziegler S, Nekolla SG, Souvatzoglou M, Beer AJ, Grimmer T, Eiber M, Schwaiger M and Drzezga A 2014. Systematic Comparison of the Performance of Integrated Whole-Body PET/MR Imaging to Conventional PET/CT for 18F-FDG Brain Imaging in Patients Examined for Suspected Dementia. J. Nucl. Med 55 923–31 Online: http://jnm.snmjournals.org/cgi/doi/10.2967/jnumed.113.126813 [DOI] [PubMed] [Google Scholar]
- Hofmann M, Bezrukov I, Mantlik F, Aschoff P, Steinke F, Beyer T, Pichler BJ and Scholkopf B 2011. MRI-based attenuation correction for whole-body PET/MRI: quantitative evaluation of segmentation- and atlas-based methods J. Nucl. Med 52 1392–9 [DOI] [PubMed] [Google Scholar]
- Hofmann M, Steinke F, Scheel V, Charpiat G, Farquhar J, Aschoff P, Brady M, Scholkopf B and Pichler BJ 2008. MRI-Based Attenuation Correction for PET/MRI: A Novel Approach Combining Pattern Recognition and Atlas Registration J. Nucl. Med 49 1875–83 [DOI] [PubMed] [Google Scholar]
- Huynh T, Gao Y, Kang J, Wang L, Zhang P, Lian J and Shen D 2016. Estimating CT Image From MRI Data Using Structured Random Forest and Auto-Context Model IEEE Trans. Med. Imaging 35 174–83 Online: http://ieeexplore.ieee.org/document/7169564/ [DOI] [PMC free article] [PubMed] [Google Scholar]
- Hwang D, Kang SK, Kim KY, Seo S, Paeng JC, Lee DS and Lee JS 2019. Generation of PET attenuation map for whole-body time-of-flight 18F-FDG PET/MRI using a deep neural network trained with simultaneously reconstructed activity and attenuation maps J. Nucl. Med 60 1183–9 Online: http://jnm.snmjournals.org/lookup/doi/10.2967/jnumed.118.219493 [DOI] [PMC free article] [PubMed] [Google Scholar]
- Hwang D, Kim KY, Kang SK, Seo S, Paeng JC, Lee DS and Lee JS 2018. Improving the accuracy of simultaneously reconstructed activity and attenuation maps using deep learning J. Nucl. Med 59 1624–9 Online: http://jnm.snmjournals.org/lookup/doi/10.2967/jnumed.117.202317 [DOI] [PubMed] [Google Scholar]
- Izquierdo-Garcia D, Eldaief MC, Vangel MG and Catana C 2018. Intrascanner Reproducibility of an SPM-Based Head MR-Based Attenuation Correction Method IEEE Trans. Radiat. Plasma Med. Sci 3 327–33 [DOI] [PMC free article] [PubMed] [Google Scholar]
- Izquierdo-Garcia D, Hansen AE, Förster S, Benoit D, Schachoff S, Fürst S, Chen KT, Chonde DB and Catana C 2014. An SPM8-based approach for attenuation correction combining segmentation and nonrigid template formation: Application to simultaneous PET/MR Brain Imaging J. Nucl. Med 55 [DOI] [PMC free article] [PubMed] [Google Scholar]
- Jang H, Liu F, Bradshaw T and McMillan AB 2018a. Rapid dual-echo ramped hybrid encoding MR-based attenuation correction (dRHE-MRAC) for PET/MR. Magn. Reson. Med 79 2912–22 Online: http://doi.wiley.com/10.1002/mrm.26953 [DOI] [PMC free article] [PubMed] [Google Scholar]
- Jang H, Liu F, Zhao G, Bradshaw T and McMillan AB 2018b. Technical Note: Deep learning based MRAC using rapid ultrashort echo time imaging Med. Phys 45 3697–704 Online: http://doi.wiley.com/10.1002/mp.12964 [DOI] [PMC free article] [PubMed] [Google Scholar]
- Jin C-B, Kim H, Liu M, Jung W, Joo S, Park E, Ahn YS, Han IH, Lee J Il and Cui X 2019. Deep CT to MR Synthesis Using Paired and Unpaired Data Sensors 19 2361 Online: https://www.mdpi.com/1424-8220/19/10/2361 [DOI] [PMC free article] [PubMed] [Google Scholar]
- Johansson A, Karlsson M and Nyholm T 2011. CT substitute derived from MRI sequences with ultrashort echo time Med. Phys 38 2708–14 [DOI] [PubMed] [Google Scholar]
- Johansson E, Lubberink M, Heurling K, Eriksson JW, Skrtic S, Ahlström H and Kullberg J 2018. TECHNICAL DEVELOPMENTS: Tissue-specific Insulin Sensitivity and Body Composition Johansson et al Radiology 286 271–8 Online: http://pubs.rsna.org/doi/10.1148/radiol.2017162949%0A [DOI] [PubMed] [Google Scholar]
- Juttukonda MR, Mersereau BG, Chen Y, Su Y, Rubin BG, Benzinger TLS, Lalush DS and An H 2015. MR-based attenuation correction for PET/MRI neurological studies with continuous-valued attenuation coefficients for bone through a conversion from R2* to CT-Hounsfield units Neuroimage 112 160–8 Online: https://linkinghub.elsevier.com/retrieve/pii/S1053811915001858 [DOI] [PMC free article] [PubMed] [Google Scholar]
- Kalemis A, Delattre BMA and Heinzer S 2013. Sequential whole-body PET/MR scanner: concept, clinical use, and optimisation after two years in the clinic. The manufacturer’s perspective Magn. Reson. Mater. Physics, Biol. Med 26 5–23 Online: http://link.springer.com/10.1007/s10334-012-0330-y [DOI] [PubMed] [Google Scholar]
- Kamnitsas K, Ledig C, Newcombe VFJ, Simpson JP, Kane AD, Menon DK, Rueckert D and Glocker B 2017. Efficient multi-scale 3D CNN with fully connected CRF for accurate brain lesion segmentation Med. Image Anal 36 61–78 Online: https://linkinghub.elsevier.com/retrieve/pii/S1361841516301839 [DOI] [PubMed] [Google Scholar]
- Karakatsanis NA, Abgral R, Trivieri MG, Dweck MR, Robson PM, Calcagno C, Boeykens G, Senders ML, Mulder WJM, Tsoumpas C and Fayad ZA 2019. Hybrid PET- and MR-driven attenuation correction for enhanced 18F-NaF and 18F-FDG quantification in cardiovascular PET/MR imaging J. Nucl. Cardiol Online: 10.1007/s12350-019-01928-0 [DOI] [PMC free article] [PubMed] [Google Scholar]
- Keereman V, Fierens Y, Broux T, De Deene Y, Lonneux M and Vandenberghe S 2010. MRI-Based Attenuation Correction for PET/MRI Using Ultrashort Echo Time Sequences J. Nucl. Med 51 812–8 Online: http://jnm.snmjournals.org/content/51/5/812.abstract [DOI] [PubMed] [Google Scholar]
- Keereman V, Vandenberghe S, De Deene Y, Luypaert R and Broux T 2008. MR-based attenuation correction for PET using an Ultrashort Echo Time (UTE) sequence IEEE, Nucl. Sci. Symp. Conf. Rec 4656–61 [Google Scholar]
- Keller SH, Holm S, Hansen AE, Sattler B, Andersen F, Klausen TL, Højgaard L, Kjær A and Beyer T 2013. Image artifacts from MR-based attenuation correction in clinical, whole-body PET/MRI Magn. Reson. Mater. Physics, Biol. Med 26 173–81 Online: http://link.springer.com/10.1007/s10334-012-0345-4 [DOI] [PubMed] [Google Scholar]
- Khalifé M, Fernandez B, Jaubert O, Soussan M, Brulon V, Buvat I and Comtat C 2017. Subject-specific bone attenuation correction for brain PET/MR: Can ZTE-MRI substitute CT scan accurately? Phys. Med. Biol 62 7814–32 Online: http://stacks.iop.org/0031-9155/62/i=19/a=7814?key=crossref.eadca1ee04a8c704ffada57c864b9f19 [DOI] [PubMed] [Google Scholar]
- Khateri P, Rad HS, Fathi A and Ay MR 2013. Generation of attenuation map for MR-based attenuation correction of PET data in the head area employing 3D short echo time MR imaging Nucl. Instruments Methods Phys. Res. Sect. A Accel. Spectrometers, Detect. Assoc. Equip 702 133–6 Online: http://www.sciencedirect.com/science/article/pii/S0168900212009060 [Google Scholar]
- Khateri P, Rad HS, Jafari AH, Kazerooni AF, Akbarzadeh A, Moghadam MS, Aryan A, Ghafarian P and Ay MR 2015. Generation of a Four-Class Attenuation Map for MRI-Based Attenuation Correction of PET Data in the Head Area Using a Novel Combination of STE/Dixon-MRI and FCM Clustering Mol. IMAGING Biol 17 884–92 [DOI] [PubMed] [Google Scholar]
- Kinahan PE, Townsend DW, Beyer T and Sashin D 1998. Attenuation correction for a combined 3D PET/CT scanner Med. Phys 25 2046–53 [DOI] [PubMed] [Google Scholar]
- Klages P, Benslimane I, Riyahi S, Jiang J, Hunt M, Deasy JO, Veeraraghavan H and Tyagi N 2020. Patch‐based generative adversarial neural network models for head and neck MR‐only planning Med. Phys 47 626–42 Online: https://onlinelibrary.wiley.com/doi/abs/10.1002/mp.13927 [DOI] [PMC free article] [PubMed] [Google Scholar]
- Kläser K, Varsavsky T, Markiewicz P, Vercauteren T, Atkinson D, Thielemans K, Hutton B, Cardoso MJ and Ourselin S 2019. Improved MR to CT Synthesis for PET/MR Attenuation Correction Using Imitation Learning pp 13–21 Online: _2 [DOI] [PMC free article] [PubMed] [Google Scholar]
- Koesters T, Friedman KP, Fenchel M, Zhan Y, Hermosillo G, Babb J, Jelescu IO, Faul D, Boada FE and Shepherd TM 2016. Dixon Sequence with Superimposed Model-Based Bone Compartment Provides Highly Accurate PET/MR Attenuation Correction of the Brain J. Nucl. Med 57 918–24 Online: http://jnm.snmjournals.org/cgi/doi/10.2967/jnumed.115.166967 [DOI] [PMC free article] [PubMed] [Google Scholar]
- Kolbitsch C, Neji R, Fenchel M, Mallia A, Marsden P and Schaeffter T 2018. Respiratory-resolved MR-based attenuation correction for motion-compensated cardiac PET-MR. Phys. Med. Biol 63 135008 Online: http://stacks.iop.org/0031-9155/63/i=13/a=135008?key=crossref.9216556ec6939bfafab5cacfdda3d09e [DOI] [PubMed] [Google Scholar]
- Konečný J, McMahan HB, Yu FX, Richtárik P, Suresh AT and Bacon D 2016. Federated Learning: Strategies for Improving Communication Efficiency 1–10 Online: http://arxiv.org/abs/1610.05492 [Google Scholar]
- Kuttner S, Lassen ML, Øen SK, Sundset R, Beyer T and Eikenes L 2019. Quantitative PET/MR imaging of lung cancer in the presence of artifacts in the MR-based attenuation correction maps. Acta Radiol. 284185119848118 Online: http://journals.sagepub.com/doi/10.1177/0284185119848118 [DOI] [PubMed] [Google Scholar]
- Ladefoged CN, Andersen FL, Keller SH, Lofgren J, Hansen AE, Holm S, Hojgaard L and Beyer T 2013. PET/MR imaging of the pelvis in the presence of endoprostheses: reducing image artifacts and increasing accuracy through inpainting Eur. J. Nucl. Med. Mol. Imaging 40 594–601 [DOI] [PubMed] [Google Scholar]
- Ladefoged CN, Benoit D, Law I, Holm S, Kjær A, Højgaard L, Hansen AE and Andersen FL 2015. Region specific optimization of continuous linear attenuation coefficients based on UTE (RESOLUTE): application to PET/MR brain imaging Phys. Med. Biol 60 8047–65 Online: http://stacks.iop.org/0031-9155/60/i=20/a=8047?key=crossref.734635890123afb79cc9eb94d2b0cd10 [DOI] [PubMed] [Google Scholar]
- Ladefoged CN, Hansen AE, Keller SH, Holm S, Law I, Beyer T, Højgaard L, Kjær A and Andersen FL 2014. Impact of incorrect tissue classification in Dixon-based MR-AC: fat-water tissue inversion EJNMMI Phys. 1 101 Online: http://www.ejnmmiphys.com/content/1/1/101 [DOI] [PMC free article] [PubMed] [Google Scholar]
- Ladefoged CN, Law I, Anazodo U, St Lawrence K, Izquierdo-Garcia D, Catana C, Burgos N, Cardoso MJ, Ourselin S, Hutton B, Merida I, Costes N, Hammers A, Benoit D, Holm S, Juttukonda M, An H, Cabello J, Lukas M, Nekolla S, Ziegler S, Fenchel M, Jakoby B, Casey ME, Benzinger T, Hojgaard L, Hansen AE and Andersen FL 2016. A multi-centre evaluation of eleven clinically feasible brain PET/MRI attenuation correction techniques using a large cohort of patients Neuroimage 147 346–59 [DOI] [PMC free article] [PubMed] [Google Scholar]
- Ladefoged CN, Marner L, Hindsholm A, Law I, Højgaard L and Andersen FL 2019. Deep Learning Based Attenuation Correction of PET/MRI in Pediatric Brain Tumor Patients: Evaluation in a Clinical Setting Front. Neurosci 12 1005 Online: https://www.frontiersin.org/article/10.3389/fnins.2018.01005 [DOI] [PMC free article] [PubMed] [Google Scholar]
- Lange K and Carson R 1984. EM reconstruction algorithms for emission and transmission tomography J Comput Assist Tomogr 8 306–16 [PubMed] [Google Scholar]
- Lassen ML, Muzik O, Beyer T, Hacker M, Ladefoged CN, Cal-González J, Wadsak W, Rausch I, Langer O and Bauer M 2017. Reproducibility of Quantitative Brain Imaging Using a PET-Only and a Combined PET/MR System. Front. Neurosci 11 396 Online: http://journal.frontiersin.org/article/10.3389/fnins.2017.00396/full [DOI] [PMC free article] [PubMed] [Google Scholar]
- Lassen ML, Rasul S, Beitzke D, Stelzmüller M-E, Cal-Gonzalez J, Hacker M and Beyer T 2019. Assessment of attenuation correction for myocardial PET imaging using combined PET/MRI. J. Nucl. Cardiol 26 1107–18 Online: http://link.springer.com/10.1007/s12350-017-1118-2 [DOI] [PMC free article] [PubMed] [Google Scholar]
- Lau JMC, Laforest R, Sotoudeh H, Nie X, Sharma S, McConathy J, Novak E, Priatna A, Gropler RJ and Woodard PK 2017. Evaluation of attenuation correction in cardiac PET using PET/MR J. Nucl. Cardiol 24 839–46 Online: http://link.springer.com/10.1007/s12350-015-0197-1 [DOI] [PMC free article] [PubMed] [Google Scholar]
- Lee HT, Pryma DA and Sebro R 2020. Optimized CT Attenuation and SUV Prediction Thresholds for Differentiating Enostoses From Untreated and Treated Metastases on Attenuation-Corrected 18F-FDG PET/CT Clin. Nucl. Med 45 Online: https://journals.lww.com/nuclearmed/Fulltext/2020/01000/Optimized_CT_Attenuation_and_SUV_Prediction.5.aspx [DOI] [PubMed] [Google Scholar]
- Leynes AP, Yang J, Shanbhag DD, Kaushik SS, Seo Y, Hope TA, Wiesinger F and Larson PEZ 2017. Hybrid ZTE/Dixon MR-based attenuation correction for quantitative uptake estimation of pelvic lesions in PET/MRI Med. Phys 44 902–13 Online: http://doi.wiley.com/10.1002/mp.12122 [DOI] [PMC free article] [PubMed] [Google Scholar]
- Leynes AP, Yang J, Wiesinger F, Kaushik SS, Shanbhag DD, Seo Y, Hope TA and Larson PEZ 2018. Zero-Echo-Time and Dixon Deep Pseudo-CT (ZeDD CT): Direct Generation of Pseudo-CT Images for Pelvic PET/MRI Attenuation Correction Using Deep Convolutional Neural Networks with Multiparametric MRI. J. Nucl. Med 59 852–8 Online: http://jnm.snmjournals.org/lookup/doi/10.2967/jnumed.117.198051 [DOI] [PMC free article] [PubMed] [Google Scholar]
- Lillington J, Brusaferri L, Kläser K, Shmueli K, Neji R, Hutton BF, Fraioli F, Arridge S, Cardoso MJ, Ourselin S, Thielemans K and Atkinson D 2020. PET/MRI attenuation estimation in the lung: A review of past, present, and potential techniques Med. Phys 47 790–811 Online: https://onlinelibrary.wiley.com/doi/abs/10.1002/mp.13943 [DOI] [PMC free article] [PubMed] [Google Scholar]
- Lindemann ME, Guberina N, Wetter A, Fendler WP, Jakoby B and Quick HH 2019a. Improving 68 Ga-PSMA PET/MRI of the Prostate with Unrenormalized Absolute Scatter Correction J. Nucl. Med 60 1642–8 Online: http://jnm.snmjournals.org/lookup/doi/10.2967/jnumed.118.224139 [DOI] [PubMed] [Google Scholar]
- Lindemann ME, Nensa F and Quick HH 2019b. Impact of improved attenuation correction on 18F-FDG PET/MR hybrid imaging of the heart ed G Treglia PLoS One 14 e0214095 Online: http://dx.plos.org/10.1371/journal.pone.0214095 [DOI] [PMC free article] [PubMed] [Google Scholar]
- Lindemann ME, Oehmigen M, Blumhagen JO, Gratz M and Quick HH 2017. MR-based truncation and attenuation correction in integrated PET/MR hybrid imaging using HUGE with continuous table motion. Med. Phys 44 4559–72 Online: http://doi.wiley.com/10.1002/mp.12449 [DOI] [PubMed] [Google Scholar]
- Liu F, Jang H, Kijowski R, Bradshaw T and McMillan AB 2018a. Deep learning MR imaging-based attenuation correction for PET/MR imaging Radiology 286 676–84 [DOI] [PMC free article] [PubMed] [Google Scholar]
- Liu F, Jang H, Kijowski R, Zhao G, Bradshaw T and McMillan AB 2018b. A deep learning approach for 18F-FDG PET attenuation correction EJNMMI Phys. 5 24 Online: http://www.pubmedcentral.nih.gov/articlerender.fcgi?artid=PMC6230542 [DOI] [PMC free article] [PubMed] [Google Scholar]
- Liu G, Cao T, Hu L, Zheng J, Pang L, Hu P, Gu Y and Shi H 2019. Validation of MR-Based Attenuation Correction of a Newly Released Whole-Body Simultaneous PET/MR System Biomed Res. Int 2019 [DOI] [PMC free article] [PubMed] [Google Scholar]
- Lois C, Bezrukov I, Schmidt H, Schwenzer N, Werner MK, Kupferschlager J and Beyer T 2012. Effect of MR contrast agents on quantitative accuracy of PET in combined whole-body PET/MR imaging Eur. J. Nucl. Med. Mol. Imaging 39 1756–66 [DOI] [PubMed] [Google Scholar]
- Mansur A, Newbould R, Searle GE, Redstone C, Gunn RN and Hallett WA 2018. PET-MR Attenuation Correction in Dynamic Brain PET Using [ 11 C]Cimbi-36: A Direct Comparison With PET-CT IEEE Trans. Radiat. Plasma Med. Sci 2 483–9 Online: https://ieeexplore.ieee.org/document/8402147/ [Google Scholar]
- Marshall HR, Patrick J, Laidley D, Prato FS, Butler J, Théberge J, Thompson RT and Stodilka RZ 2013. Description and assessment of a registration-based approach to include bones for attenuation correction of whole-body PET/MRI Med. Phys 40 082509 Online: http://doi.wiley.com/10.1118/1.4816301 [DOI] [PubMed] [Google Scholar]
- Marshall HR, Prato FS, Deans L, Theberge J, Thompson RT and Stodilka RZ 2012. Variable lung density consideration in attenuation correction of whole-body PET/MRI J. Nucl. Med Online: http://jnm.snmjournals.org/content/early/2012/05/07/jnumed.111.098350.abstract [DOI] [PubMed] [Google Scholar]
- Marshall HR, Stodilka RZ, Theberge J, Sabondjian E, Legros A, Deans L, Sykes JM, Thompson RT and Prato FS 2011. A comparison of MR-based attenuation correction in PET versus SPECT Phys. Med. Biol 56 4613–29 Online: http://stacks.iop.org/0031-9155/56/i=14/a=024?key=crossref.282aca957b2a8fae6a30e02bac98f043 [DOI] [PubMed] [Google Scholar]
- Martinez-Moller A, Souvatzoglou M, Delso G, Bundschuh RA, Chefd’hotel C, Ziegler SI, Navab N, Schwaiger M and Nekolla SG 2009. Tissue classification as a potential approach for attenuation correction in whole-body PET/MRI: evaluation with PET/CT data J. Nucl. Med 50 520–6 Online: http://jnm.snmjournals.org/content/50/4/520.abstract [DOI] [PubMed] [Google Scholar]
- Maspero M, Savenije MHF, Dinkla AM, Seevinck PR, Intven MPW, Jurgenliemk-Schulz IM, Kerkmeijer LGW and van den Berg CAT 2018. Dose evaluation of fast synthetic-CT generation using a generative adversarial network for general pelvis MR-only radiotherapy Phys. Med. Biol 63 185001 Online: http://stacks.iop.org/0031-9155/63/i=18/a=185001?key=crossref.60c1b042736930380d690f90842c2ad0 [DOI] [PubMed] [Google Scholar]
- Mehranian A and Zaidi H 2015a. Emission-based estimation of lung attenuation coefficients for attenuation correction in time-of-flight PET/MR Phys. Med. Biol 60 4813–33 Online: http://stacks.iop.org/0031-9155/60/i=12/a=4813?key=crossref.ee3b9a0b4e37523b731dbf8605f6d42f [DOI] [PubMed] [Google Scholar]
- Mehranian A and Zaidi H 2015b. Impact of time-of-flight PET on quantification errors in MR imaging-based attenuation correction. J. Nucl. Med 56 635–41 Online: http://jnm.snmjournals.org/cgi/doi/10.2967/jnumed.114.148817 [DOI] [PubMed] [Google Scholar]
- Mehranian A, Zaidi H and Reader AJ 2017. MR-guided joint reconstruction of activity and attenuation in brain PET-MR Neuroimage 162 276–88 Online: https://linkinghub.elsevier.com/retrieve/pii/S1053811917307449 [DOI] [PubMed] [Google Scholar]
- Merida I, Costes N, Heckemann RA, Drzezga A, Forster S and Hammers A 2015. Evaluation of several multi-atlas methods for pseudo-CT generation in brain MRI-PET attenuation correction 2015 IEEE 12th International Symposium on Biomedical Imaging (ISBI) IEEE International Symposium on Biomedical Imaging (NEW YORK, NY, USA: IEEE; ) pp 1431–4 [Google Scholar]
- Mérida I, Reilhac A, Redouté J, Heckemann RA, Costes N and Hammers A 2017. Multi-atlas attenuation correction supports full quantification of static and dynamic brain PET data in PET-MR Phys. Med. Biol 62 2834–58 Online: http://stacks.iop.org/0031-9155/62/i=7/a=2834?key=crossref.50b9106049db9f249347690af6e2c5f5 [DOI] [PubMed] [Google Scholar]
- Mollet P, Keereman V, Bini J, Izquierdo-Garcia D, Fayad ZA and Vandenberghe S 2014. Improvement of Attenuation Correction in Time-of-Flight PET/MR Imaging with a Positron-Emitting Source J. Nucl. Med 55 329–36 [DOI] [PMC free article] [PubMed] [Google Scholar]
- Mollet P, Keereman V, Clementel E and Vandenberghe S 2012. Simultaneous MR-Compatible Emission and Transmission Imaging for PET Using Time-of-Flight Information Med. Imaging, IEEE Trans 31 1734–42 [DOI] [PubMed] [Google Scholar]
- Montandon ML and Zaidi H 2005. Atlas-guided non-uniform attenuation correction in cerebral 3D PET imaging Neuroimage 25 278–86 [DOI] [PubMed] [Google Scholar]
- Montesi SB, Izquierdo-Garcia D, Desogere P, Abston E, Liang LL, Digumarthy S, Seethamraju R, Lanuti M, Caravan P and Catana C 2019. Type I Collagen-targeted Positron Emission Tomography Imaging in Idiopathic Pulmonary Fibrosis: First-in-Human Studies. Am. J. Respir. Crit. Care Med 200 258–61 [DOI] [PMC free article] [PubMed] [Google Scholar]
- Muehe AM, Yerneni K, Theruvath AJ, Thakor AS, Pribnow A, Avedian R, Steffner R, Rosenberg J, Hawk KE and Daldrup-Link HE 2019. Ferumoxytol Does Not Impact Standardized Uptake Values on PET/MR Scans. Mol. imaging Biol Online: 10.1007/s11307-019-01409-3 [DOI] [PMC free article] [PubMed] [Google Scholar]
- Nakamoto Y, Osman M, Cohade C, Marshall LT, Links JM, Kohlmyer S and Wahl RL 2002. PET/CT: Comparison of quantitative tracer uptake between germanium and CT transmission attenuation-corrected images J. Nucl. Med 43 1137–43 [PubMed] [Google Scholar]
- Navalpakkam BK, Braun H, Kuwert T and Quick HH 2013. Magnetic resonance-based attenuation correction for PET/MR hybrid imaging using continuous valued attenuation maps Invest Radiol. 48 323–32. doi: 10.1097/RLI.0b013e318283292f. [DOI] [PubMed] [Google Scholar]
- Nensa F, Poeppel TD, Beiderwellen K, Schelhorn J, Mahabadi AA, Erbel R, Heusch P, Nassenstein K, Bockisch A, Forsting M and Schlosser T 2013. Hybrid PET/MR imaging of the heart: feasibility and initial results. Radiology 268 366–73 Online: http://pubs.rsna.org/doi/10.1148/radiol.13130231 [DOI] [PubMed] [Google Scholar]
- Nie D, Cao X, Gao Y, Wang L and Shen D 2016. Estimating CT Image from MRI Data Using 3D Fully Convolutional Networks Lecture Notes in Computer Science (including subseries Lecture Notes in Artificial Intelligence and Lecture Notes in Bioinformatics) vol 10008 LNCS (NIH Public Access) pp 170–8 Online: http://link.springer.com/10.1007/978-3-319-46976-8_18 [DOI] [PMC free article] [PubMed] [Google Scholar]
- Nuyts J, Bal G, Kehren F, Fenchel M, Michel C and Watson C 2013. Completion of a Truncated Attenuation Image From the Attenuated PET Emission Data Med. Imaging, IEEE Trans 32 237–46 [DOI] [PubMed] [Google Scholar]
- Nuyts J, Dupont P, Stroobants S, Benninck R, Mortelmans L and Suetens P 1999. Simultaneous maximum a posteriori reconstruction of attenuation and activity distributions from emission sinograms IEEE Trans Med Imaging 18 393–403 [DOI] [PubMed] [Google Scholar]
- Nuyts J, Michel C, Fenchel M, Bal G, Watson C and Ieee 2010. Completion of a Truncated Attenuation Image from the Attenuated PET Emission Data 2010 IEEE Nuclear Science Symposium Conference Record (New York: Ieee; ) pp 2123–7 [DOI] [PubMed] [Google Scholar]
- Oehmigen M, Lindemann ME, Gratz M, Kirchner J, Ruhlmann V, Umutlu L, Blumhagen JO, Fenchel M and Quick HH 2018a. Impact of improved attenuation correction featuring a bone atlas and truncation correction on PET quantification in whole-body PET/MR. Eur. J. Nucl. Med. Mol. Imaging 45 642–53 Online: http://link.springer.com/10.1007/s00259-017-3864-4 [DOI] [PubMed] [Google Scholar]
- Oehmigen M, Lindemann ME, Gratz M, Neji R, Hammers A, Sauer M, Lanz T and Quick HH 2018b. A dual‐tuned 13 C/ 1 H head coil for PET / MR hybrid neuroimaging: Development, attenuation correction, and first evaluation Med. Phys 45 4877–87 Online: https://onlinelibrary.wiley.com/doi/abs/10.1002/mp.13171 [DOI] [PubMed] [Google Scholar]
- Oehmigen M, Lindemann ME, Lanz T, Kinner S and Quick HH 2016. Integrated PET/MR breast cancer imaging: Attenuation correction and implementation of a 16-channel RF coil Med. Phys 43 4808–20 Online: http://www.ncbi.nlm.nih.gov/pubmed/27487899 [DOI] [PubMed] [Google Scholar]
- Okazawa H, Tsujikawa T, Higashino Y, Kikuta KI, Mori T, Makino A and Kiyono Y 2019. No significant difference found in PET/MRI CBF values reconstructed with CT-atlas-based and ZTE MR attenuation correction EJNMMI Res. 9 Online: 10.1186/s13550-019-0494-9 [DOI] [PMC free article] [PubMed] [Google Scholar]
- Olin A, Ladefoged CN, Langer NH, Keller SH, Löfgren J, Hansen AE, Kjær A, Langer SW, Fischer BM and Andersen FL 2018. Reproducibility of MR-Based Attenuation Maps in PET/MRI and the Impact on PET Quantification in Lung Cancer. J. Nucl. Med 59 999–1004 Online: http://jnm.snmjournals.org/lookup/doi/10.2967/jnumed.117.198853 [DOI] [PubMed] [Google Scholar]
- Pace L, Nicolai E, Luongo A, Aiello M, Catalano OA, Soricelli A and Salvatore M 2014. Comparison of whole-body PET/CT and PET/MRI in breast cancer patients: Lesion detection and quantitation of 18F-deoxyglucose uptake in lesions and in normal organ tissues Eur. J. Radiol 83 289–96 Online: https://linkinghub.elsevier.com/retrieve/pii/S0720048X13005925 [DOI] [PubMed] [Google Scholar]
- Partovi S, Kohan A, Vercher-Conejero JL, Rubbert C, Margevicius S, Schluchter MD, Gaeta C, Faulhaber P and Robbin MR 2014. Qualitative and Quantitative Performance of 18 F-FDGPET/MRI versus 18 F-FDG-PET/CT in Patients with Head and Neck Cancer Am. J. Neuroradiol 35 1970–5 Online: http://www.ajnr.org/lookup/doi/10.3174/ajnr.A3993 [DOI] [PMC free article] [PubMed] [Google Scholar]
- Paulus DH, Braun H, Aklan B and Quick HH 2012. Simultaneous PET/MR imaging: MR-based attenuation correction of local radiofrequency surface coils Med. Phys 39 4306–15 [DOI] [PubMed] [Google Scholar]
- Paulus DH and Quick HH 2016. Hybrid Positron Emission Tomography/Magnetic Resonance Imaging Invest. Radiol 51 624–34 Online: http://www.ncbi.nlm.nih.gov/pubmed/27175550 [DOI] [PubMed] [Google Scholar]
- Paulus DH, Quick HH, Geppert C, Fenchel M, Zhan Y, Hermosillo G, Faul D, Boada F, Friedman KP and Koesters T 2015. Whole-Body PET/MR Imaging: Quantitative Evaluation of a Novel Model-Based MR Attenuation Correction Method Including Bone. J. Nucl. Med 56 1061–6 Online: http://jnm.snmjournals.org/cgi/doi/10.2967/jnumed.115.156000 [DOI] [PMC free article] [PubMed] [Google Scholar]
- Poynton CB, Chen KT, Chonde DB, Izquierdo-Garcia D, Gollub RL, Gerstner ER, Batchelor TT and Catana C 2014. Probabilistic atlas-based segmentation of combined T1-weighted and DUTE MRI for calculation of head attenuation maps in integrated PET/MRI scanners Am J Nucl Med Mol Imaging 4 160–71 [PMC free article] [PubMed] [Google Scholar]
- Pozaruk A, Pawar K, Li S, Carey A, Cheng J, Sudarshan VP, Cholewa M, Grummet J, Chen Z and Egan G 2020. Augmented deep learning model for improved quantitative accuracy of MR-based PET attenuation correction in PSMA PET-MRI prostate imaging Eur. J. Nucl. Med. Mol. Imaging [DOI] [PubMed] [Google Scholar]
- Qian P, Chen Y, Kuo J-W, Zhang Y-D, Jiang Y, Zhao K, Helo R Al, Friel H, Baydoun A, Zhou F, Heo JU, Avril N, Herrmann K, Ellis R, Traughber B, Jones RS, Wang S, Su K-H and Muzic RF 2019. mDixon-Based Synthetic CT Generation for PET Attenuation Correction on Abdomen and Pelvis Jointly Using Transfer Fuzzy Clustering and Active Learning-Based Classification. IEEE Trans. Med. Imaging 1–1 Online: https://ieeexplore.ieee.org/document/8804223/ [DOI] [PMC free article] [PubMed] [Google Scholar]
- Rahmim A, Lodge MA, Karakatsanis NA, Panin VY, Zhou Y, McMillan A, Cho S, Zaidi H, Casey ME and Wahl RL 2019. Dynamic whole-body PET imaging: principles, potentials and applications Eur. J. Nucl. Med. Mol. Imaging 46 501–18 [DOI] [PubMed] [Google Scholar]
- Rai R, Manton D, Jameson MG, Josan S, Barton MB, Holloway LC and Liney GP 2018. 3D printed phantoms mimicking cortical bone for the assessment of ultrashort echo time magnetic resonance imaging Med. Phys 45 758–66 Online: http://doi.wiley.com/10.1002/mp.12727 [DOI] [PubMed] [Google Scholar]
- Rausch I, Rischka L, Ladefoged CN, Furtner J, Fenchel M, Hahn A, Lanzenberger R, Mayerhoefer ME, Traub-Weidinger T and Beyer T 2017. PET/MRI for Oncologic Brain Imaging: A Comparison of Standard MR-Based Attenuation Corrections with a Model-Based Approach for the Siemens mMR PET/MR System. J. Nucl. Med 58 1519–25 Online: http://jnm.snmjournals.org/lookup/doi/10.2967/jnumed.116.186148 [DOI] [PubMed] [Google Scholar]
- Rausch I, Rust P, DiFranco MD, Lassen M, Stadlbauer A, Mayerhoefer ME, Hartenbach M, Hacker M and Beyer T 2016. Reproducibility of MRI Dixon-Based Attenuation Correction in Combined PET/MR with Applications for Lean Body Mass Estimation. J. Nucl. Med 57 1096–101 Online: http://jnm.snmjournals.org/cgi/doi/10.2967/jnumed.115.168294 [DOI] [PubMed] [Google Scholar]
- Rauscher I, Eiber M, Fürst S, Souvatzoglou M, Nekolla SG, Ziegler SI, Rummeny EJ, Schwaiger M and Beer AJ 2014. PET/MR imaging in the detection and characterization of pulmonary lesions: Technical and diagnostic evaluation in comparison to PET/CT J. Nucl. Med 55 724–9 Online: http://jnm.snmjournals.org/cgi/doi/10.2967/jnumed.113.129247 [DOI] [PubMed] [Google Scholar]
- Reichert ILH, Robson MD, Gatehouse PD, He TG, Chappell KE, Holmes J, Girgis S and Bydder GM 2005. Magnetic resonance imaging of cortical bone with ultrashort TE pulse sequences Magn. Reson. Imaging 23 611–8 [DOI] [PubMed] [Google Scholar]
- Ripa RS, Knudsen A, Hag AMF, Lebech A-M, Loft A, Keller SH, Hansen AE, von Benzon E, Højgaard L and Kjær A 2013. Feasibility of simultaneous PET/MR of the carotid artery: first clinical experience and comparison to PET/CT. Am. J. Nucl. Med. Mol. Imaging 3 361–71 [PMC free article] [PubMed] [Google Scholar]
- Rischka L, Gryglewski G, Berroterán-Infante N, Rausch I, James GM, Klöbl M, Sigurdardottir H, Hartenbach M, Hahn A, Wadsak W, Mitterhauser M, Beyer T, Kasper S, Prayer D, Hacker M and Lanzenberger R 2019. Attenuation Correction Approaches for Serotonin Transporter Quantification With PET/MRI. Front. Physiol 10 1422 Online: https://www.frontiersin.org/article/10.3389/fphys.2019.01422/full [DOI] [PMC free article] [PubMed] [Google Scholar]
- Robson MD and Bydder GM 2006. Clinical ultrashort echo time imaging of bone and other connective tissues NMR Biomed. 19 765–80 [DOI] [PubMed] [Google Scholar]
- Robson PM, Vergani V, Benkert T, Trivieri MG, Karakatsanis NA, Abgral R, Dweck MR, Moreno PR, Kovacic JC, Block KT and Fayad ZA 2020. Assessing the qualitative and quantitative impacts of simple two-class vs multiple tissue-class MR-based attenuation correction for cardiac PET/MR J. Nucl. Cardiol Online: http://link.springer.com/10.1007/s12350-019-02002-5 [DOI] [PMC free article] [PubMed] [Google Scholar]
- Ronneberger O, Fischer P and Brox T 2015. U-Net: Convolutional Networks for Biomedical Image Segmentation pp 234–41 Online: http://link.springer.com/10.1007/978-3-319-24574-4_28 [Google Scholar]
- Rota Kops E and Herzog H 2008. Template-based attenuation correction of PET in hybrid MR-PET scanners Soc. Nucl. Med. Annu. Meet. Abstr 49 162P-c Online: http://jnumedmtg.snmjournals.org [Google Scholar]
- Rothfuss H, Panin V, Moor A, Young J, Hong I, Michel C, Hamill J and Casey M 2014. LSO background radiation as a transmission source using time of flight Phys. Med. Biol 59 5483–500 Online: http://stacks.iop.org/0031-9155/59/i=18/a=5483?key=crossref.3abb17db2a01027a6a8f936abfe9d77b [DOI] [PubMed] [Google Scholar]
- Roy S, Wang WT, Carass A, Prince JL, Butman JA and Pham DL 2014. PET attenuation correction using synthetic CT from ultrashort echo-time MR imaging J. Nucl. Med 55 2071–7 Online: http://www.ncbi.nlm.nih.gov/pubmed/25413135 [DOI] [PMC free article] [PubMed] [Google Scholar]
- Salomon A, Goedicke A, Schweizer B, Aach T and Schulz V 2011. Simultaneous reconstruction of activity and attenuation for PET/MR IEEE Trans Med Imaging. 30 804–13. doi: 10.1109/TMI.2010.2095464. Epub 2010 N [DOI] [PubMed] [Google Scholar]
- Samarin A, Burger C, Wollenweber SD, Crook DW, Burger IA, Schmid DT, von Schulthess GK and Kuhn FP 2012. PET/MR imaging of bone lesions – implications for PET quantification from imperfect attenuation correction Eur. J. Nucl. Med. Mol. Imaging 39 1154–60 Online: http://link.springer.com/10.1007/s00259-012-2113-0 [DOI] [PubMed] [Google Scholar]
- Samarin A, Hüllner M, Queiroz MA, Stolzmann P, Burger IA, von Schulthess G and Veit-Haibach P 2015. 18F-FDG-PET/MR increases diagnostic confidence in detection of bone metastases compared with 18F-FDG-PET/CT. Nucl. Med. Commun 36 1165–73 Online: http://content.wkhealth.com/linkback/openurl?sid=WKPTLP:landingpage&an=00006231-201512000-00002 [DOI] [PubMed] [Google Scholar]
- Sander CY, Keil B, Chonde DB, Rosen BR, Catana C and Wald LL 2015. A 31-channel MR brain array coil compatible with positron emission tomography Magn. Reson. Med 73 [DOI] [PMC free article] [PubMed] [Google Scholar]
- Sawicki LM, Grueneisen J, Buchbender C, Schaarschmidt BM, Gomez B, Ruhlmann V, Wetter A, Umutlu L, Antoch G and Heusch P 2016a. Comparative performance of 18F-FDG PET/MRI and 18F-FDG PET/CT in detection and characterization of pulmonary lesions in 121 oncologic patients J. Nucl. Med 57 582–6 Online: http://jnm.snmjournals.org/cgi/doi/10.2967/jnumed.115.167486 [DOI] [PubMed] [Google Scholar]
- Sawicki LM, Grueneisen J, Schaarschmidt BM, Buchbender C, Nagarajah J, Umutlu L, Antoch G and Kinner S 2016b. Evaluation of 18 F-FDG PET/MRI, 18 F-FDG PET/CT, MRI, and CT in whole-body staging of recurrent breast cancer Eur. J. Radiol 85 459–65 Online: http://www.ncbi.nlm.nih.gov/pubmed/26781152 [DOI] [PubMed] [Google Scholar]
- Schramm G, Langner J, Hofheinz F, Petr J, Beuthien-Baumann B, Platzek I, Steinbach J, Kotzerke J and van den Hoff J 2013a. Quantitative accuracy of attenuation correction in the Philips Ingenuity TF whole-body PET/MR system: a direct comparison with transmission-based attenuation correction. MAGMA 26 115–26 Online: http://link.springer.com/10.1007/s10334-012-0328-5 [DOI] [PMC free article] [PubMed] [Google Scholar]
- Schramm G, Langner J, Hofheinz F, Petr J, Lougovski A, Beuthien-Baumann B, Platzek I and van den Hoff J 2013b. Influence and Compensation of Truncation Artifacts in MR-Based Attenuation Correction in PET/MR IEEE Trans Med Imaging 32 2056–63 [DOI] [PubMed] [Google Scholar]
- Schramm G, Maus J, Hofheinz F, Petr J, Lougovski A, Beuthien-Baumann B, Oehme L, Platzek I and Van Den Hoff J 2015. Correction of quantification errors in pelvic and spinal lesions caused by ignoring higher photon attenuation of bone in [18F]NaF PET/MR Med. Phys 42 6468–76 Online: https://onlinelibrary.wiley.com/doi/abs/10.1118/1.4932367 [DOI] [PubMed] [Google Scholar]
- Schreibmann E, Nye JA, Schuster DM, Martin DR, Votaw J and Fox T 2010. MR-based attenuation correction for hybrid PET-MR brain imaging systems using deformable image registration Med. Phys 37 2101–9 Online: http://doi.wiley.com/10.1118/1.3377774 [DOI] [PubMed] [Google Scholar]
- Schulz V, Torres-Espallardo I, Renisch S, Hu Z, Ojha N, Bornert P, Perkuhn M, Niendorf T, Schafer WM, Brockmann H, Krohn T, Buhl A, Gunther RW, Mottaghy FM and Krombach GA 2011. Automatic, three-segment, MR-based attenuation correction for whole-body PET/MR data Eur. J. Nucl. Med. Mol. Imaging 38 138–52 [DOI] [PubMed] [Google Scholar]
- Schwartz M, Gavane SC, Bou-Ayache J, Kolev V, Zakashansky K, Prasad-Hayes M, Taouli B, Chuang L and Kostakoglu L 2018. Feasibility and diagnostic performance of hybrid PET/MRI compared with PET/CT for gynecological malignancies: a prospective pilot study. Abdom. Radiol. (New York) 43 3462–7 Online: http://link.springer.com/10.1007/s00261-018-1665-2 [DOI] [PubMed] [Google Scholar]
- Seith F, Schmidt H, Gatidis S, Bezrukov I, Schraml C, Pfannenberg C, la Fougère C, Nikolaou K and Schwenzer N 2017. SUV-quantification of physiological lung tissue in an integrated PET/MR-system: Impact of lung density and bone tissue. ed Gelovani JG PLoS One 12 e0177856 Online: https://dx.plos.org/10.1371/journal.pone.0177856 [DOI] [PMC free article] [PubMed] [Google Scholar]
- Sekine T, Buck A, Delso G, Kemp B, ter Voert EEGW, Huellner M, Veit-Haibach P, Kaushik S, Wiesinger F and Warnock G 2020. The impact of atlas-based MR attenuation correction on the diagnosis of FDG-PET/MR for Alzheimer’s diseases—A simulation study combining multi-center data and ADNI-data ed T Pyka PLoS One 15 e0233886 Online: https://dx.plos.org/10.1371/journal.pone.0233886 [DOI] [PMC free article] [PubMed] [Google Scholar]
- Sekine T, Buck A, Delso G, ter Voert EEGW, Huellner M, Veit-Haibach P and Warnock G 2016a. Evaluation of Atlas-Based Attenuation Correction for Integrated PET/MR in Human Brain: Application of a Head Atlas and Comparison to True CT-Based Attenuation Correction J. Nucl. Med 57 215–20 Online: http://jnm.snmjournals.org/cgi/doi/10.2967/jnumed.115.159228 [DOI] [PubMed] [Google Scholar]
- Sekine T, Burgos N, Warnock G, Huellner M, Buck A, Ter Voert EEGW, Jorge Cardoso M, Hutton BF, Ourselin S, Veit-Haibach P and Delso G 2016b. Multi-atlas-based attenuation correction for brain 18F-FDG PET imaging using a time-of-flight PET/MR scanner: Comparison with clinical single-atlas-and CT-based attenuation correction J. Nucl. Med 57 1258–64 Online: http://jnm.snmjournals.org/cgi/doi/10.2967/jnumed.115.169045 [DOI] [PubMed] [Google Scholar]
- Sekine T, Ter Voert EEGW, Warnock G, Buck A, Huellner M, Veit-Haibach P and Delso G 2016c. Clinical evaluation of zero-echo-time attenuation correction for brain 18F-FDG PET/MRI: Comparison with atlas attenuation correction J. Nucl. Med 57 1927–32 Online: http://jnm.snmjournals.org/cgi/doi/10.2967/jnumed.116.175398 [DOI] [PubMed] [Google Scholar]
- Sensakovic WF and Armato SG 2008. Magnetic Resonance Imaging of the Lung: Automated Segmentation Methods General Methods and Overviews, Lung Carcinoma and Prostate Carcinoma (Dordrecht: Springer Netherlands; ) pp 219–34 Online: _14 [Google Scholar]
- Sgard B, Khalifé M, Bouchut A, Fernandez B, Soret M, Giron A, Zaslavsky C, Delso G, Habert M-O and Kas A 2019. ZTE MR-based attenuation correction in brain FDG-PET/MR: performance in patients with cognitive impairment. Eur. Radiol Online: http://link.springer.com/10.1007/s00330-019-06514-z [DOI] [PubMed] [Google Scholar]
- Shandiz MS, Rad HS, Ghafarian P, Karam MB, Akbarzadeh A and Ay MR 2017. MR-guided attenuation map for prostate PET-MRI: an intensity and morphologic-based segmentation approach for generating a five-class attenuation map in pelvic region Ann. Nucl. Med 31 29–39 Online: http://link.springer.com/10.1007/s12149-016-1128-1 [DOI] [PubMed] [Google Scholar]
- Shandiz MS, Rad HS, Ghafarian P, Yaghoubi K and Ay MR 2018. Capturing Bone Signal in MRI of Pelvis, as a Large FOV Region, Using TWIST Sequence and Generating a 5-Class Attenuation Map for Prostate PET/MRI Imaging. Mol. Imaging 17 1536012118789314 Online: http://journals.sagepub.com/doi/10.1177/1536012118789314 [DOI] [PMC free article] [PubMed] [Google Scholar]
- Shi K, Fürst S, Sun L, Lukas M, Navab N, Förster S and Ziegler SI 2017. Individual refinement of attenuation correction maps for hybrid PET/MR based on multi-resolution regional learning. Comput. Med. Imaging Graph 60 50–7 Online: https://linkinghub.elsevier.com/retrieve/pii/S0895611116301033 [DOI] [PubMed] [Google Scholar]
- Sjölund J, Forsberg D, Andersson M and Knutsson H 2015. Generating patient specific pseudo-CT of the head from MR using atlas-based regression Phys. Med. Biol 60 825–39 Online: http://stacks.iop.org/0031-9155/60/i=2/a=825?key=crossref.914138c4819752a0c5bd771023bb2cbb [DOI] [PubMed] [Google Scholar]
- Sousa JM, Appel L, Engström M, Papadimitriou S, Nyholm D, Larsson E-M, Ahlström H and Lubberink M 2018. Evaluation of zero-echo-time attenuation correction for integrated PET/MR brain imaging-comparison to head atlas and 68Ge-transmission-based attenuation correction. EJNMMI Phys. 5 20 Online: https://ejnmmiphys.springeropen.com/articles/10.1186/s40658-018-0220-0 [DOI] [PMC free article] [PubMed] [Google Scholar]
- Spadea MF, Pileggi G, Zaffino P, Salome P, Catana C, Izquierdo-Garcia D, Amato F and Seco J 2019. Deep Convolution Neural Network (DCNN) Multiplane Approach to Synthetic CT Generation From MR images—Application in Brain Proton Therapy Int. J. Radiat. Oncol 105 495–503 Online: https://linkinghub.elsevier.com/retrieve/pii/S0360301619334236 [DOI] [PubMed] [Google Scholar]
- Spick C, Herrmann K and Czernin J 2016. 18F-FDG PET/CT and PET/MRI perform equally well in cancer: Evidence from studies on more than 2,300 patients J. Nucl. Med 57 420–30 Online: http://jnm.snmjournals.org/cgi/doi/10.2967/jnumed.115.158808 [DOI] [PMC free article] [PubMed] [Google Scholar]
- Su K-H, Friel HT, Kuo J-W, Al Helo R, Baydoun A, Stehning C, Crisan AN, Traughber MS, Devaraj A, Jordan DW, Qian P, Leisser A, Ellis RJ, Herrmann KA, Avril N, Traughber BJ and Muzic RF 2019. UTE-mDixon-based thorax synthetic CT generation. Med. Phys 46 3520–31 Online: https://onlinelibrary.wiley.com/doi/abs/10.1002/mp.13574 [DOI] [PMC free article] [PubMed] [Google Scholar]
- Sundar LKS, Muzik O, Rischka L, Hahn A, Rausch I, Lanzenberger R, Hienert M, Klebermass EM, Füchsel FG, Hacker M, Pilz M, Pataraia E, Traub-Weidinger T and Beyer T 2019. Towards quantitative [18F]FDG-PET/MRI of the brain: Automated MR-driven calculation of an image-derived input function for the non-invasive determination of cerebral glucose metabolic rates J. Cereb. Blood Flow Metab 39 1516–30 [DOI] [PMC free article] [PubMed] [Google Scholar]
- Sutter R, Ulbrich EJ, Jellus V, Nittka M and Pfirrmann CWA 2012. Reduction of Metal Artifacts in Patients with Total Hip Arthroplasty with Slice-encoding Metal Artifact Correction and View-Angle Tilting MR Imaging Radiology 265 204–14 [DOI] [PubMed] [Google Scholar]
- Thomas BA, Molton JS, Leek F, Pang Y, Totman JJ, Paton NI and Townsend DW 2017. A comparison of 18F-FDG PET/MR with PET/CT in pulmonary tuberculosis Nucl. Med. Commun 38 971–8 Online: http://insights.ovid.com/crossref?an=00006231-201711000-00012 [DOI] [PubMed] [Google Scholar]
- Torrado-Carvajal A, Herraiz JL, Alcain E, Montemayor AS, Garcia-Canamaque L, Hernandez-Tamames JA, Rozenholc Y and Malpica N 2016. Fast Patch-Based Pseudo-CT Synthesis from T1-Weighted MR Images for PET/MR Attenuation Correction in Brain Studies J. Nucl. Med 57 136–43 Online: http://jnm.snmjournals.org/cgi/doi/10.2967/jnumed.115.156299 [DOI] [PubMed] [Google Scholar]
- Torrado-Carvajal A, Vera-Olmos J, Izquierdo-Garcia D, Catalano OA, Morales MA, Margolin J, Soricelli A, Salvatore M, Malpica N and Catana C 2019. Dixon-VIBE Deep Learning (DIVIDE) Pseudo-CT Synthesis for Pelvis PET/MR Attenuation Correction J. Nucl. Med 60 429–35 Online: http://jnm.snmjournals.org/lookup/doi/10.2967/jnumed.118.209288 [DOI] [PMC free article] [PubMed] [Google Scholar]
- Torres L, Kammerman J, Hahn AD, Zha W, Nagle SK, Johnson K, Sandbo N, Meyer K, Schiebler M and Fain SB 2019. Structure-Function Imaging of Lung Disease Using Ultrashort Echo Time MRI Acad. Radiol 26 431–41 Online: https://linkinghub.elsevier.com/retrieve/pii/S107663321830566X [DOI] [PMC free article] [PubMed] [Google Scholar]
- Tsujikawa T, Kanno M, Ito Y, Oikawa H, Rahman MGM, Narita N, Fujieda S and Okazawa H 2020. Zero Echo Time-Based PET/MRI Attenuation Correction in Patients with Oral Cavity Cancer: Initial Experience Clin. Nucl. Med 45 501–5 [DOI] [PubMed] [Google Scholar]
- Ulano A, Bredella MA, Burke P, Chebib I, Simeone FJ, Huang AJ, Torriani M and Chang CY 2016. Distinguishing Untreated Osteoblastic Metastases From Enostoses Using CT Attenuation Measurements Am. J. Roentgenol 207 362–8 Online: 10.2214/AJR.15.15559 [DOI] [PubMed] [Google Scholar]
- Vontobel J, Liga R, Possner M, Clerc OF, Mikulicic F, Veit-Haibach P, ter Voert EEGW, Fuchs TA, Stehli J, Pazhenkottil AP, Benz DC, Gräni C, Gaemperli O, Herzog B, Buechel RR and Kaufmann PA 2015. MR-based attenuation correction for cardiac FDG PET on a hybrid PET/MRI scanner: comparison with standard CT attenuation correction Eur. J. Nucl. Med. Mol. Imaging 42 1574–80 Online: http://link.springer.com/10.1007/s00259-015-3089-3 [DOI] [PubMed] [Google Scholar]
- Wang Y, Liu C, Zhang X and Deng W 2019. Synthetic CT Generation Based on T2 Weighted MRI of Nasopharyngeal Carcinoma (NPC) Using a Deep Convolutional Neural Network (DCNN). Front. Oncol 9 1333. [DOI] [PMC free article] [PubMed] [Google Scholar]
- Wangerin KA, Baratto L, Khalighi MM, Hope TA, Gulaka PK, Deller TW and Iagaru AH 2018. Clinical Evaluation of 68 Ga-PSMA-II and 68 Ga-RM2 PET Images Reconstructed With an Improved Scatter Correction Algorithm Am. J. Roentgenol 211 655–60 Online: https://www.ajronline.org/doi/10.2214/AJR.17.19356 [DOI] [PubMed] [Google Scholar]
- Watson CC 2014. Supplemental transmission method for improved PET attenuation correction on an integrated MR/PET Nucl. Instruments Methods Phys. Res. Sect. A Accel. Spectrometers, Detect. Assoc. Equip 734 191–5 Online: http://www.sciencedirect.com/science/article/pii/S0168900213012096 [Google Scholar]
- Weiger M, Stampanoni M and Pruessmann KP 2013. Direct depiction of bone microstructure using MRI with zero echo time Bone 54 44–7 [DOI] [PubMed] [Google Scholar]
- Wiemker R and Pekar V 2001. Fast computation of isosurface contour spectra for volume visualization CARS 2001: Computer Assisted Radiology and Surgery International Congress Series vol 1230, ed K Lemke HU and Vannier MW and Inamura K and Farman AG and Doi (Amsterdam, Netherlands: Elsevier Science BV; ) pp 372–7 [Google Scholar]
- Wiesinger F, Bylund M, Yang J, Kaushik S, Shanbhag D, Ahn S, Jonsson JH, Lundman JA, Hope T, Nyholm T, Larson P and Cozzini C 2018. Zero TE-based pseudo-CT image conversion in the head and its application in PET/MR attenuation correction and MR-guided radiation therapy planning. Magn. Reson. Med 80 1440–51 Online: http://doi.wiley.com/10.1002/mrm.27134 [DOI] [PubMed] [Google Scholar]
- Wiesinger F, Kaushik S, Menini A, Ahn S, Cheng L, Cozzini C, Hope TA, Yang J, Larson P and Shanbhag D 2016a. Whole Body Skeletal Imaging Using Zero TEe 24th Annual Meeting & Exhibition, ISMRM [Google Scholar]
- Wiesinger F, Sacolick LI, Menini A, Kaushik SS, Ahn S, Veit-Haibach P, Delso G and Shanbhag DD 2016b. Zero TE MR Bone Imaging in the Head Magn. Reson. Med 75 107–14 [DOI] [PubMed] [Google Scholar]
- Wollenweber SD, Ambwani S, Delso G, Lonn AHR, Mullick R, Wiesinger F, Piti Z, Tari A, Novak G and Fidrich M 2013a. Evaluation of an Atlas-Based PET Head Attenuation Correction Using PET/CT & MR Patient Data IEEE Trans. Nucl. Sci 60 3383–90 Online: http://ieeexplore.ieee.org/document/6583257/ [Google Scholar]
- Wollenweber SD, Ambwani S, Lonn AHR, Shanbhag DD, Thiruvenkadam S, Kaushik S, Mullick R, Qian H, Delso G and Wiesinger F 2013b. Comparison of 4-Class and Continuous Fat/Water Methods for Whole-Body, MR-Based PET Attenuation Correction IEEE Trans. Nucl. Sci 60 3391–8 Online: http://ieeexplore.ieee.org/document/6616631/ [Google Scholar]
- Wolterink JM, Dinkla AM, Savenije MHF, Seevinck PR, van den Berg CAT and Išgum I 2017. Deep MR to CT Synthesis Using Unpaired Data pp 14–23 Online: http://link.springer.com/10.1007/978-3-319-68127-6_2 [Google Scholar]
- Xin J, Ma Q, Guo Q, Sun H, Zhang S, Liu C and Zhai W 2016. PET/MRI with diagnostic MR sequences vs PET/CT in the detection of abdominal and pelvic cancer Eur. J. Radiol 85 751–9 Online: https://linkinghub.elsevier.com/retrieve/pii/S0720048X16300109 [DOI] [PubMed] [Google Scholar]
- Yang J, Liu J, Wiesinger F, Menini A, Zhu X, Hope TA, Seo Y and Larson PEZ 2018a. Developing an efficient phase-matched attenuation correction method for quiescent period PET in abdominal PET/MRI. Phys. Med. Biol 63 185002 Online: http://stacks.iop.org/0031-9155/63/i=18/a=185002?key=crossref.743221d34e9b9b757685db68625ef172 [DOI] [PMC free article] [PubMed] [Google Scholar]
- Yang J, Park D, Gullberg GT and Seo Y 2019. Joint correction of attenuation and scatter in image space using deep convolutional neural networks for dedicated brain 18 F-FDG PET Phys. Med. Biol 64 075019 Online: https://iopscience.iop.org/article/10.1088/1361-6560/ab0606 [DOI] [PMC free article] [PubMed] [Google Scholar]
- Yang J, Wiesinger F, Kaushik S, Shanbhag D, Hope TA, Larson PEZ and Seo Y 2017. Evaluation of sinus/edge-corrected zero-echo-time–Based attenuation correction in brain PET/MRI J. Nucl. Med 58 1873–9 Online: http://jnm.snmjournals.org/lookup/doi/10.2967/jnumed.116.188268 [DOI] [PMC free article] [PubMed] [Google Scholar]
- Yang W, Zhong L, Chen Y, Lin L, Lu Z, Liu S, Wu Y, Feng Q and Chen W 2018b. Predicting CT Image From MRI Data Through Feature Matching With Learned Nonlinear Local Descriptors. IEEE Trans. Med. Imaging 37 977–87 Online: https://ieeexplore.ieee.org/document/8249878/ [DOI] [PubMed] [Google Scholar]
- Zhan Y, Zhou XS, Peng Z and Krishnan A 2008. Active scheduling of organ detection and segmentation in whole-body medical images. Med. Image Comput. Comput. Assist. Interv 11 313–21 Online: http://link.springer.com/10.1007/978-3-540-85988-8_38 [DOI] [PubMed] [Google Scholar]
- Zho SY, Kim MO, Lee KW and Kim DH 2013. Artifact reduction from metallic dental materials in T1-weighted spin-echo imaging at 3.0 tesla J Magn Reson Imaging 37 471–8 [DOI] [PubMed] [Google Scholar]