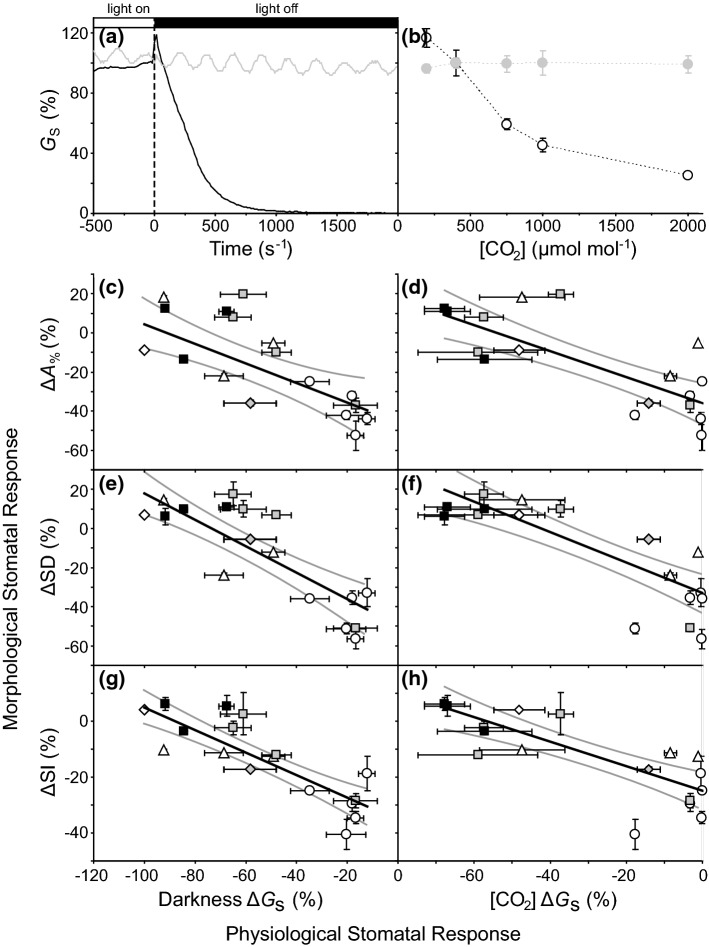
Fig. 7.
Typical responses of species with active (black line and black data points) and passive (grey line and grey data points) physiological stomatal behaviour to a a transition from light to dark and b a step increases in [CO2] from 200 to 2000 μmol mol−1 (Gs is expressed as a percentage relative to the point where illumination was ended at time 0 and Gs at 400 μmol mol−1). The relative change in epidermal and stomatal morphological parameters in plants grown in ambient (400 μmol mol−1) and extremely elevated (1500 or 2000 μmol mol−1) [CO2] versus the physiological Gs response to darkness (darkness ∆Gs) or a change in [CO2] from 400 to 2000 μmol mol−1 ([CO2] ∆Gs): c) ∆A% versus darkness ∆Gs (linear regression P = 0.0007.517 × 10–4; F1,19 = 16.067; R2 = 0.458); d ∆A% versus [CO2] ∆Gs (linear regression P = 5.718 × 10⁻⁵; F1,19 = 26.502; R2 = 0.582); e ∆SD versus darkness ∆Gs (linear regression P = 2.489 × 10⁻⁶; F1,19 = 43.771; R2 = 0.697); f ∆SD versus [CO2] ∆Gs (linear regression P = 7.053 × 10⁻⁶; F1,19 = 37.383; R2 = 0.663); g ∆SI versus darkness ∆Gs (linear regression P = 7.754 × 10⁻⁷; F1,19 = 51.812; R2 = 0.7316), and; h ∆SI versus [CO2] ∆Gs (linear regression P = 2.455 × 10⁻⁵; F1,19 = 30.608; R2 = 0.617). Presented as in Fig. 2 (data from Haworth et al. 2013, 2015; Elliott-Kingston et al. 2016).

